Intelligent Investment
A Quadrant Approach to Commercial Real Estate Investing: Public Debt
July 12, 2024 6 Minute Read

Executive Summary
Receive EA Insights Directly in your Inbox
- Commercial mortgage-backed securities (CMBS) allow fixed-income investors to gain exposure to commercial mortgages based on their desired risk tolerance. Pricing reflects risk-free interest rates and risk premiums, expressed through spreads.
- CMBS subordinate bonds are typically more sensitive to real estate conditions than AAA-tranches.
- BBB-rated CMBS total returns are a function of the high-yield corporate bond returns, current leveraged and one-quarter lagged unleveraged property returns.
Introduction
This Viewpoint is the second in a series exploring the relationship between the CRE quadrants of public debt, private debt, private equity and public equity. Specifically, we will analyze the historic performance of public debt (BBB CMBS notes) in relation to the quadrants.
In this part of the series, we introduce some of the more important general capital market determinants of real estate value, return and risk. These variables are prominently featured in the econometric models that follow.
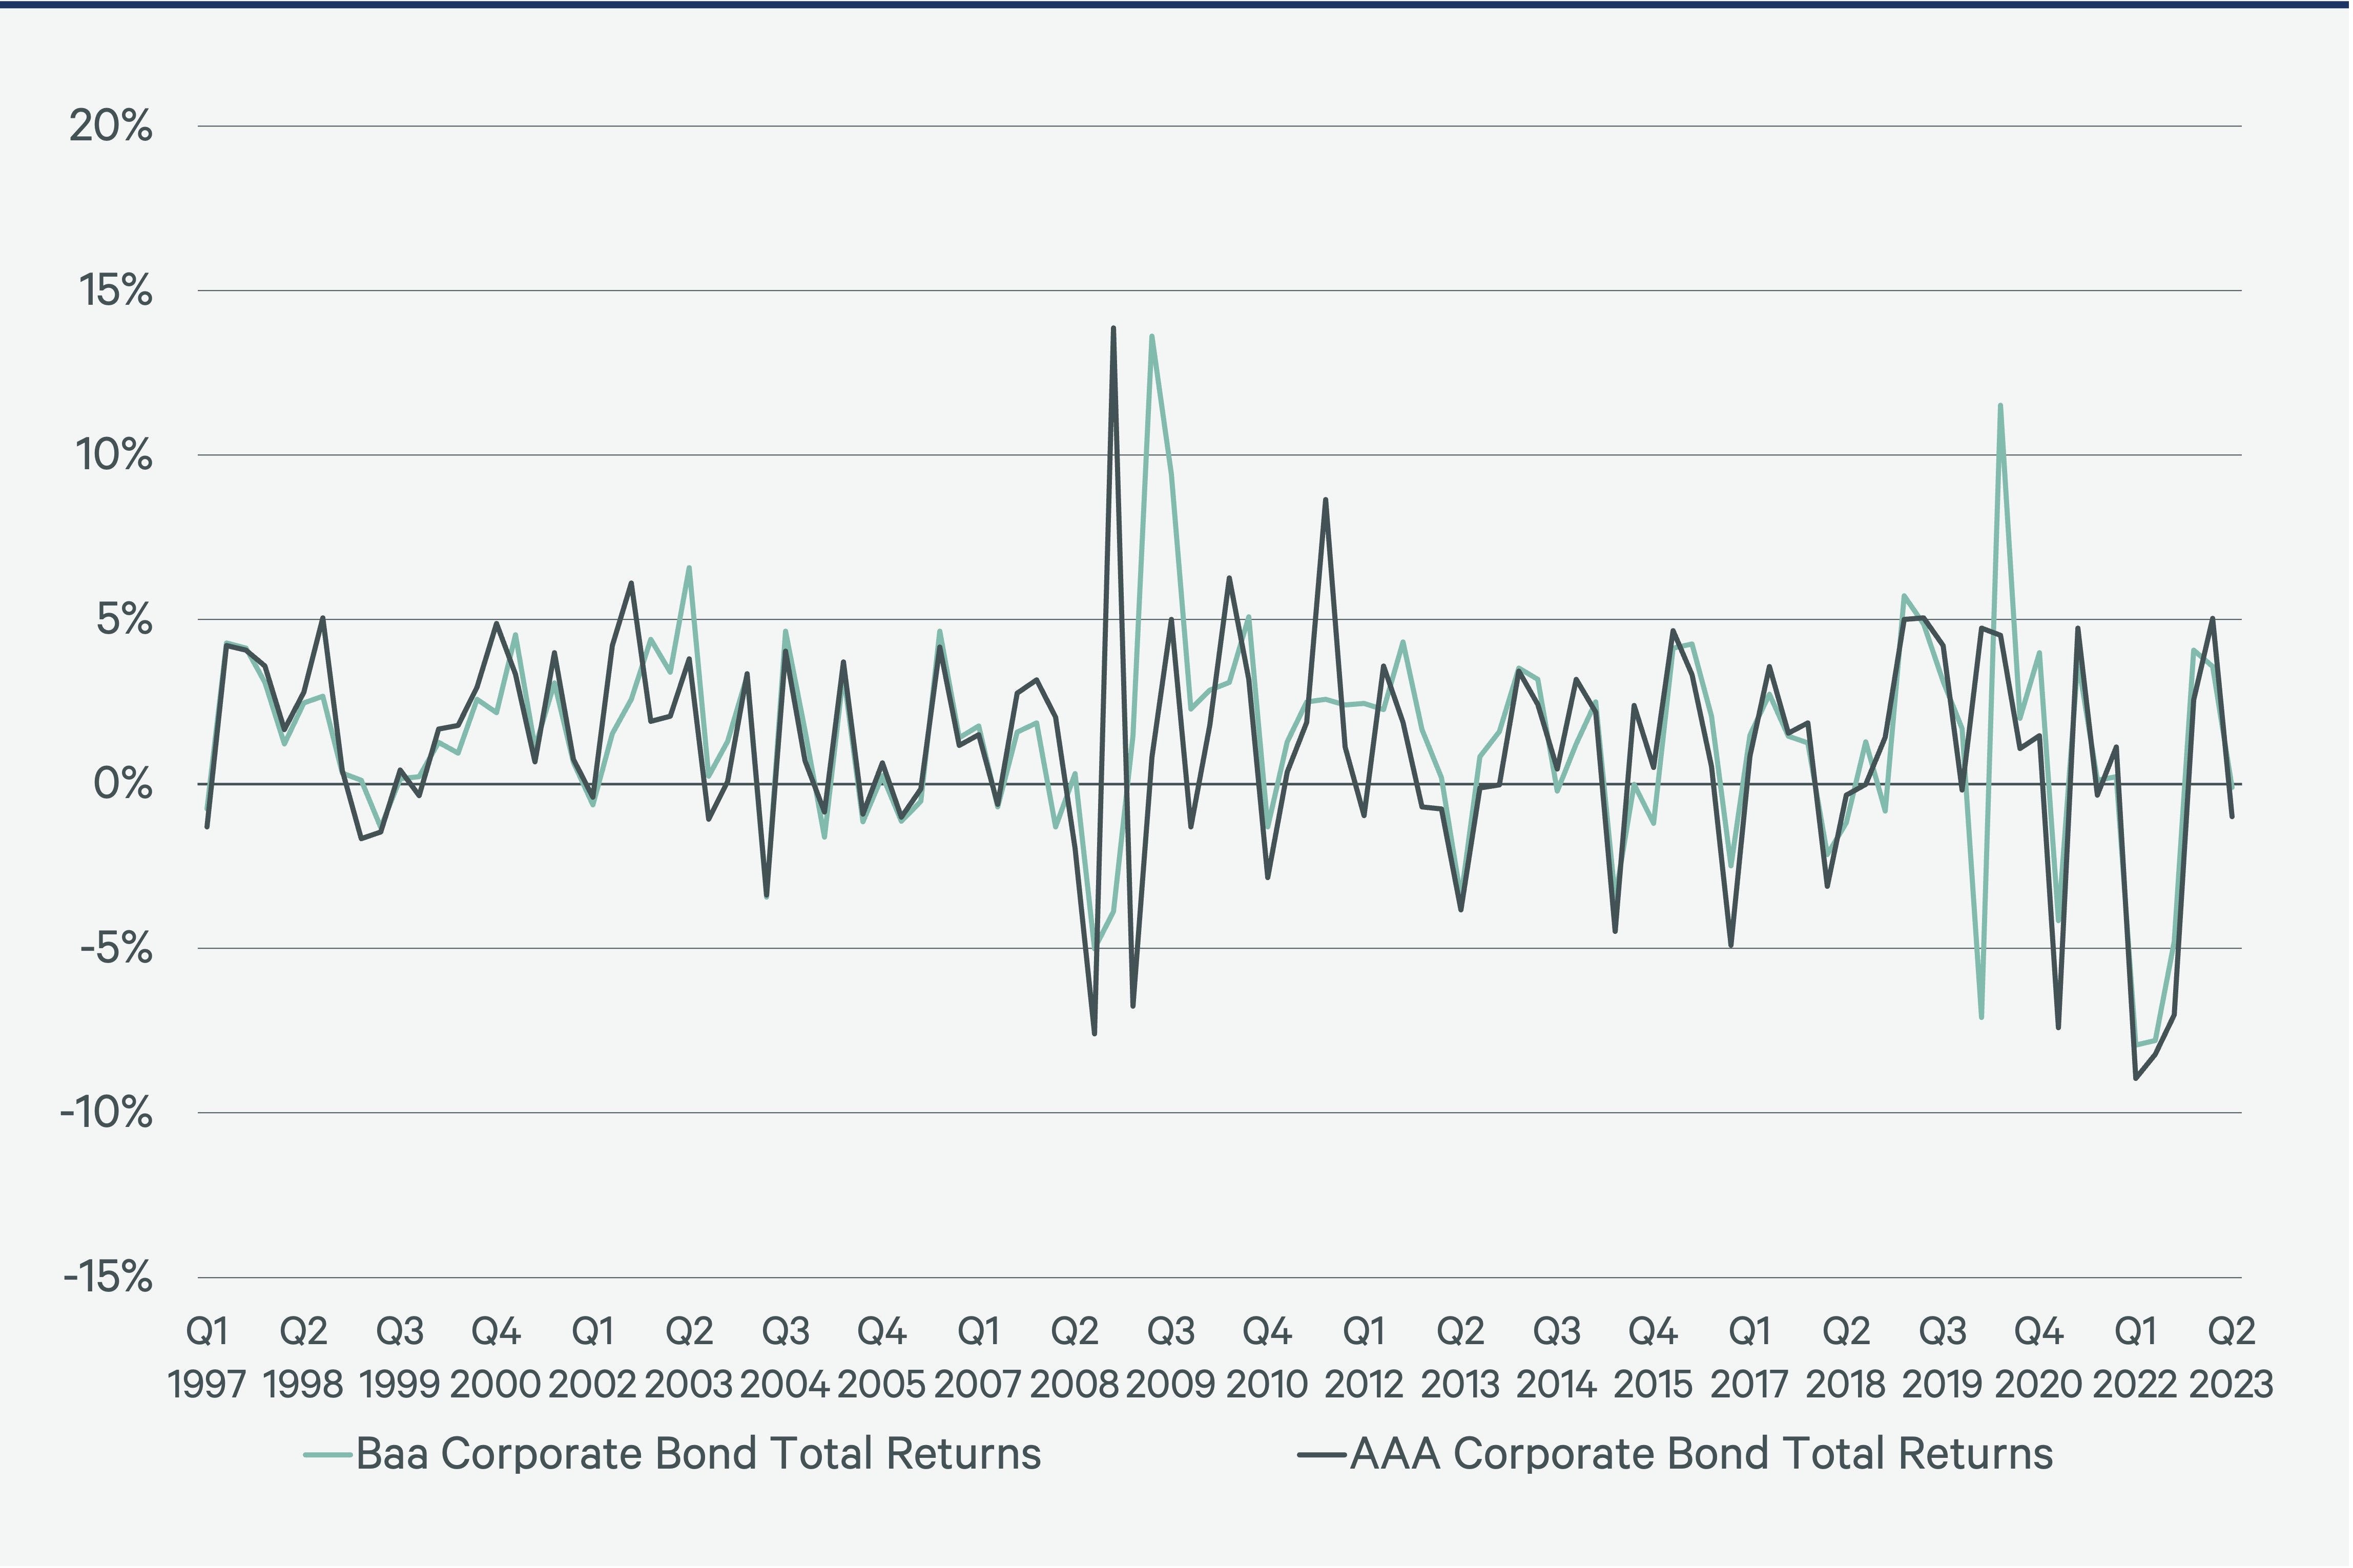
Figure 1 displays the yield curve, depicting U.S. Treasury bond yields by term at different dates. On October 14, 2021, before the Federal Reserve began raising their target rate, the one-month and 30-year horizon yields were 0.05% and 2.02%. By October 2023 those same yields rose to 5.60% and 4.78%. As of June 13, 2024, yields have decreased. The yield curve remains inverted with the 30-year yield (4.40%) below the 2-year yield (4.68%). The yield curve affects the capital markets in various ways. Investors consider the yield curve when pricing securities, both private and public, either directly or indirectly. Our analysis shows that seemingly unrelated bond yields and total returns are important factors in explaining the total returns of CMBS, mortgages, REITs and property. Baa-rated corporate bond yields, an important predictor of property yields, are more volatile than AAA-rated bonds, as shown in Figure 2.
Figure 1: Government Treasury Bond Yield Curves by Year: 2021-2024 (%)

Figure 2: AAA- and Baa-Rated Corporate Bond Total Returns (%)
Models
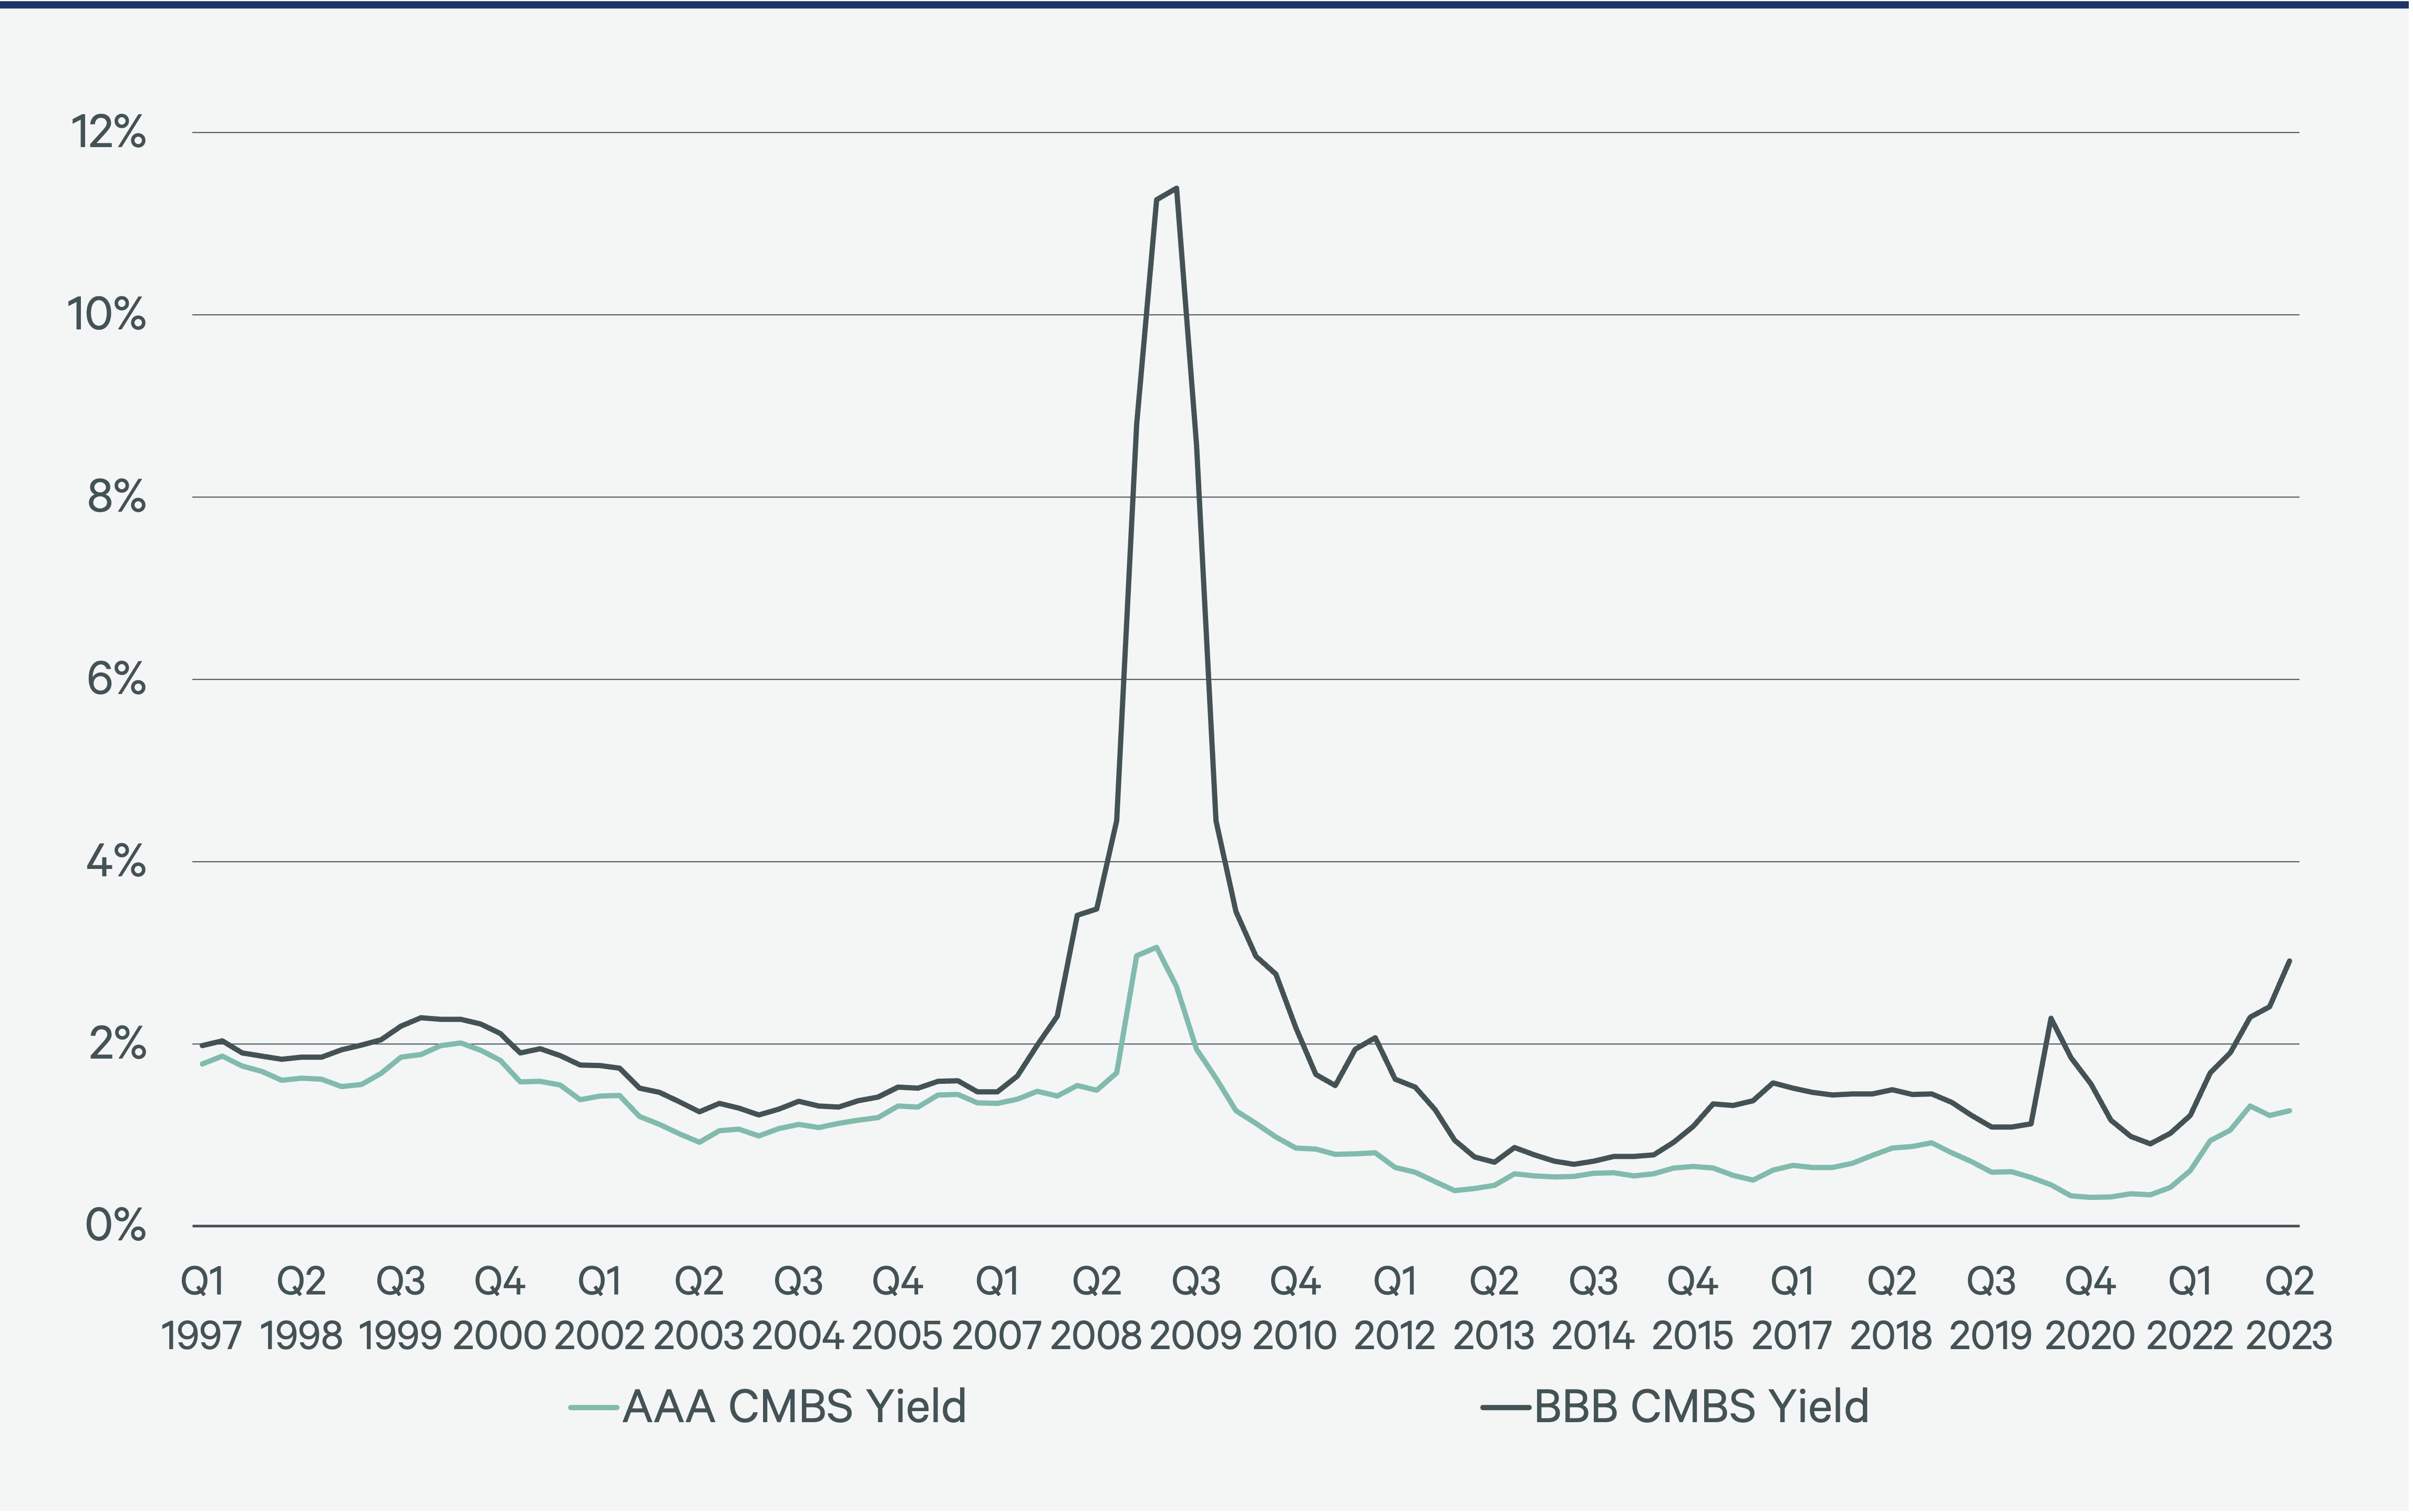
Our analysis specifically focuses on CMBS notes within the realm of public debt, although there are other forms of public debt such as CRE collateralized loan obligations (CLOs). Currently, returns are marginally negative, however, spreads, while still high, are moderating a bit, as shown in Figure 6. The BBB - AAA-rated CMBS bond spread, cyclically wide, is negatively correlated with the leveraged property total return. CMBS subordinate bonds are typically more sensitive to real estate conditions than are the AAA-tranches.
The correlation matrix from Part 1 of this Viewpoint series indicates the AAA-rated CMBS has a near-zero bivariate correlation with property, whereas BBB-rated CMBS has a higher, but still low, correlation with leveraged or unleveraged property. In general, BBB-rated bonds should be more sensitive to real estate fundamentals than AAA-rated bonds. The correlation of AAA-rated and BBB-rated CMBS returns is 0.661.
Figure 3: AAA-rated CMBS Total Returns (%)
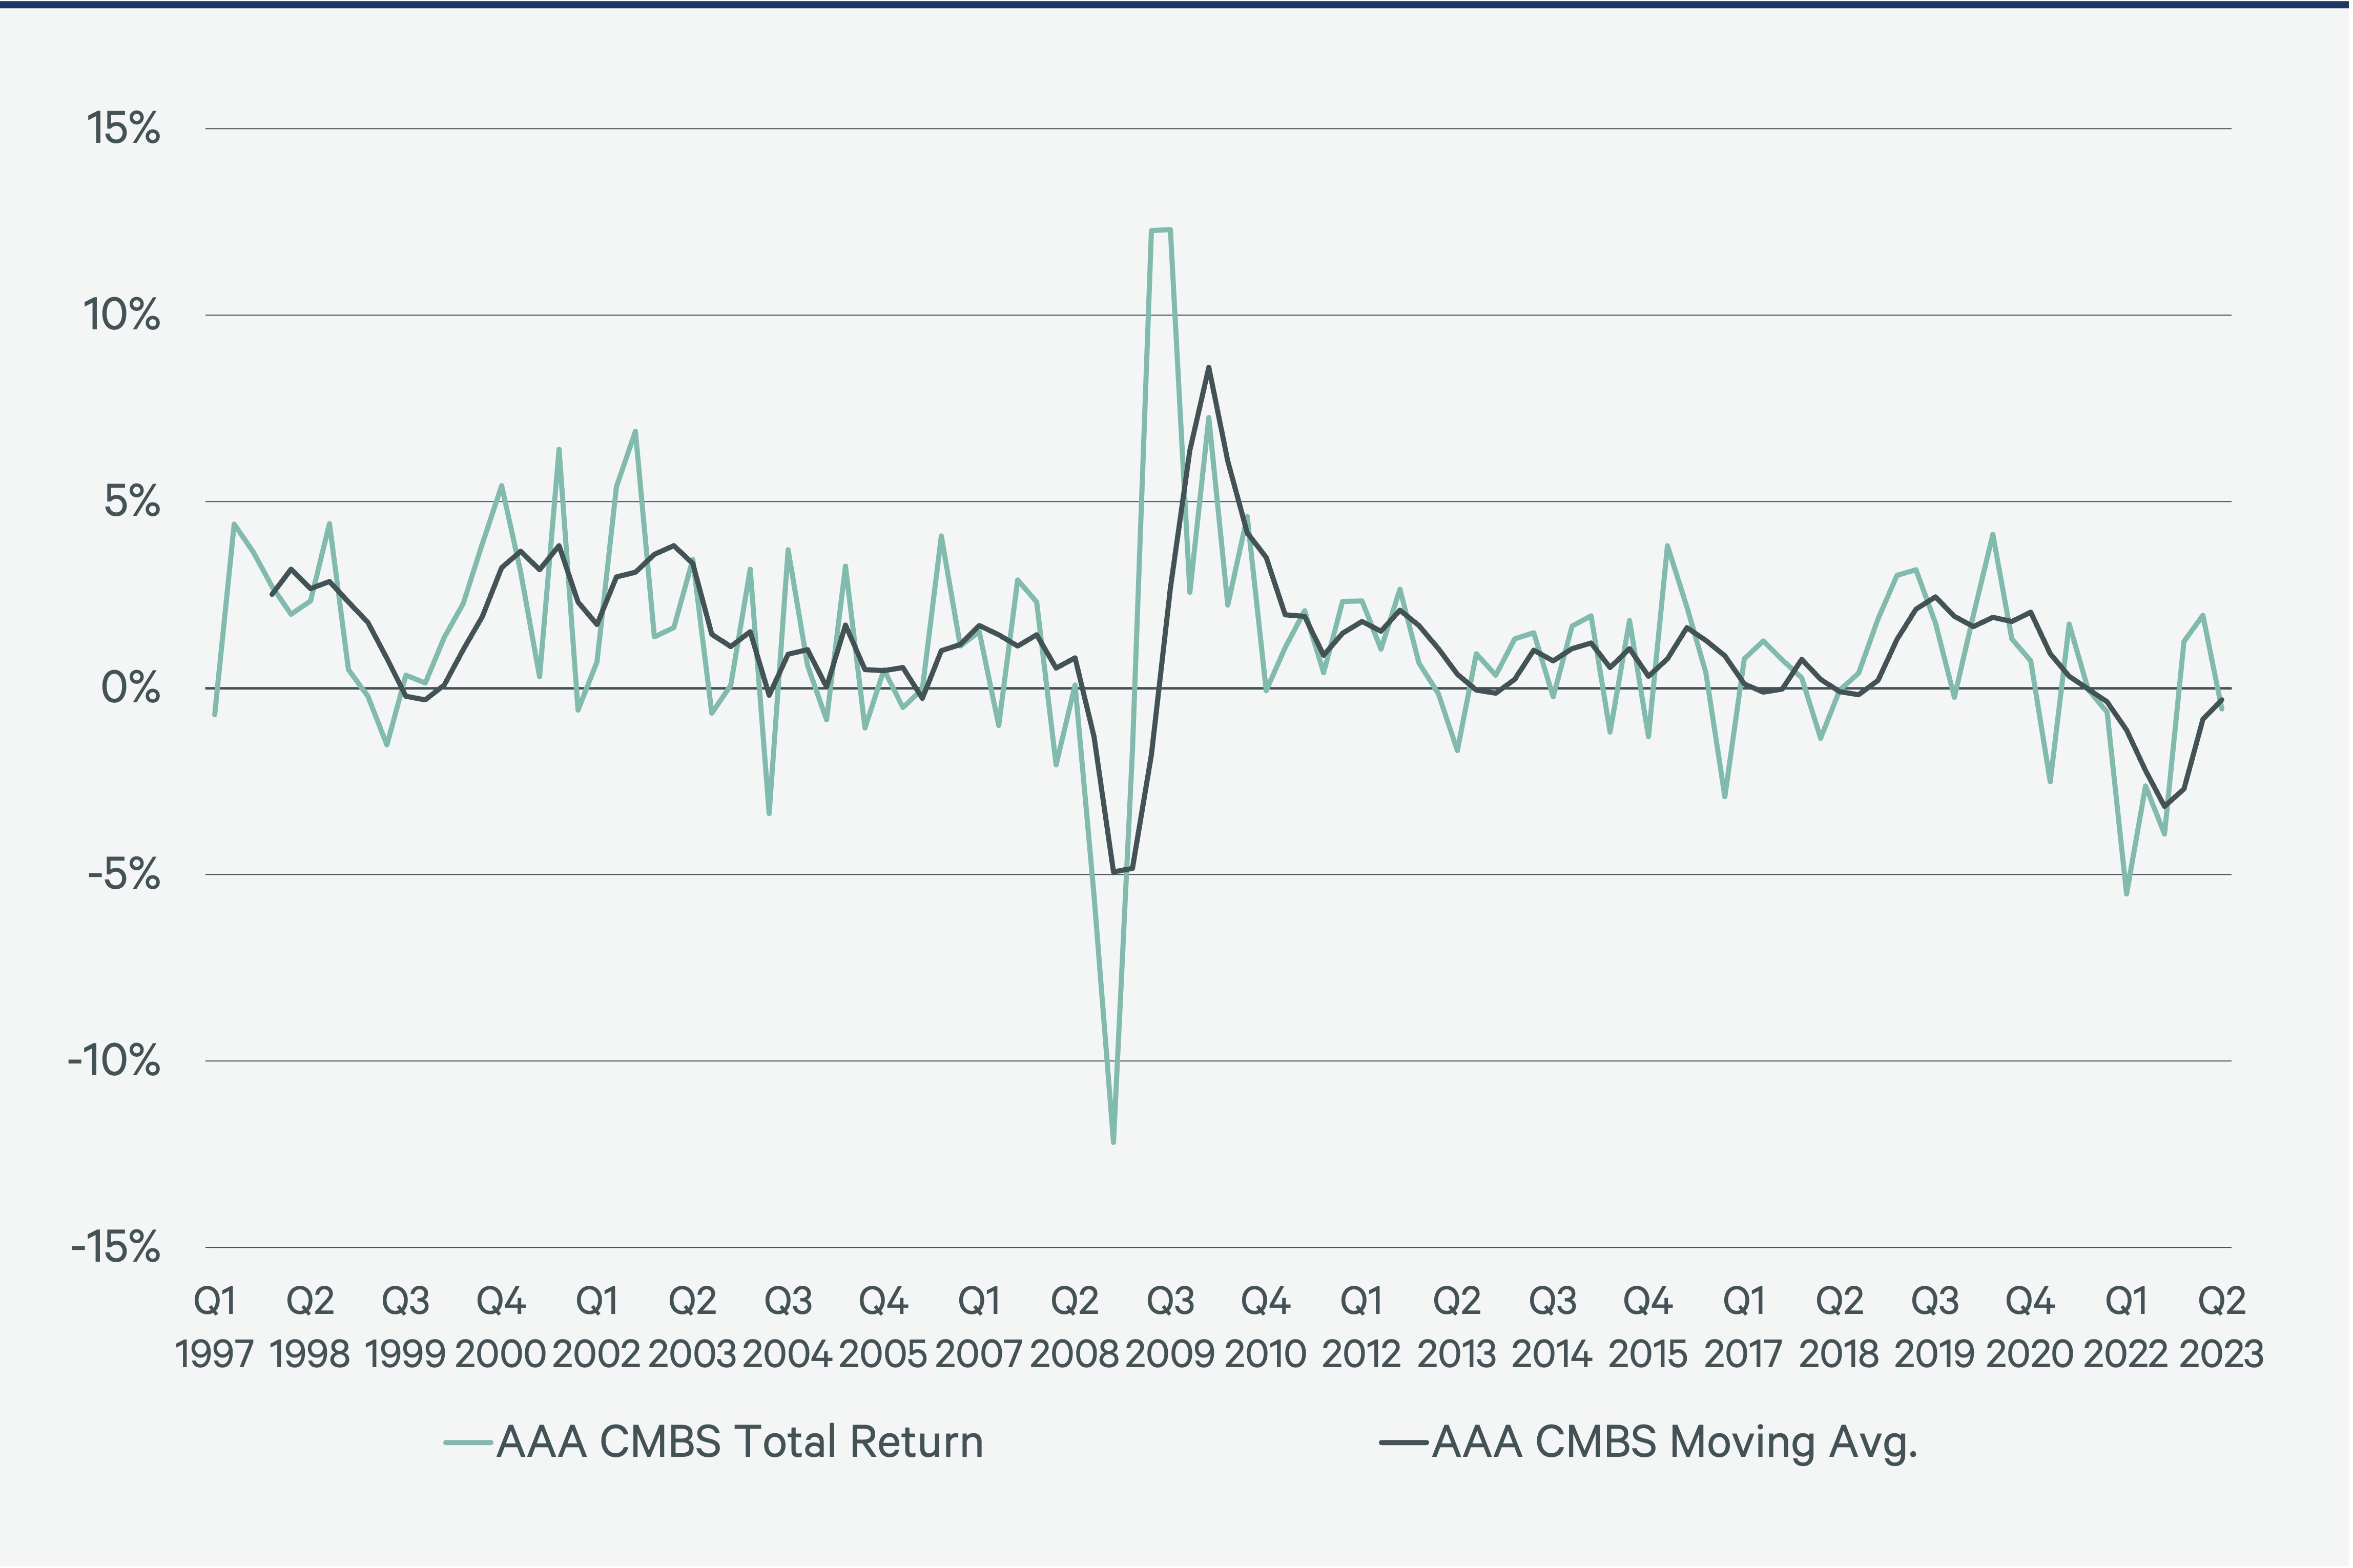
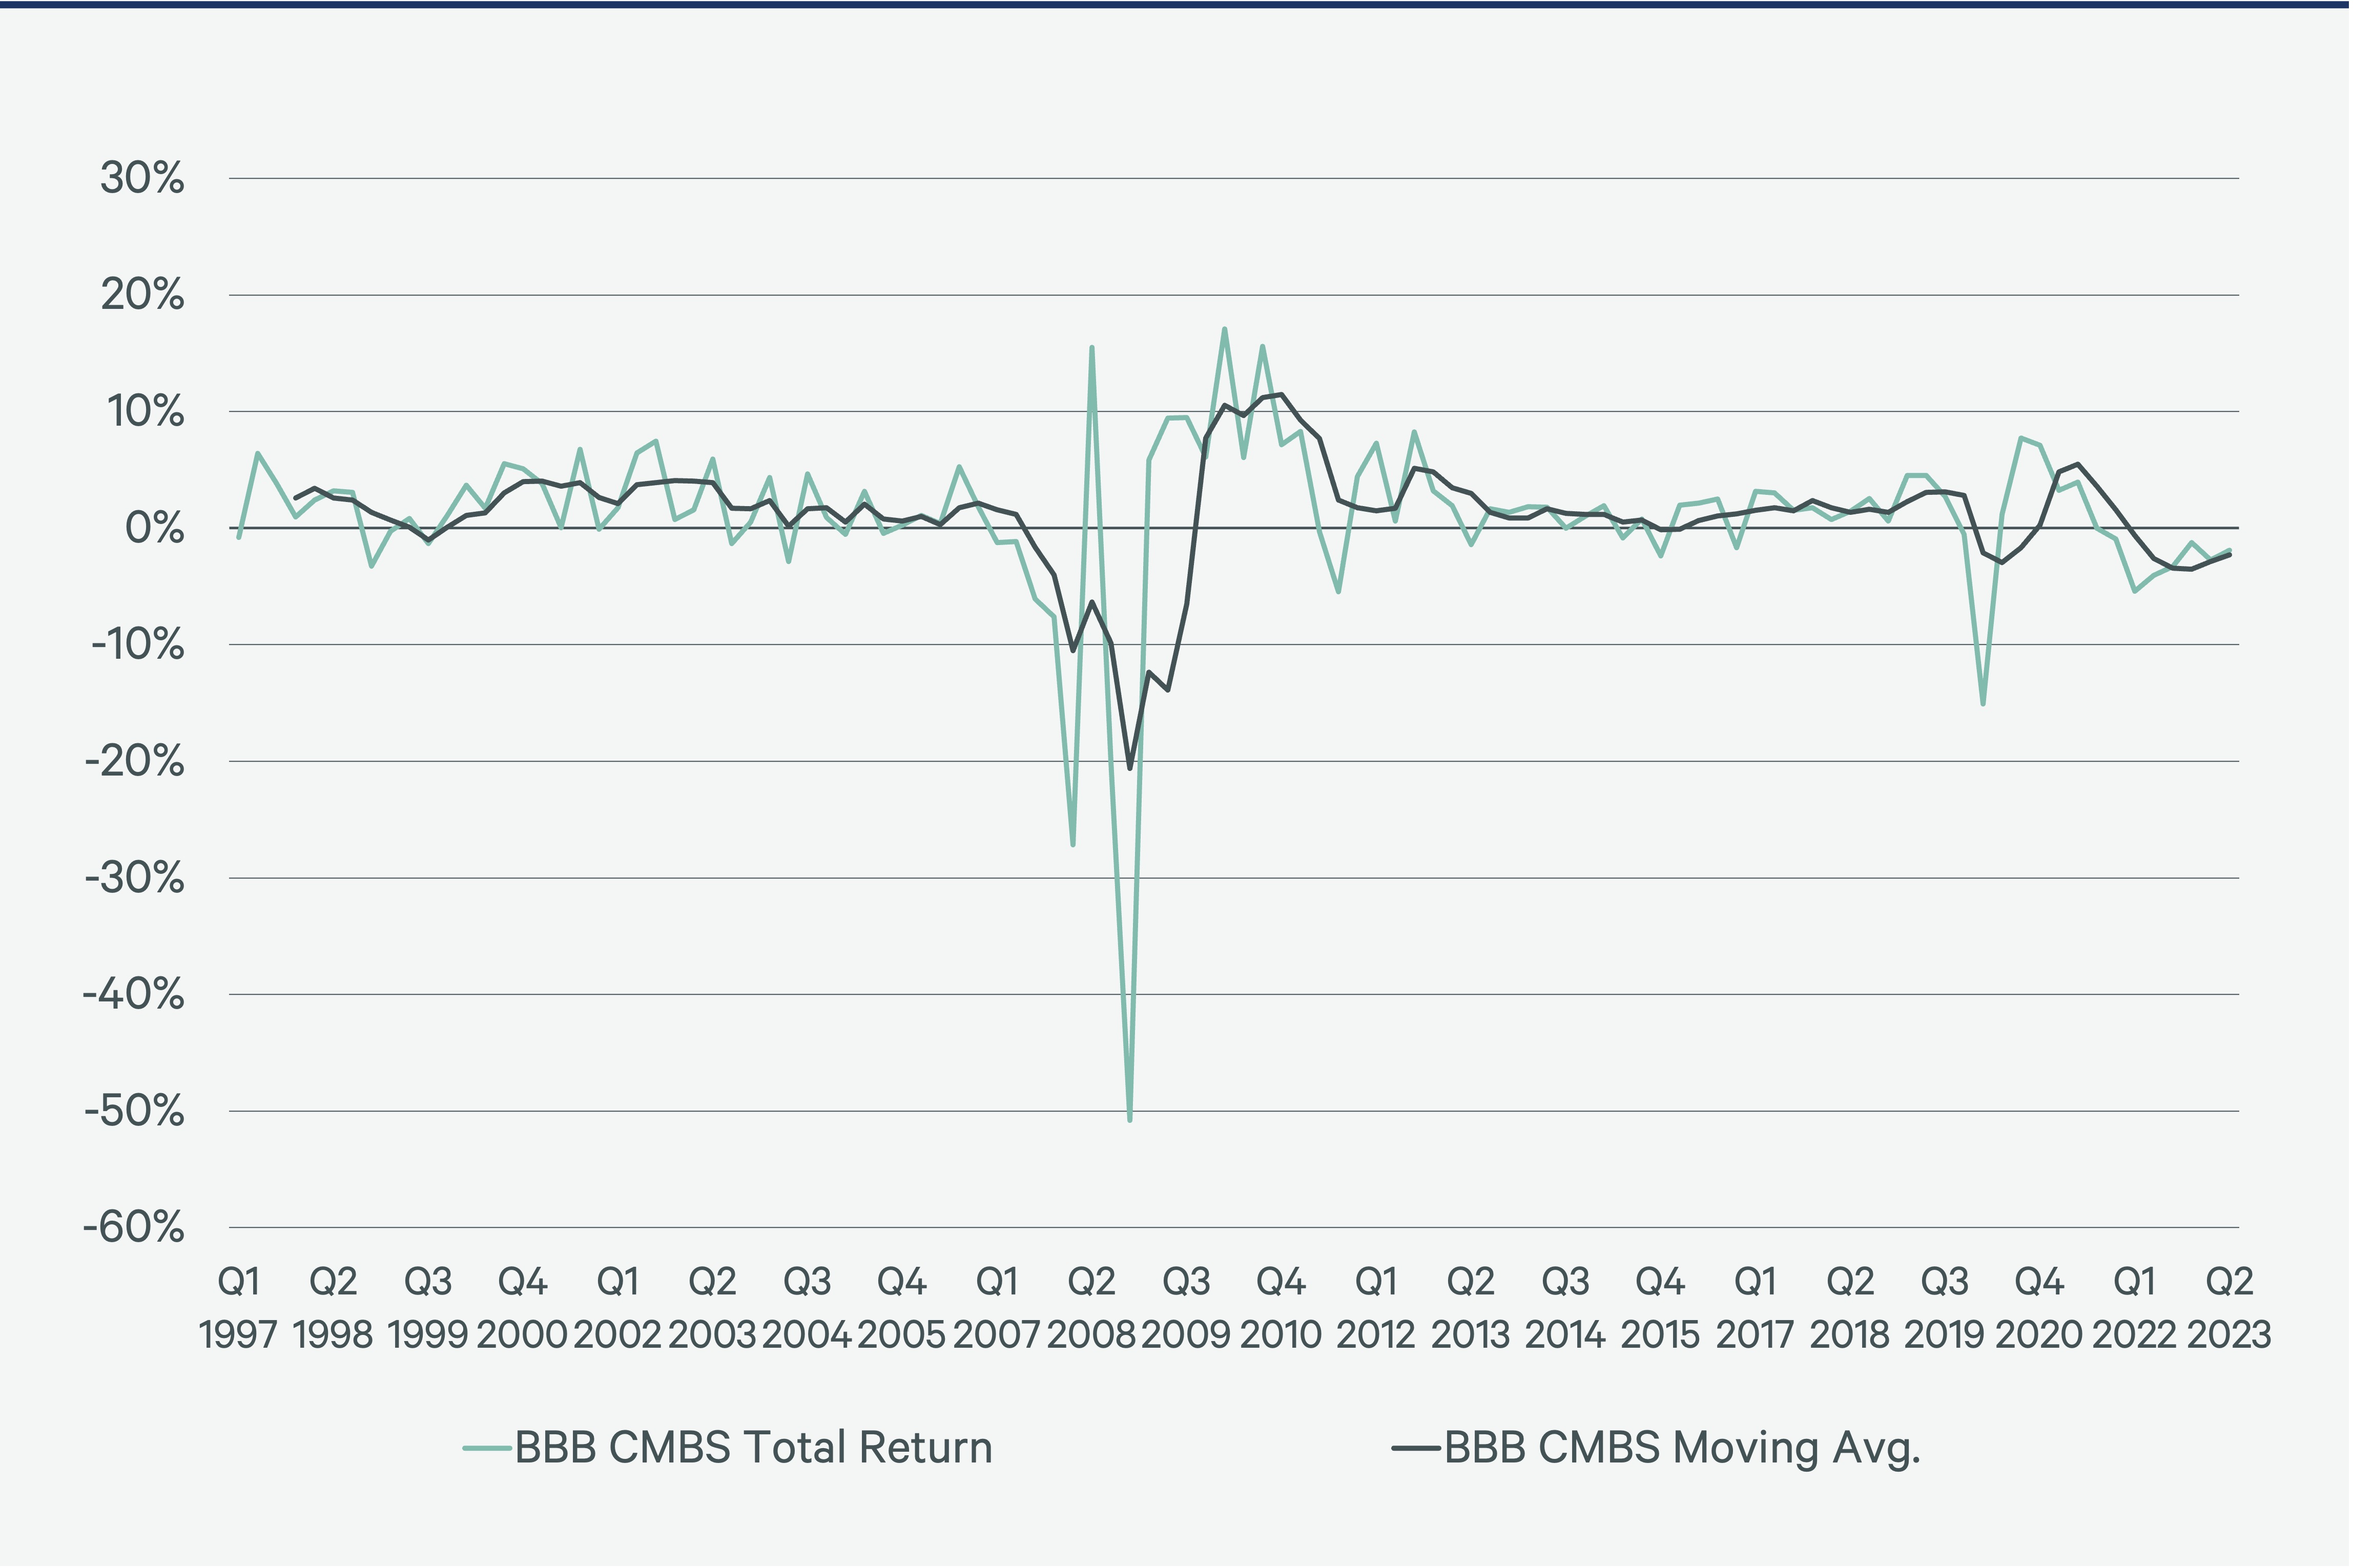
Figure 4: BBB-rated CMBS Total Returns (%)
The coefficients of variation—standard deviation divided by the mean—of AAA- and BBB-rated CMBS are 3.800 and 13.739, respectively. Corporate bonds do not exhibit this disparity, which may indicate thin trading volume and greater inefficiency in the subordinate CMBS market.
Figure 5: BBB-rated CMBS is More Volatile Than Baa Corporate Bonds (%)
The yields of the subordinate tranches are more sensitive than senior tranches to underlying real estate conditions and are therefore helpful in forecasting property performance. The CMBS BBB-AAA yield spread is inversely correlated with the NPI leveraged return (Figure 6). The CMBS subordinate and leveraged NPI property return are highly correlated, by contrast (Figure 7). BBB-rated CMBS is very sensitive to economic conditions (Figure 8).
Figure 6: CMBS BBB-AAA Yield Spread (L) and Leveraged NPI Total Return (R) (%)
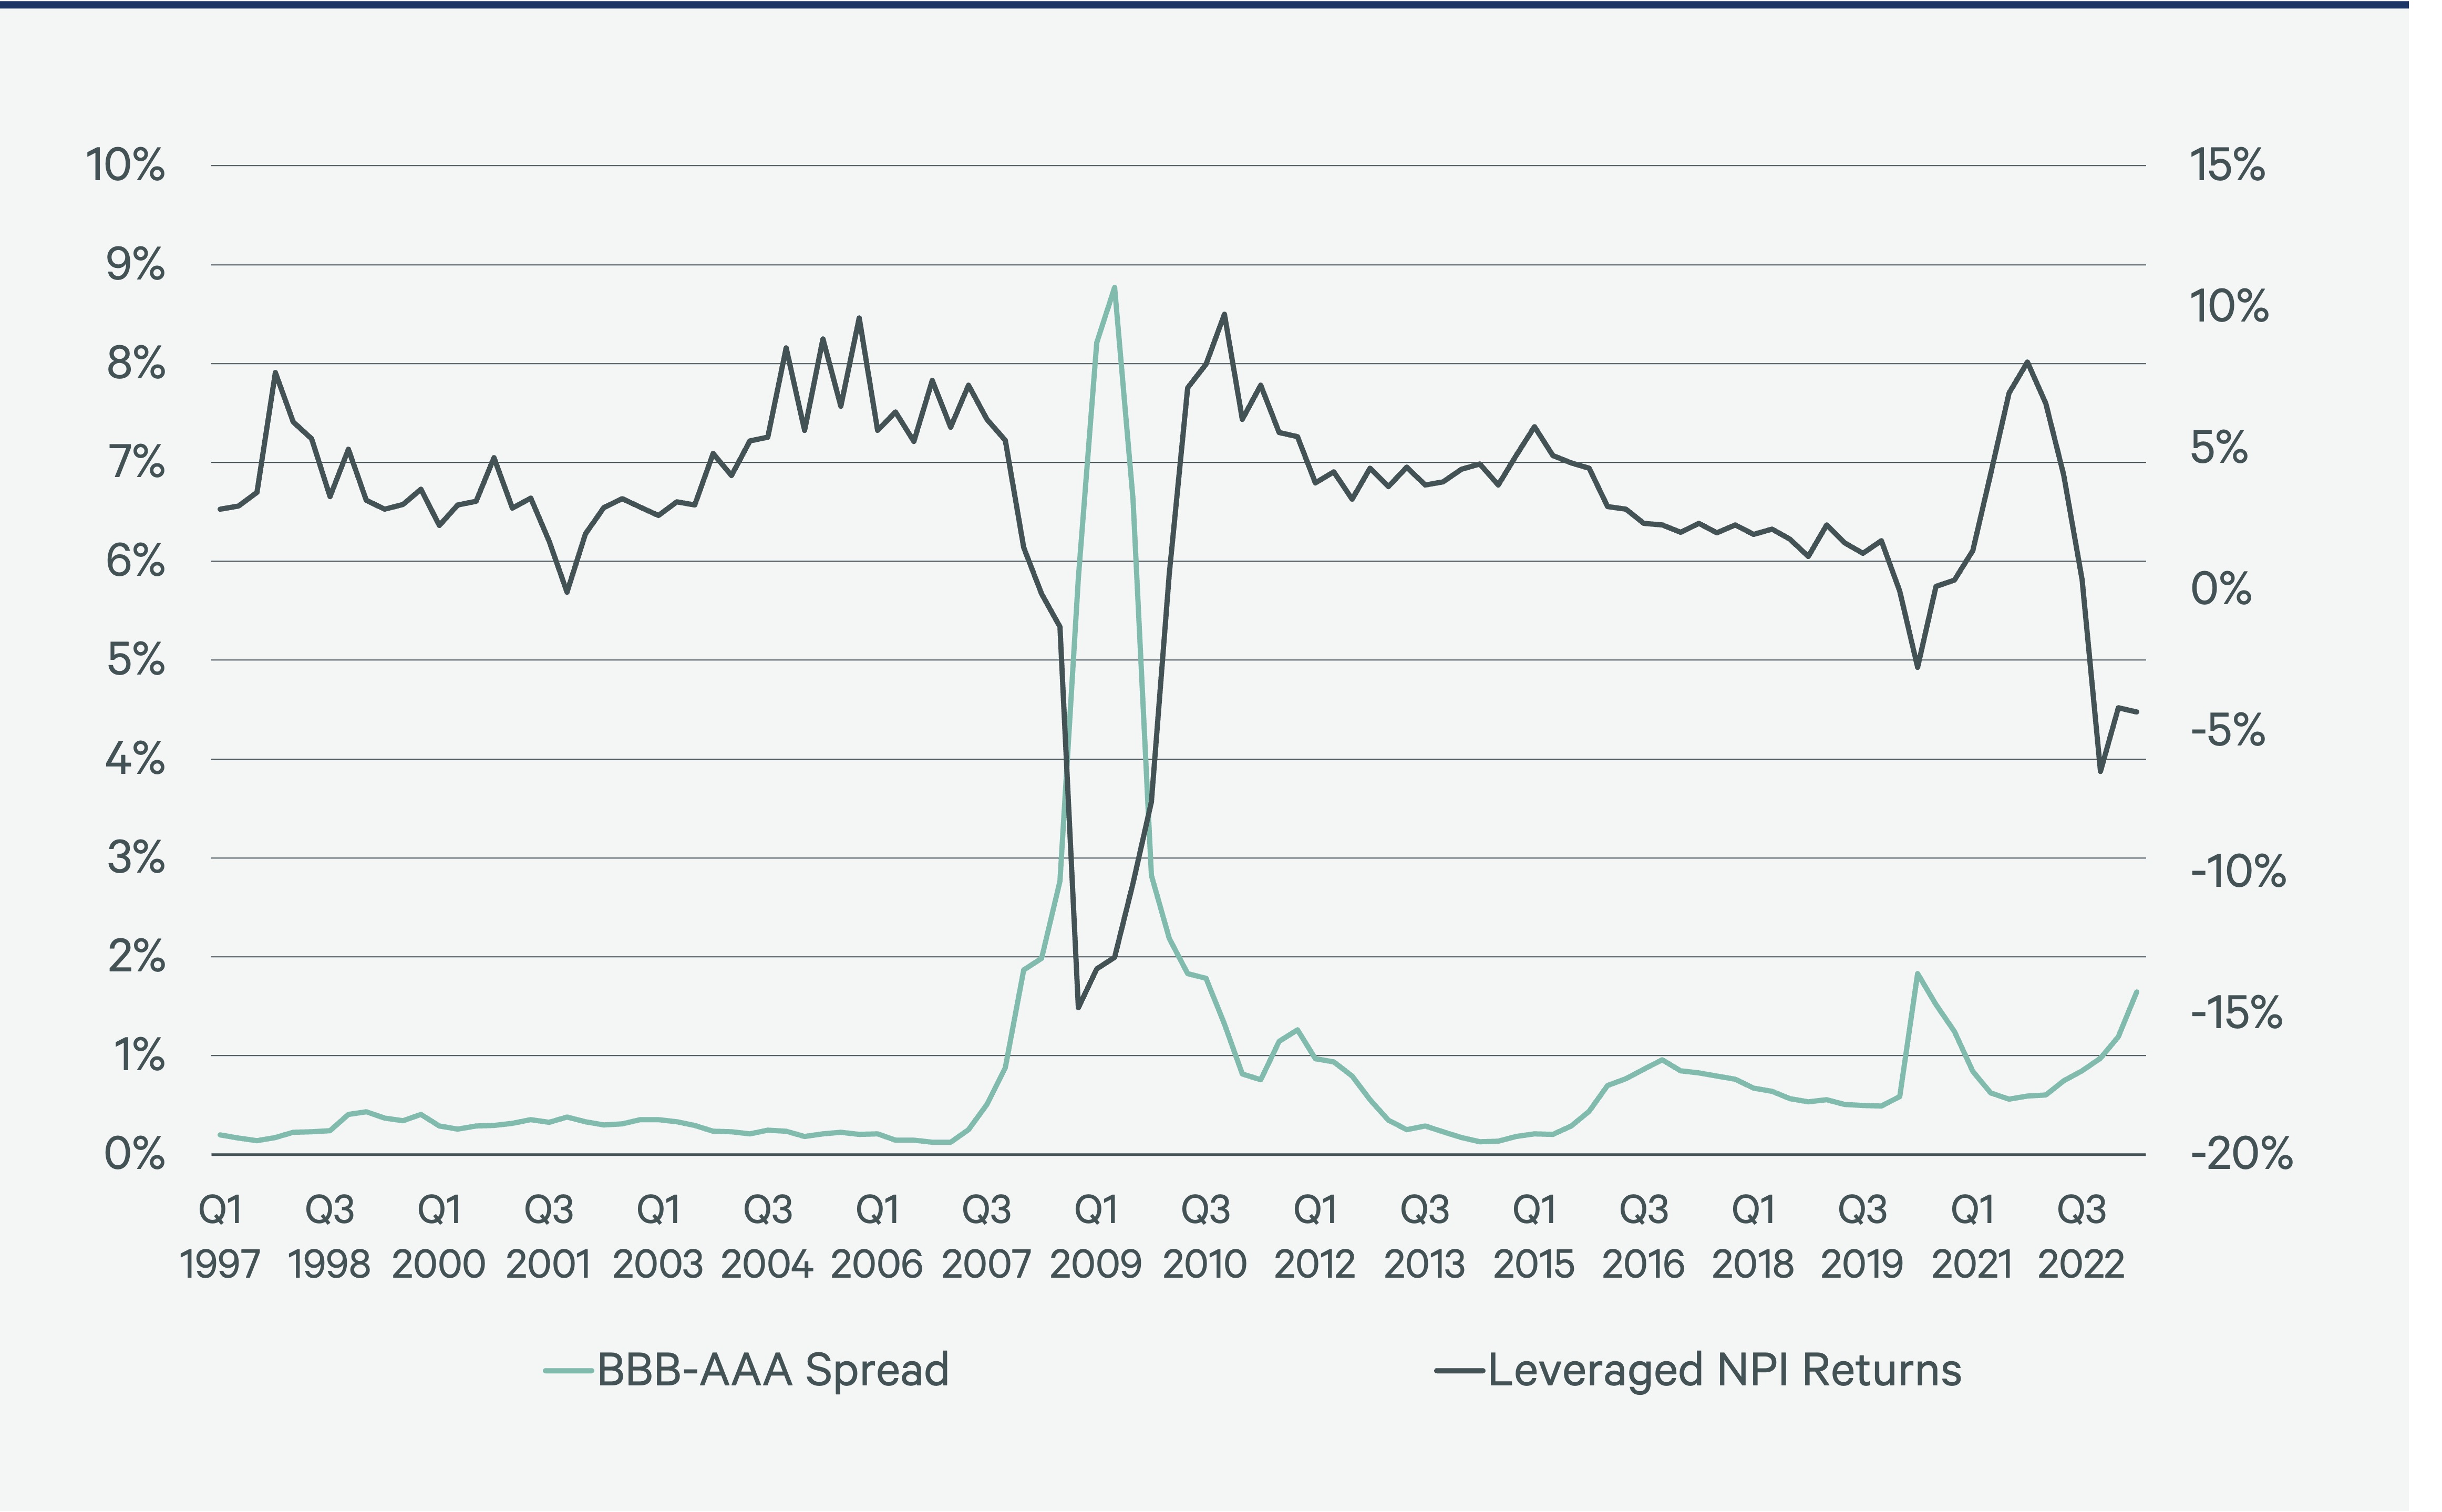
Figure 7: BBB-rated CMBS and Leveraged NPI Total Returns (%)

Figure 8: CMBS Yields Rise in Weak Markets (%)
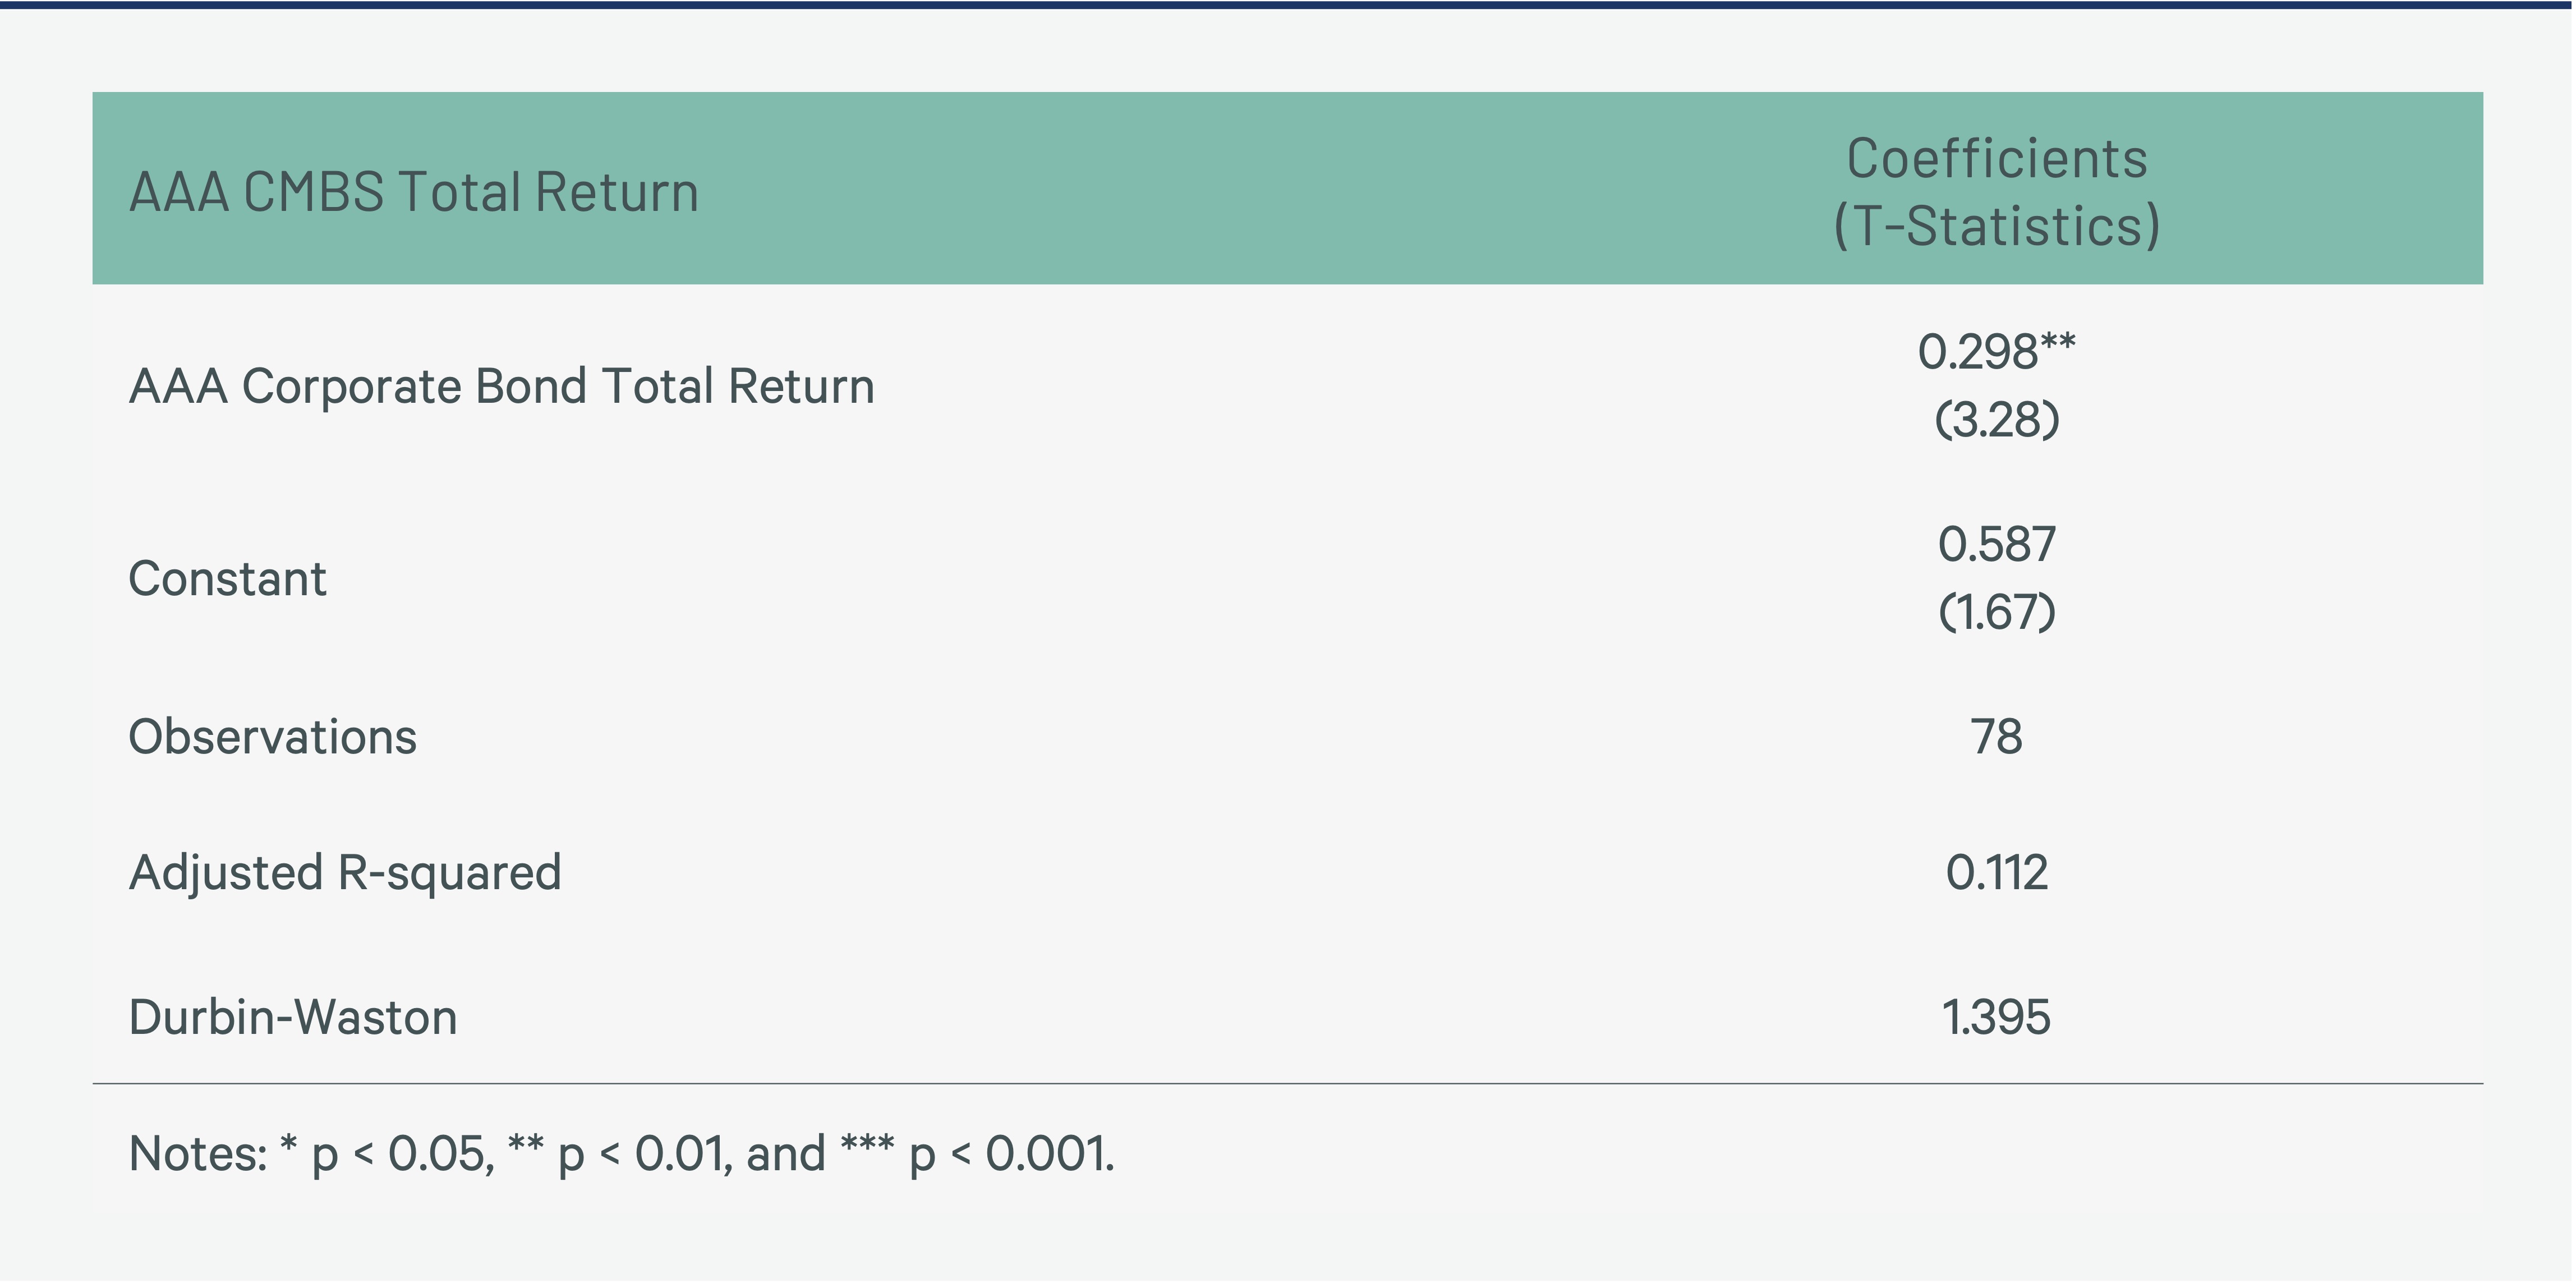
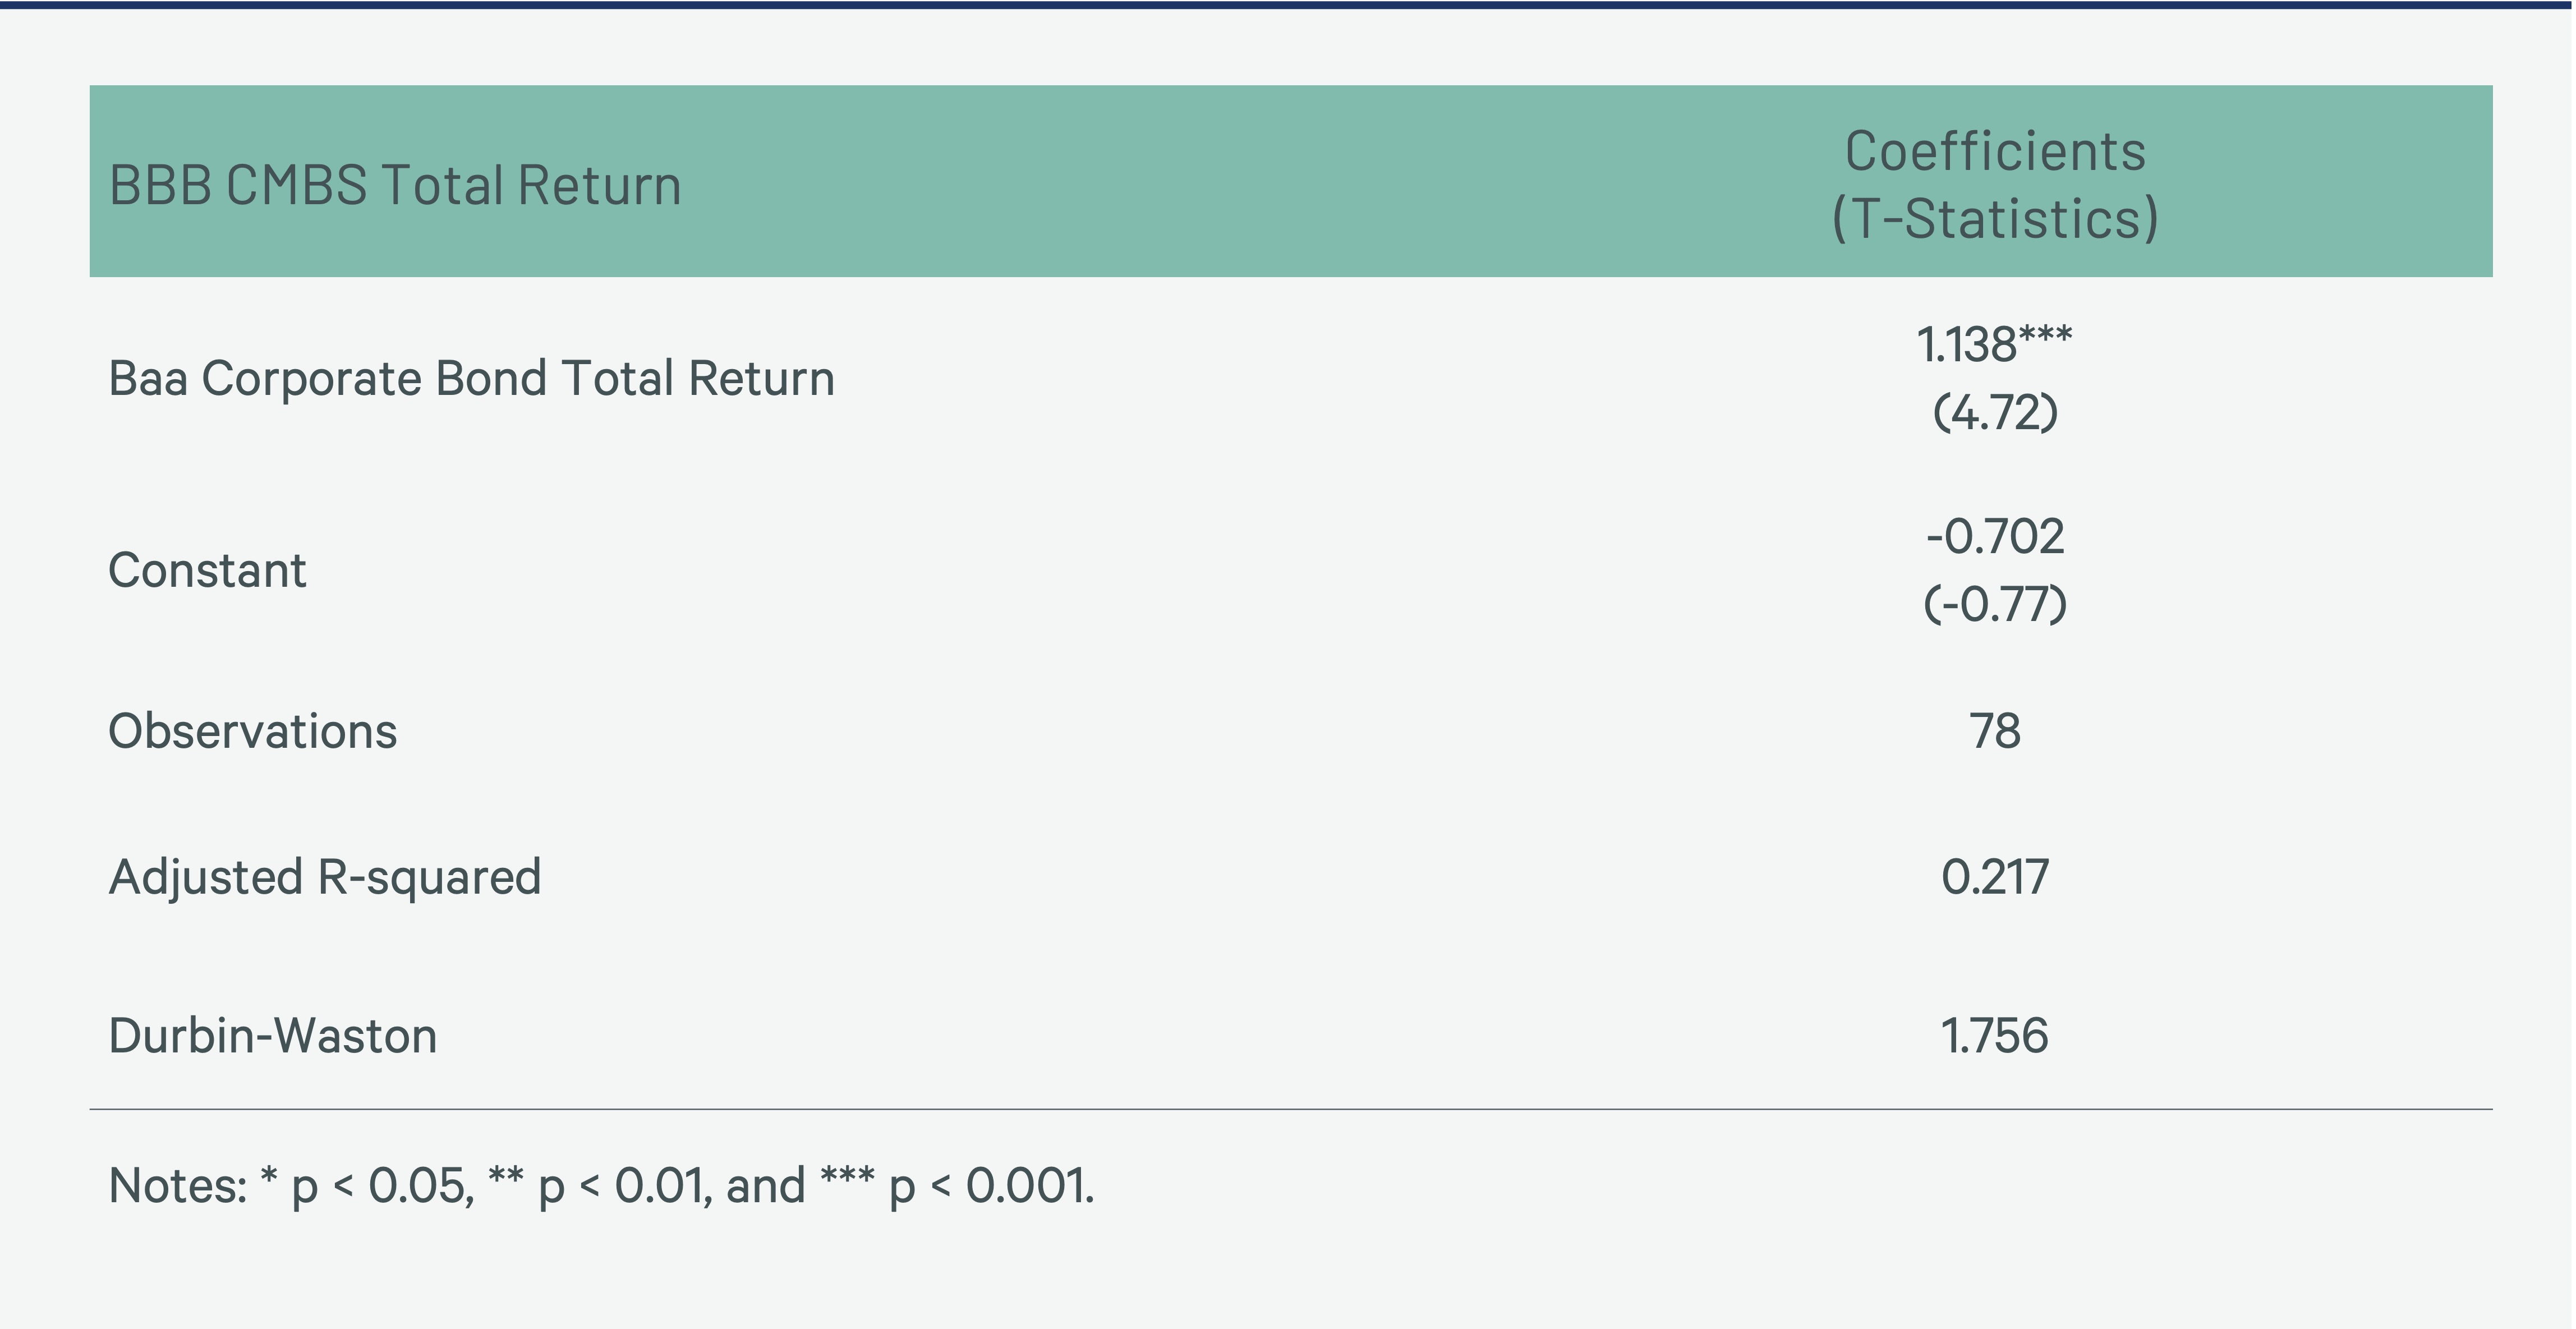
AAA-rated CMBS total returns are most sensitive to the AAA-rated corporate bond total return. Senior CMBS tranches and AAA-rated bonds are more sensitive to interest rates, whereas the BBB-rated CMBS and Baa-rated corporate bonds are not as strongly correlated since the BBB-rated CMBS returns are driven more by the usual real estate-specific factors.
Figure 9: AAA-rated CMBS and AAA-rated Corporate Bond Total Returns (%)
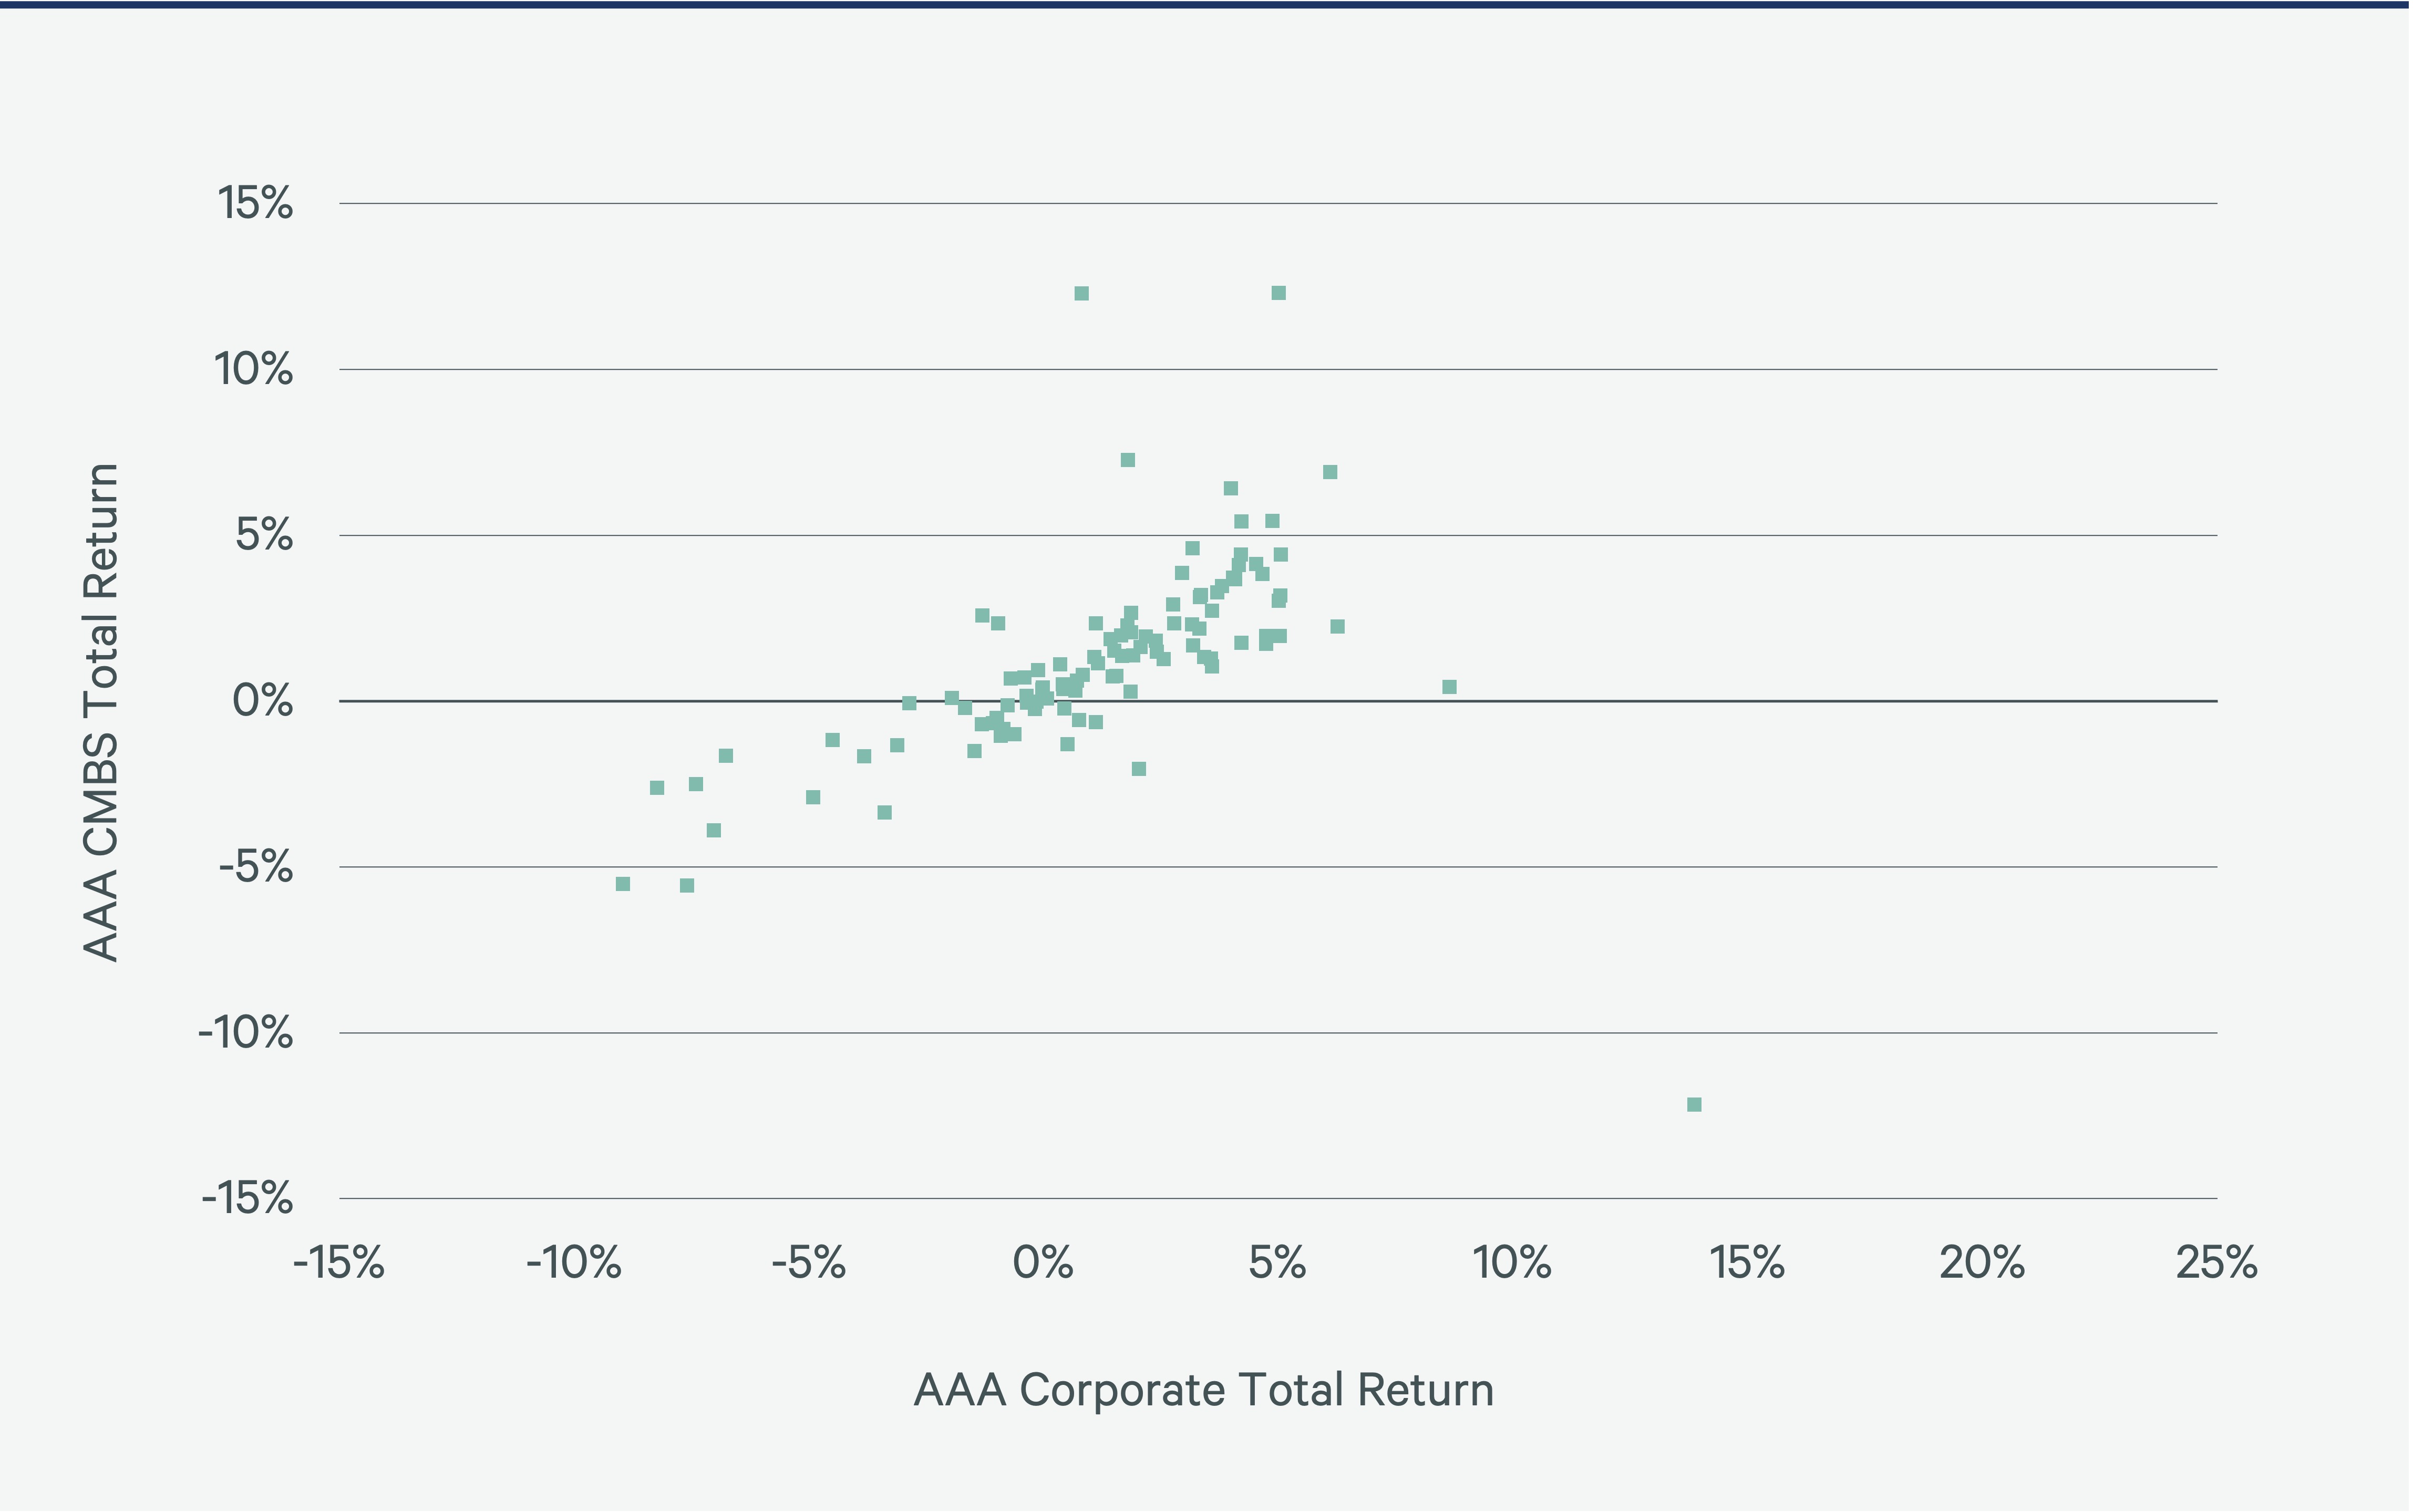
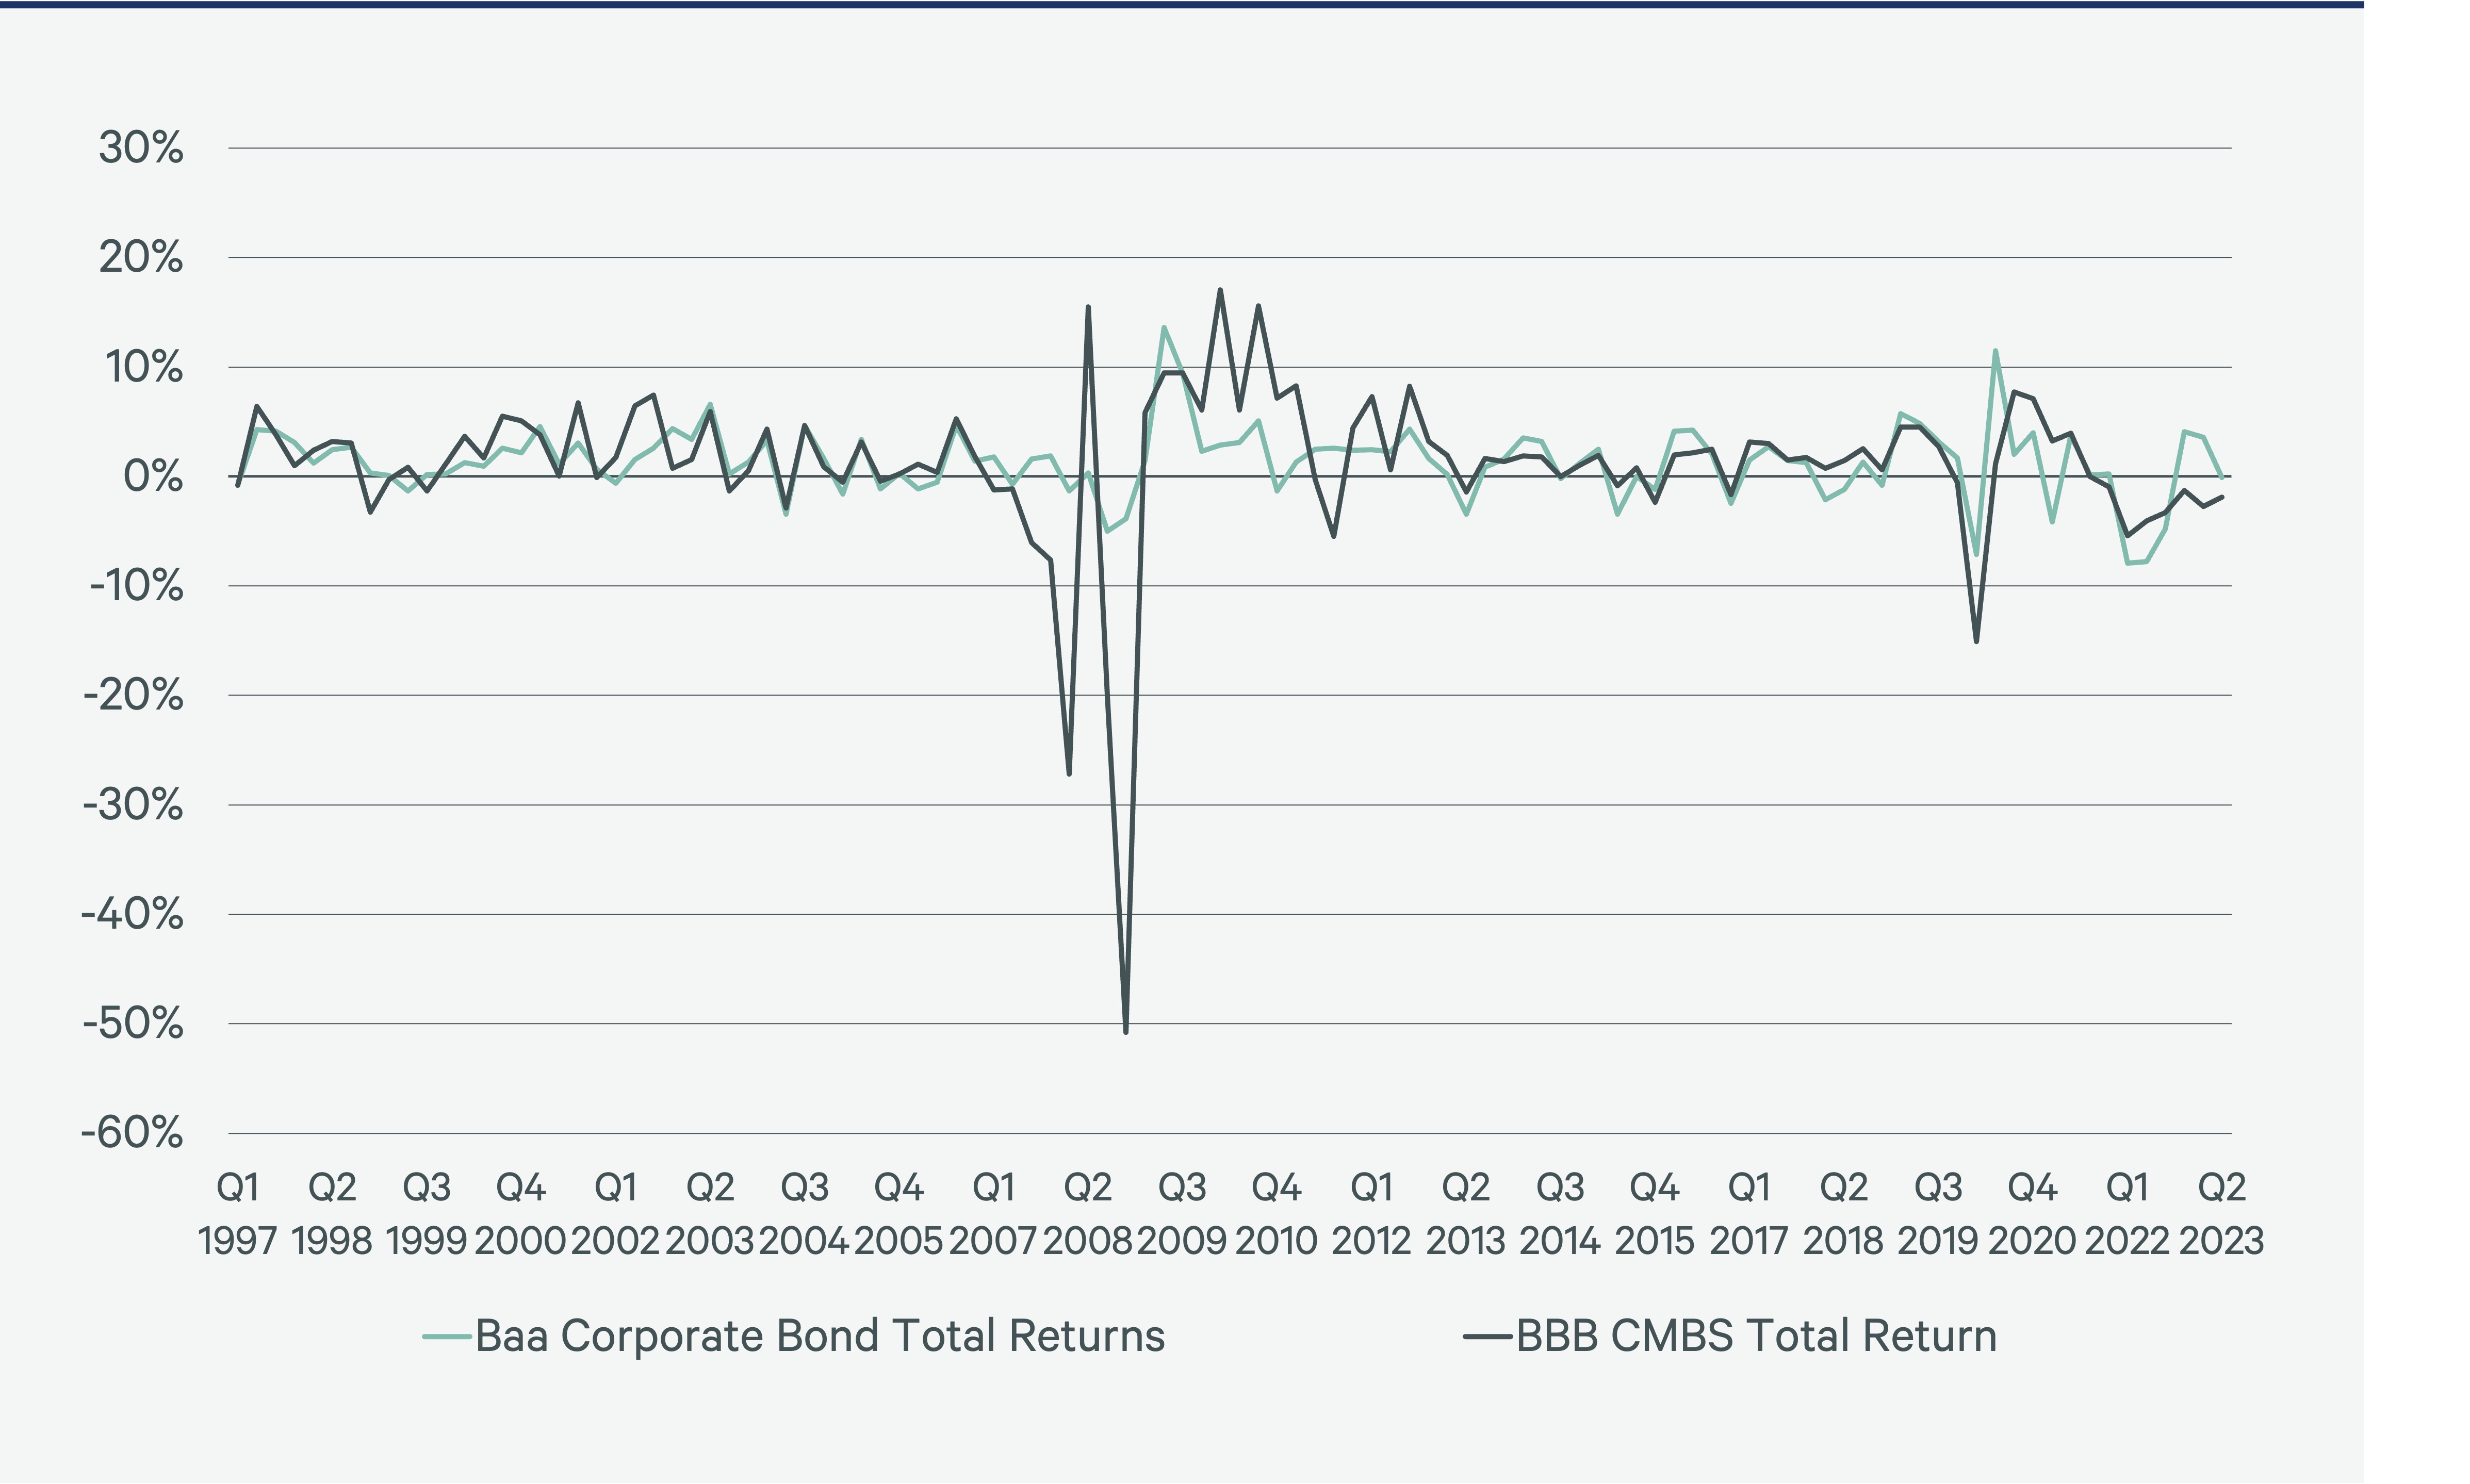
Figure 10: BBB-rated CMBS and Baa-rated Corporate Bond Total Returns (%)
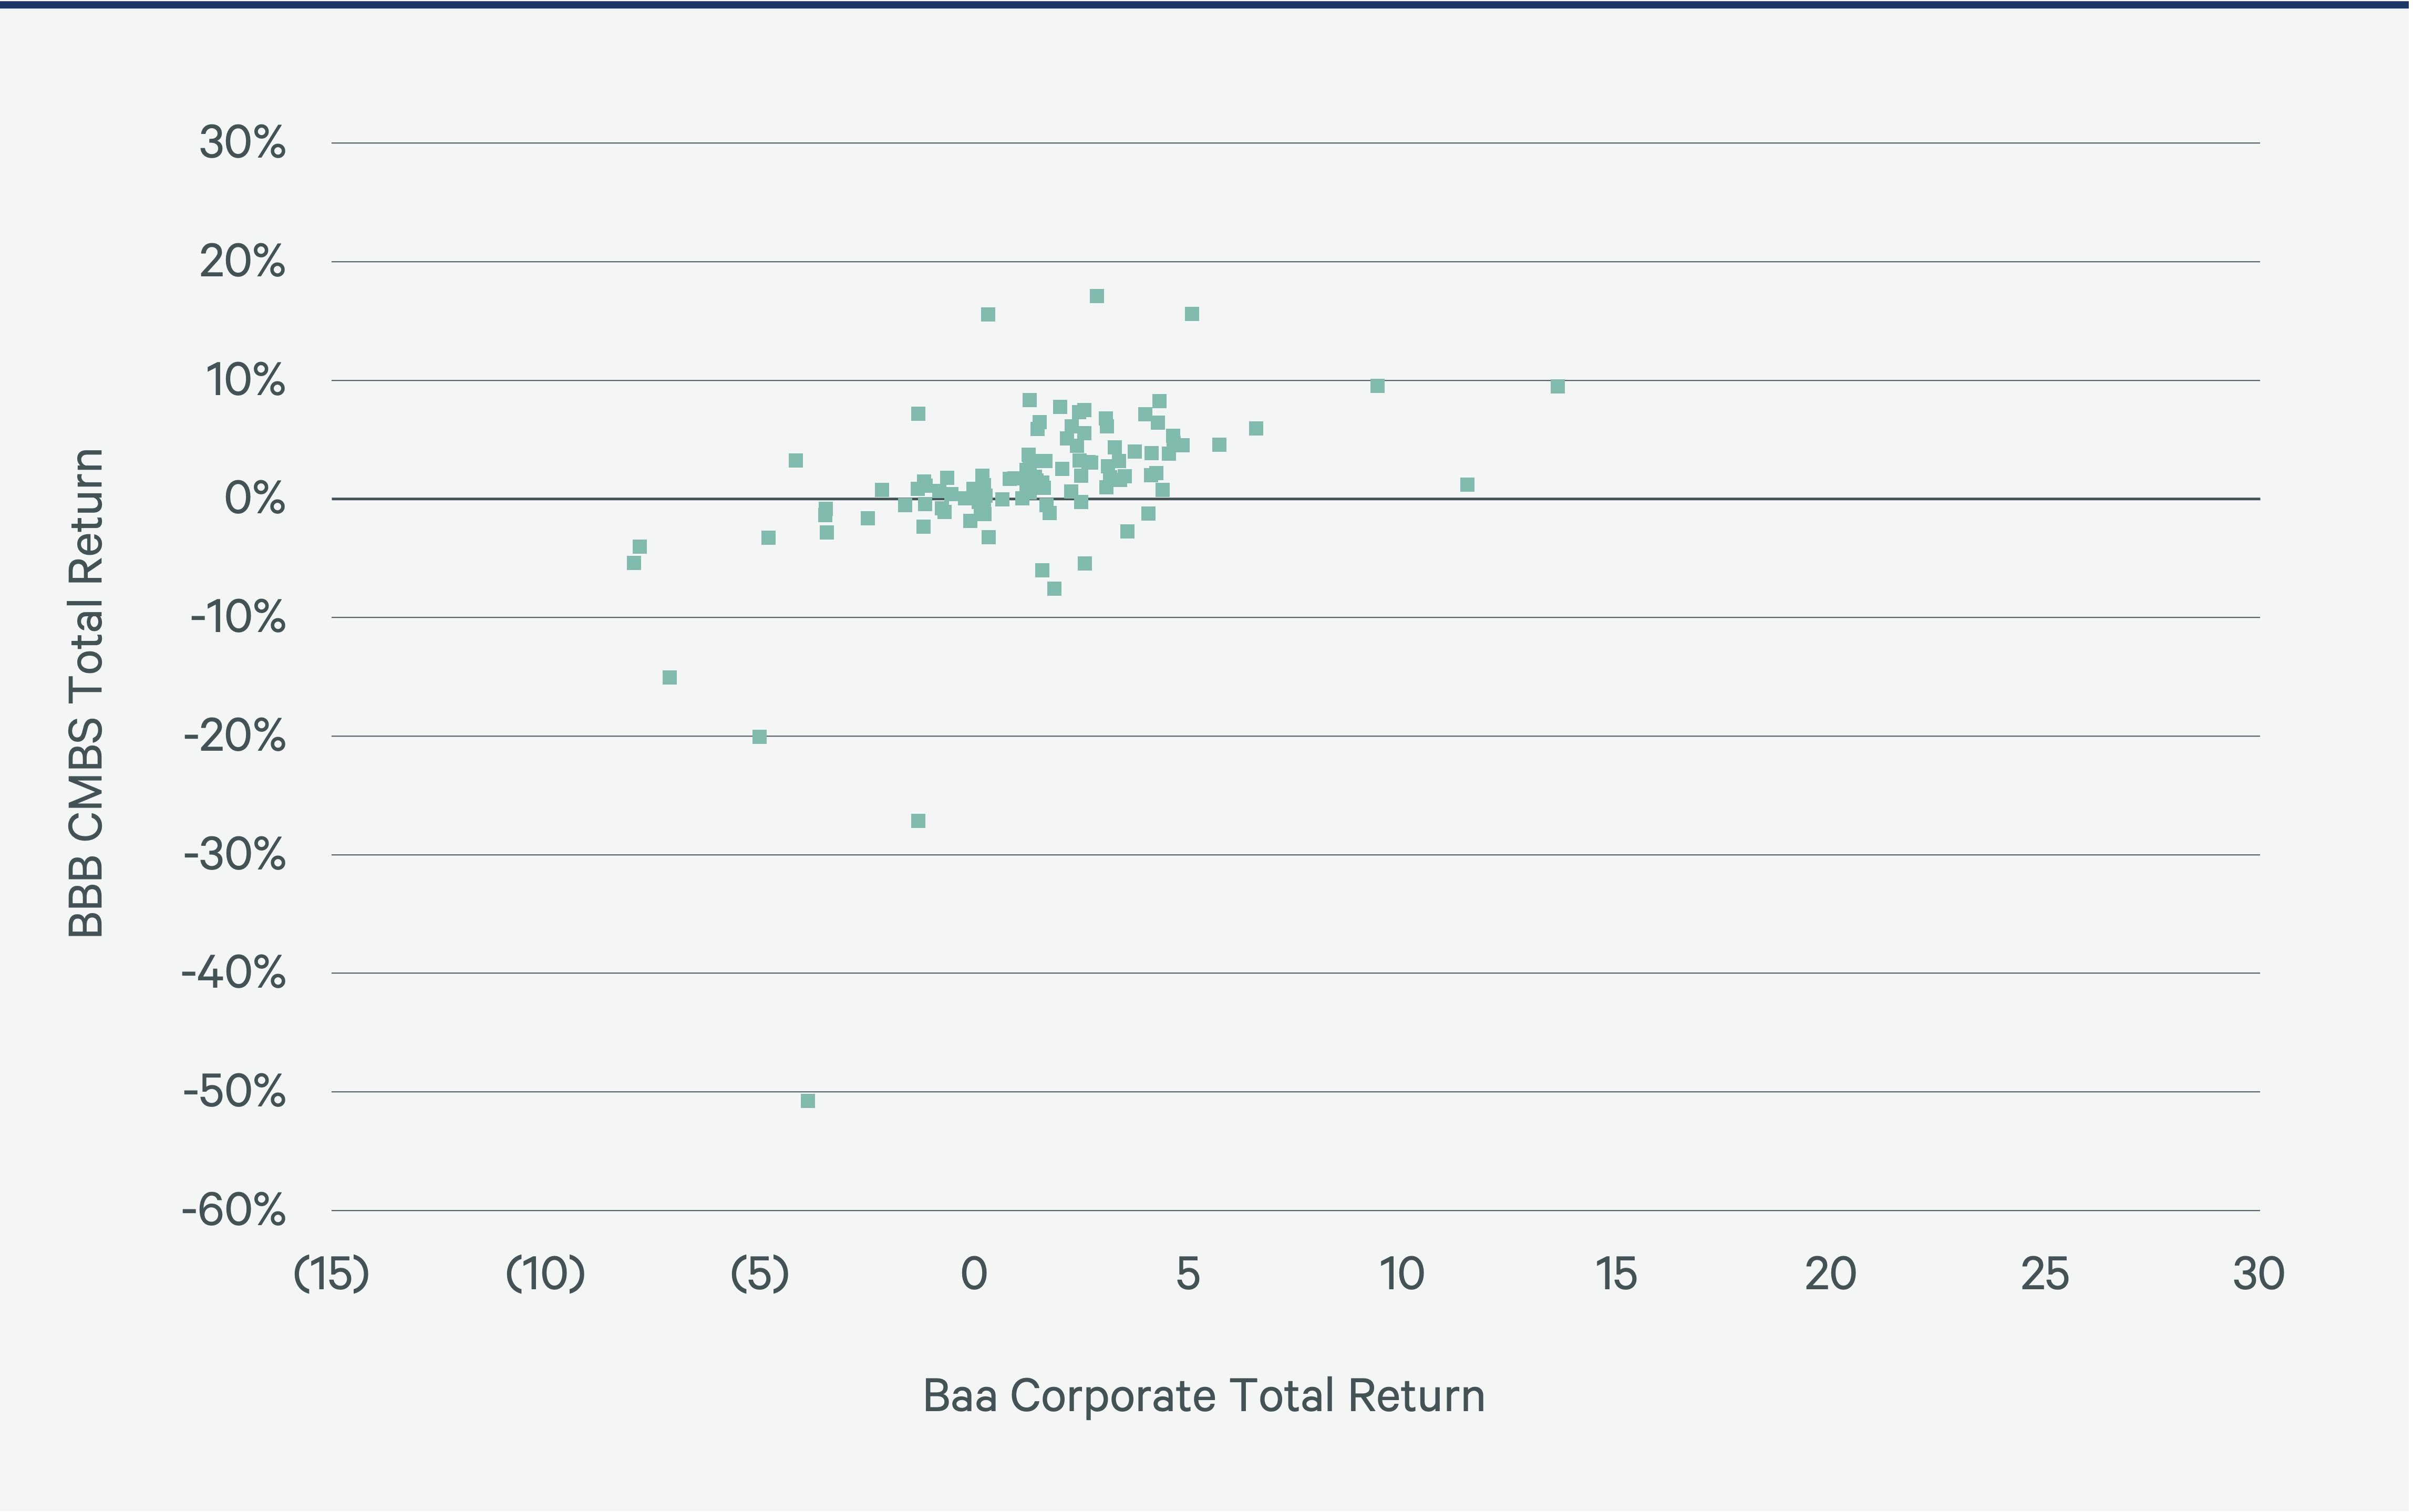
Models 1 and 2 compare the sensitivities of CMBS bond to corporate bond total returns. AAA-rated CMBS is relatively insensitive to changes in AAA corporate bond returns, which differs from the significantly greater sensitivity of BBB-rated CMBS to Baa-rated corporate bonds.
Model 1: Bivariate Effect of AAA Corporate Bond Returns on AAA-rated CMBS Returns (Q1 2004-Q2 2023)
Model 2: Bivariate Effect of Baa Corporate Bond Returns on BBB-rated CMBS Returns (Q1 2004-Q2 2023)
In unreported multiple regression models, we found that the four-quarter moving average of NOI growth, lagged two quarters, is not significant in explaining yields, AAA- or BBB-rated. However, high yield corporate bond yields are significant. The bivariate relationships between NOI growth and either AAA CMBS or BBB CMBS yield is insignificant. Since the BBB-rated CMBS tranche, (the subordinate tranche), is the riskiest, we would expect that the yield for the BBB tranche would be more sensitive to underlying real estate conditions. The yield of the senior or AAA-rated CMBS tranche is highly correlated with the AAA-corporate bond yield (Figure 11). By contrast, the relationship between the high yield corporate bond and the BBB-rated CMBS tranche is much more complicated (Figure 12).
Figure 11: AAA-rated Corporate Bonds and AAA-rated CMBS Yields (%)
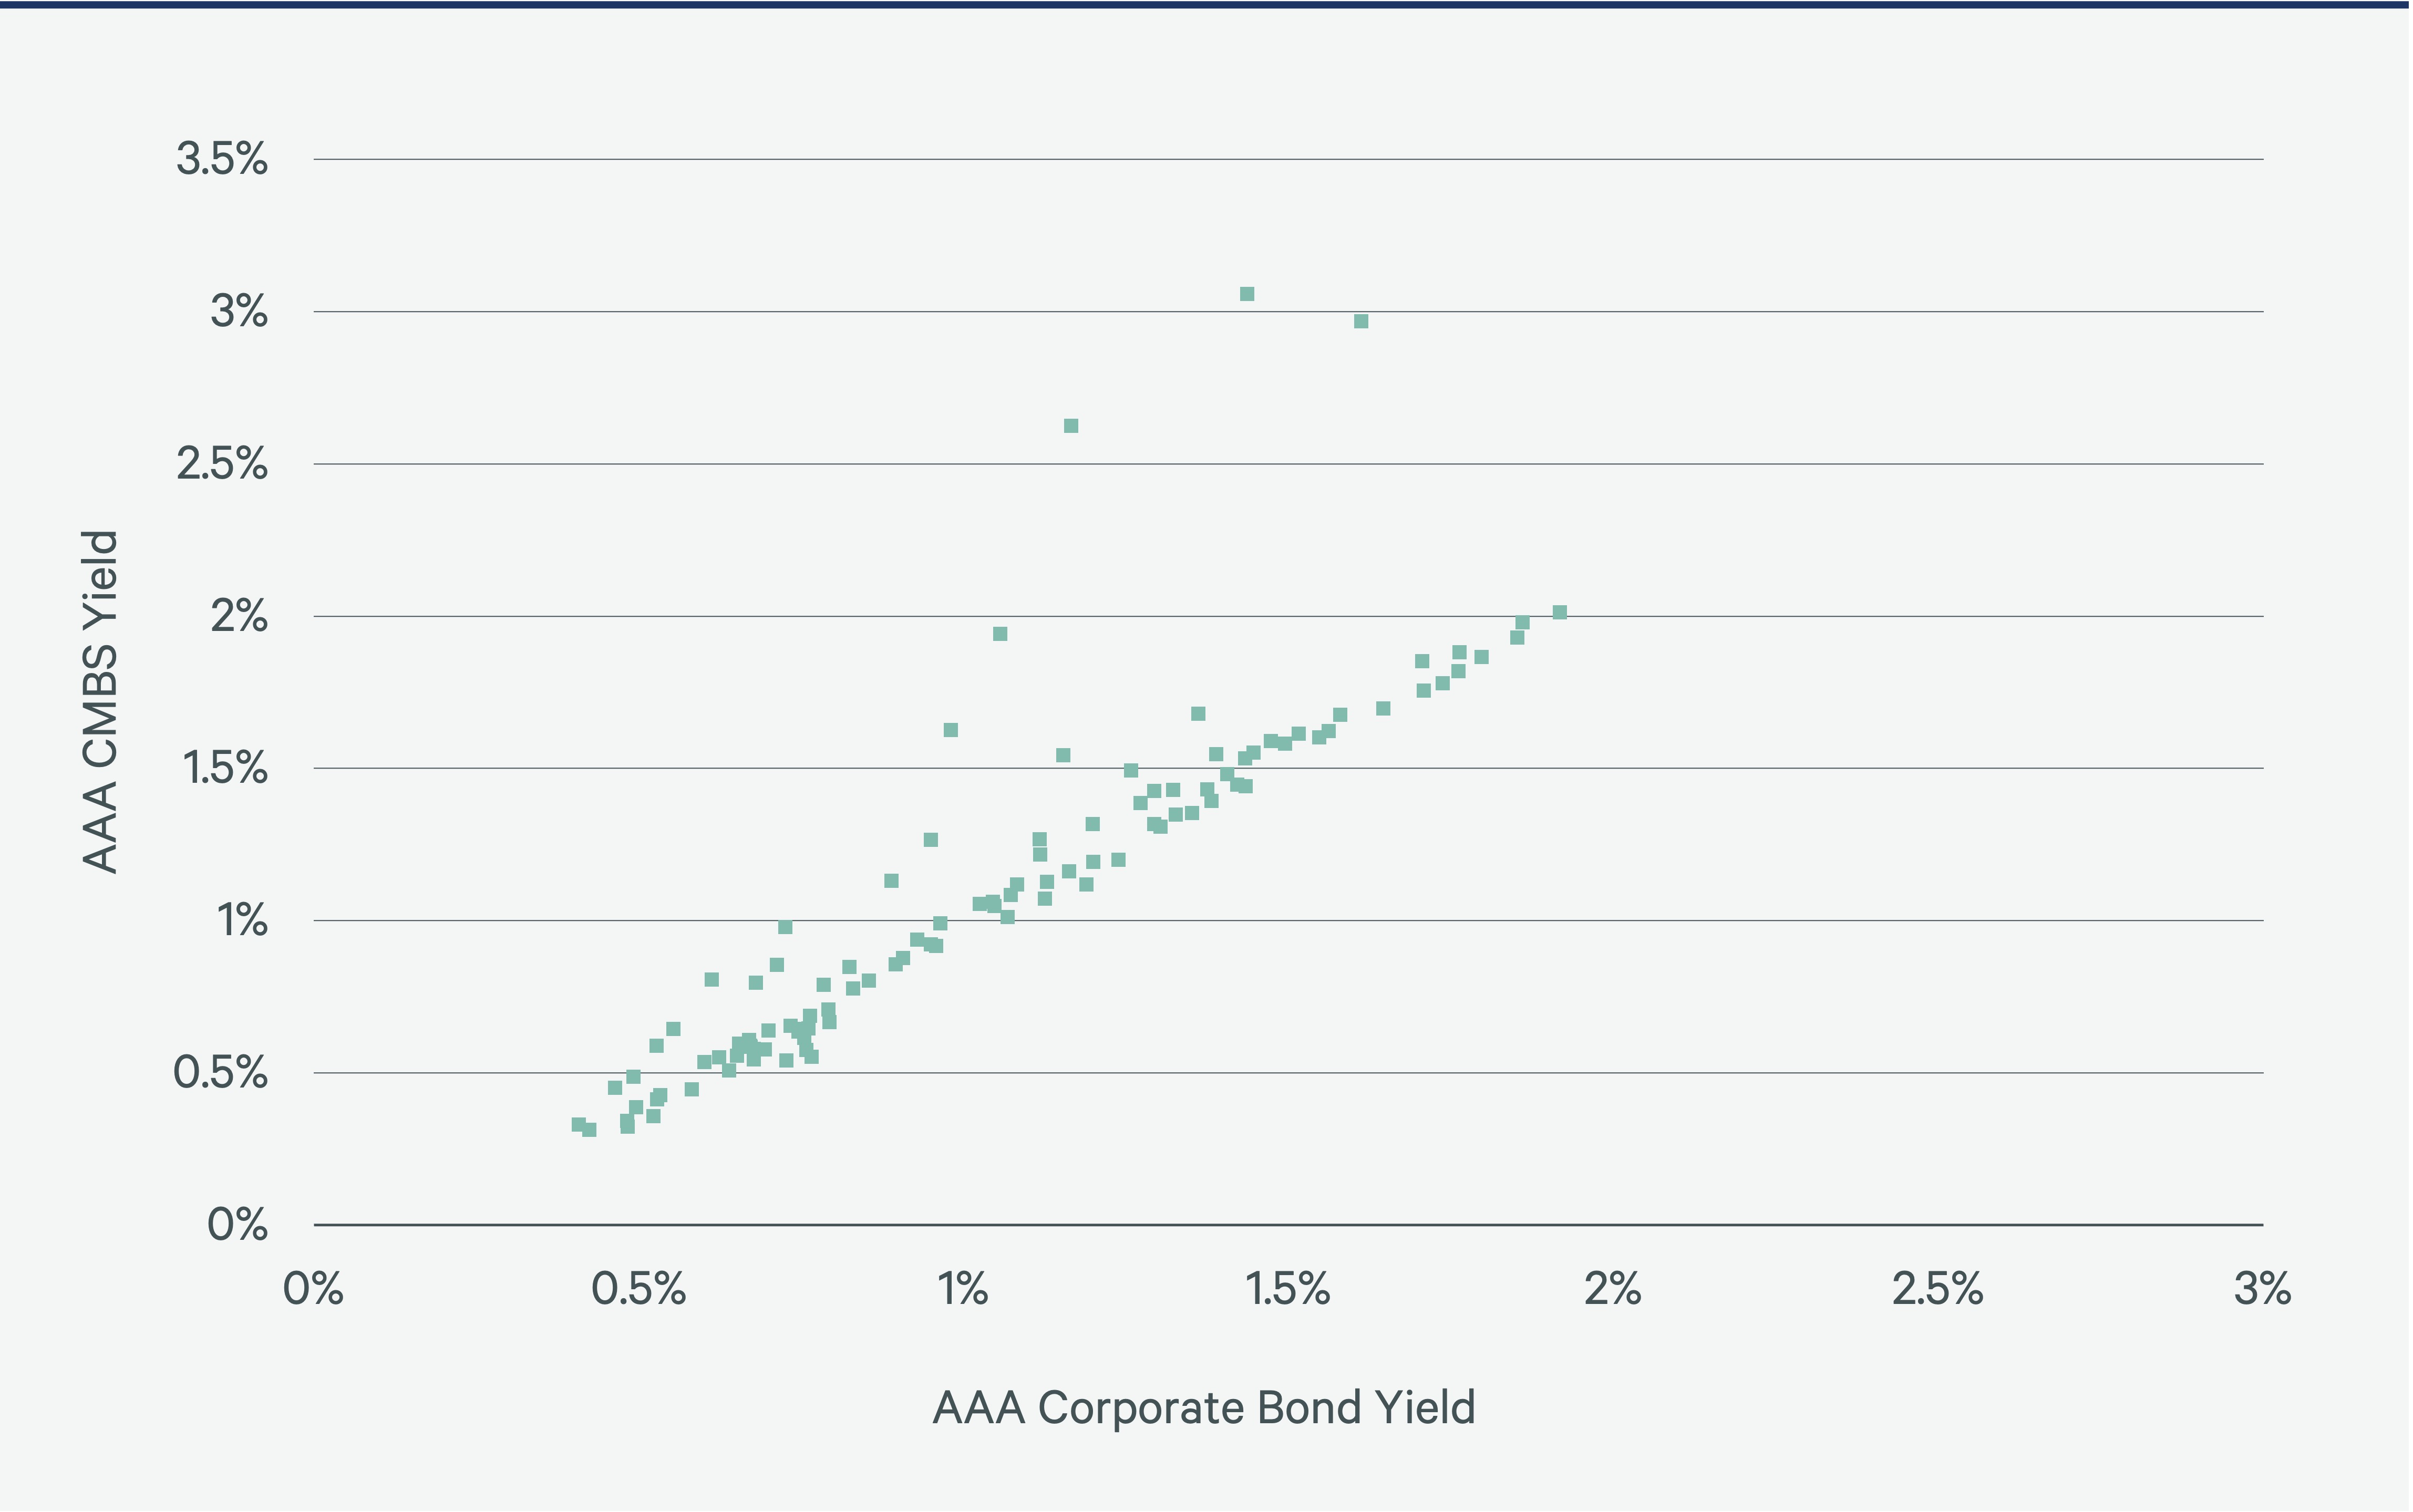
Figure 12: High-Yield Corporate Bonds and BBB-rated CMBS Yields (%)
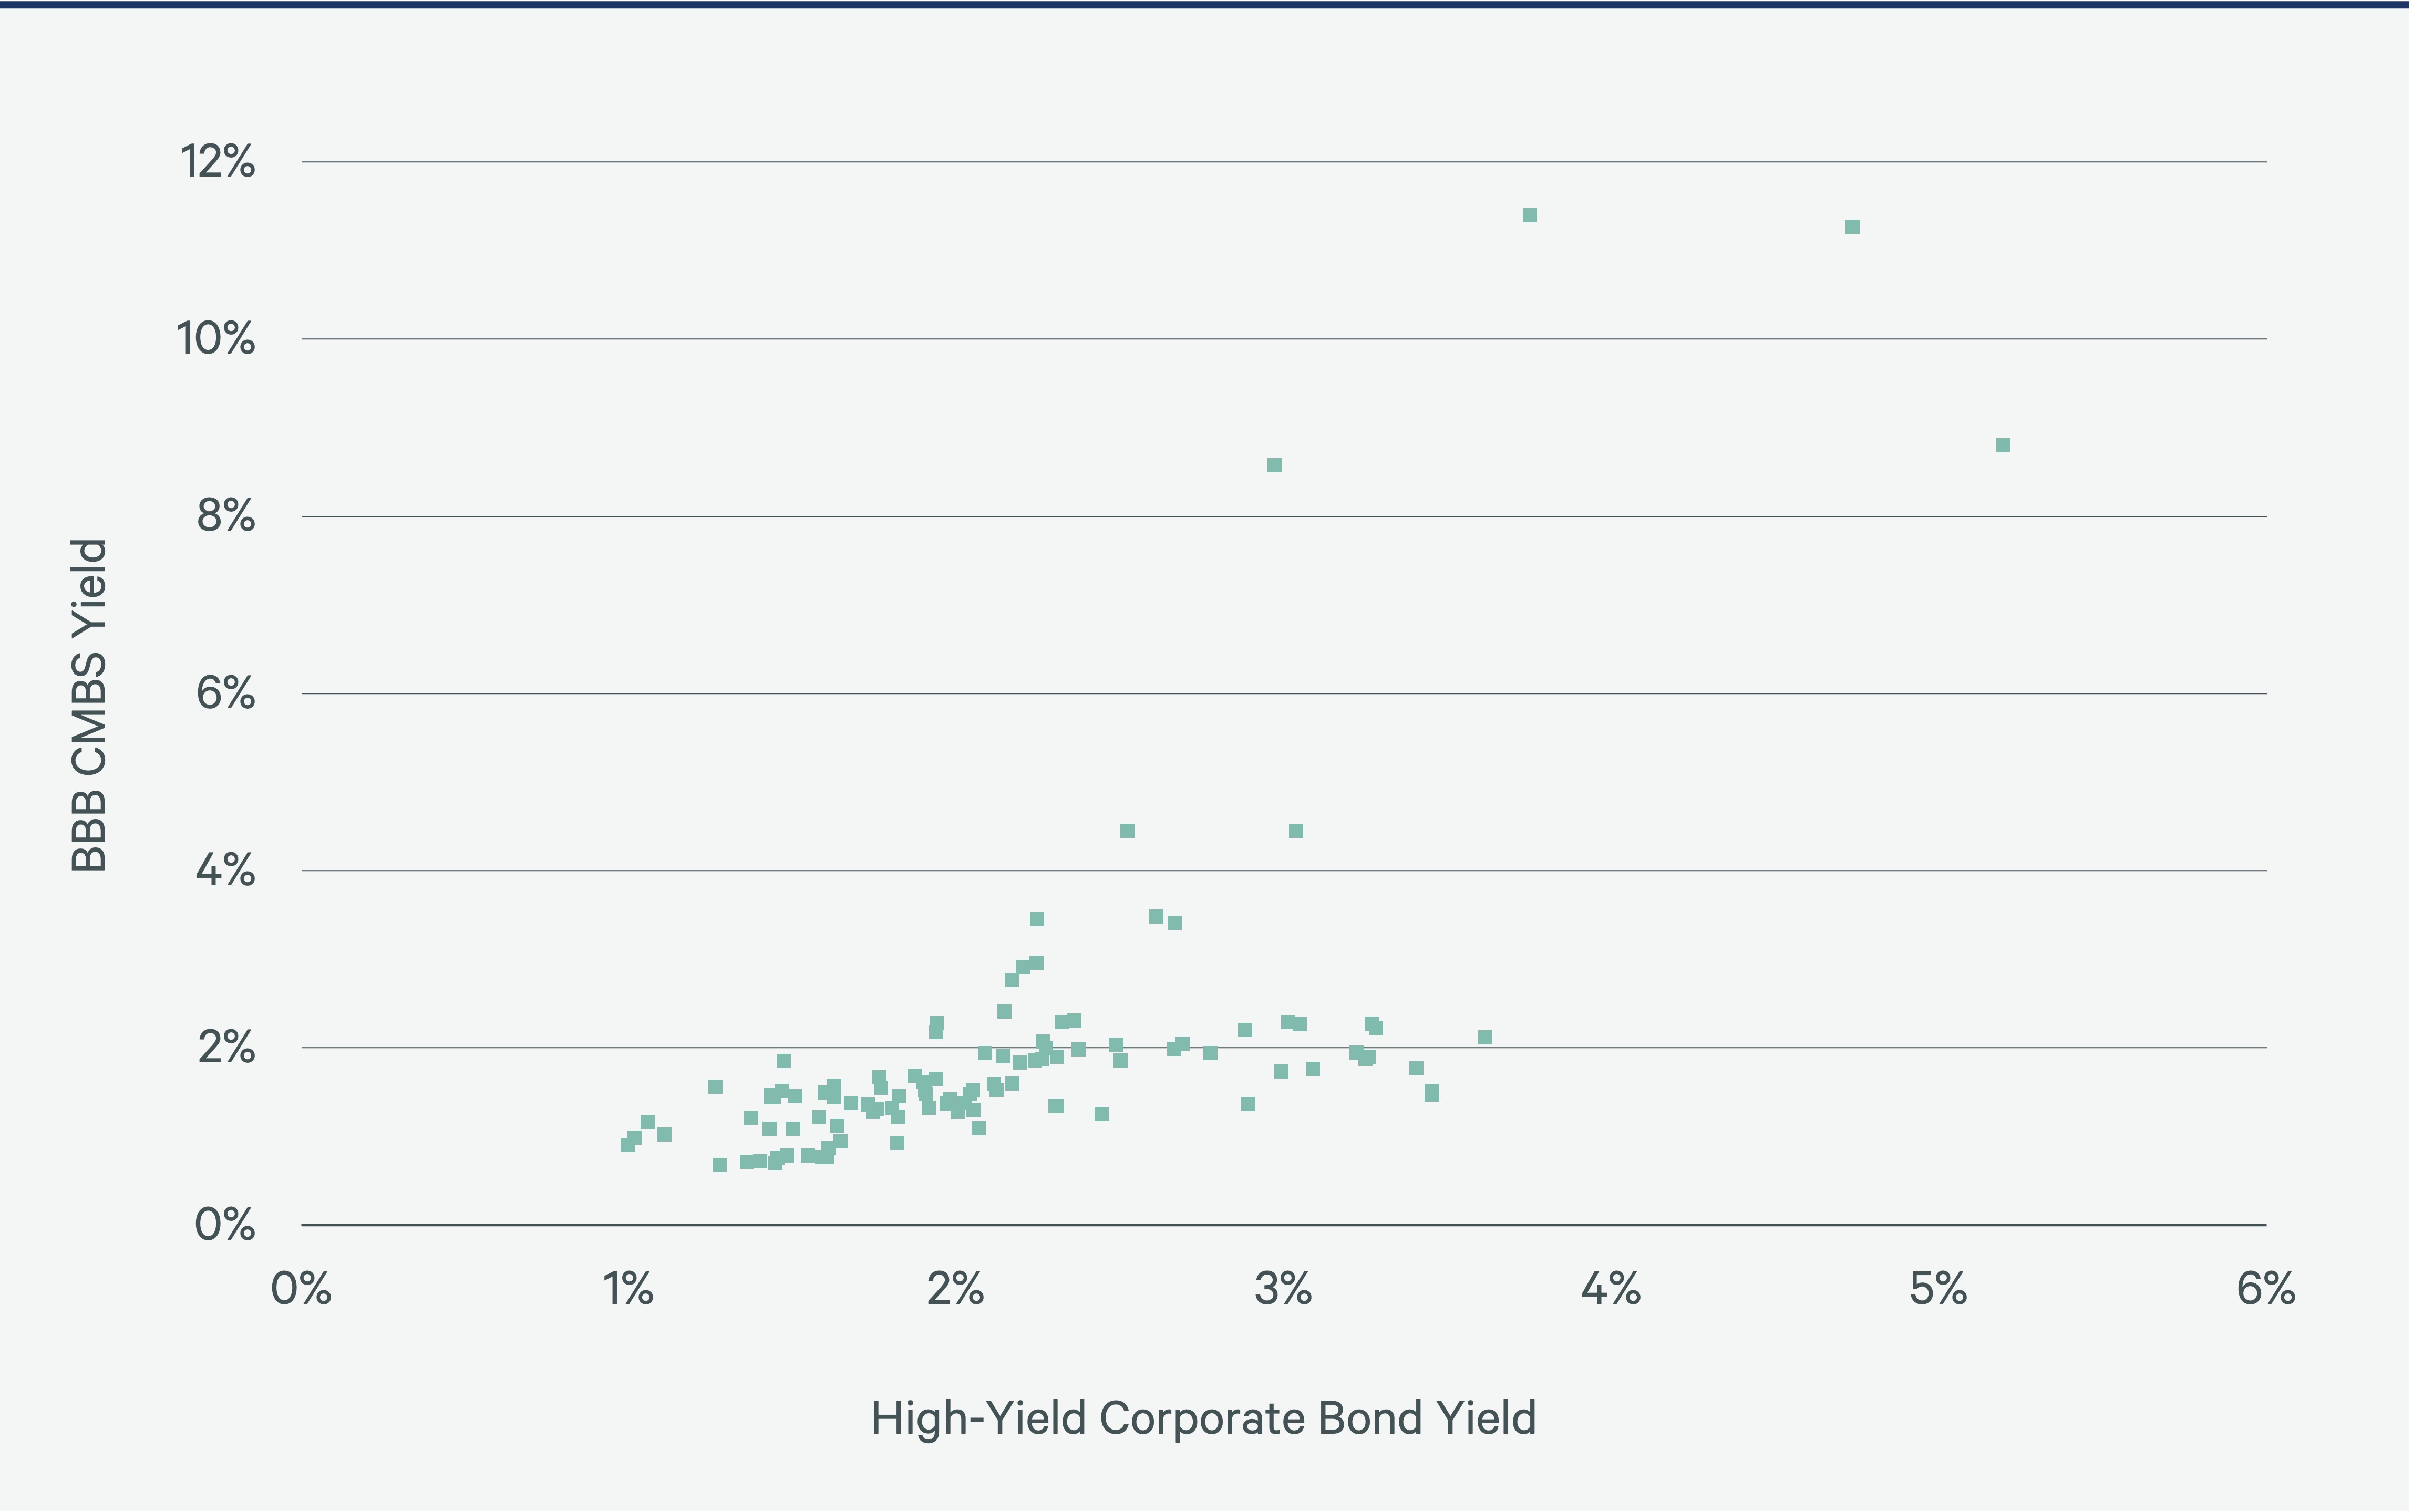
Real estate-specific risks are more important in pricing subordinate CMBS. As a result, BBB-rated CMBS yields and returns are very useful in modeling and forecasting property returns, as our leveraged NPI property return model will show later in this series. This finding underscores the powerful relationship between the corporate bond market and the yields of senior and subordinate CMBS tranches.
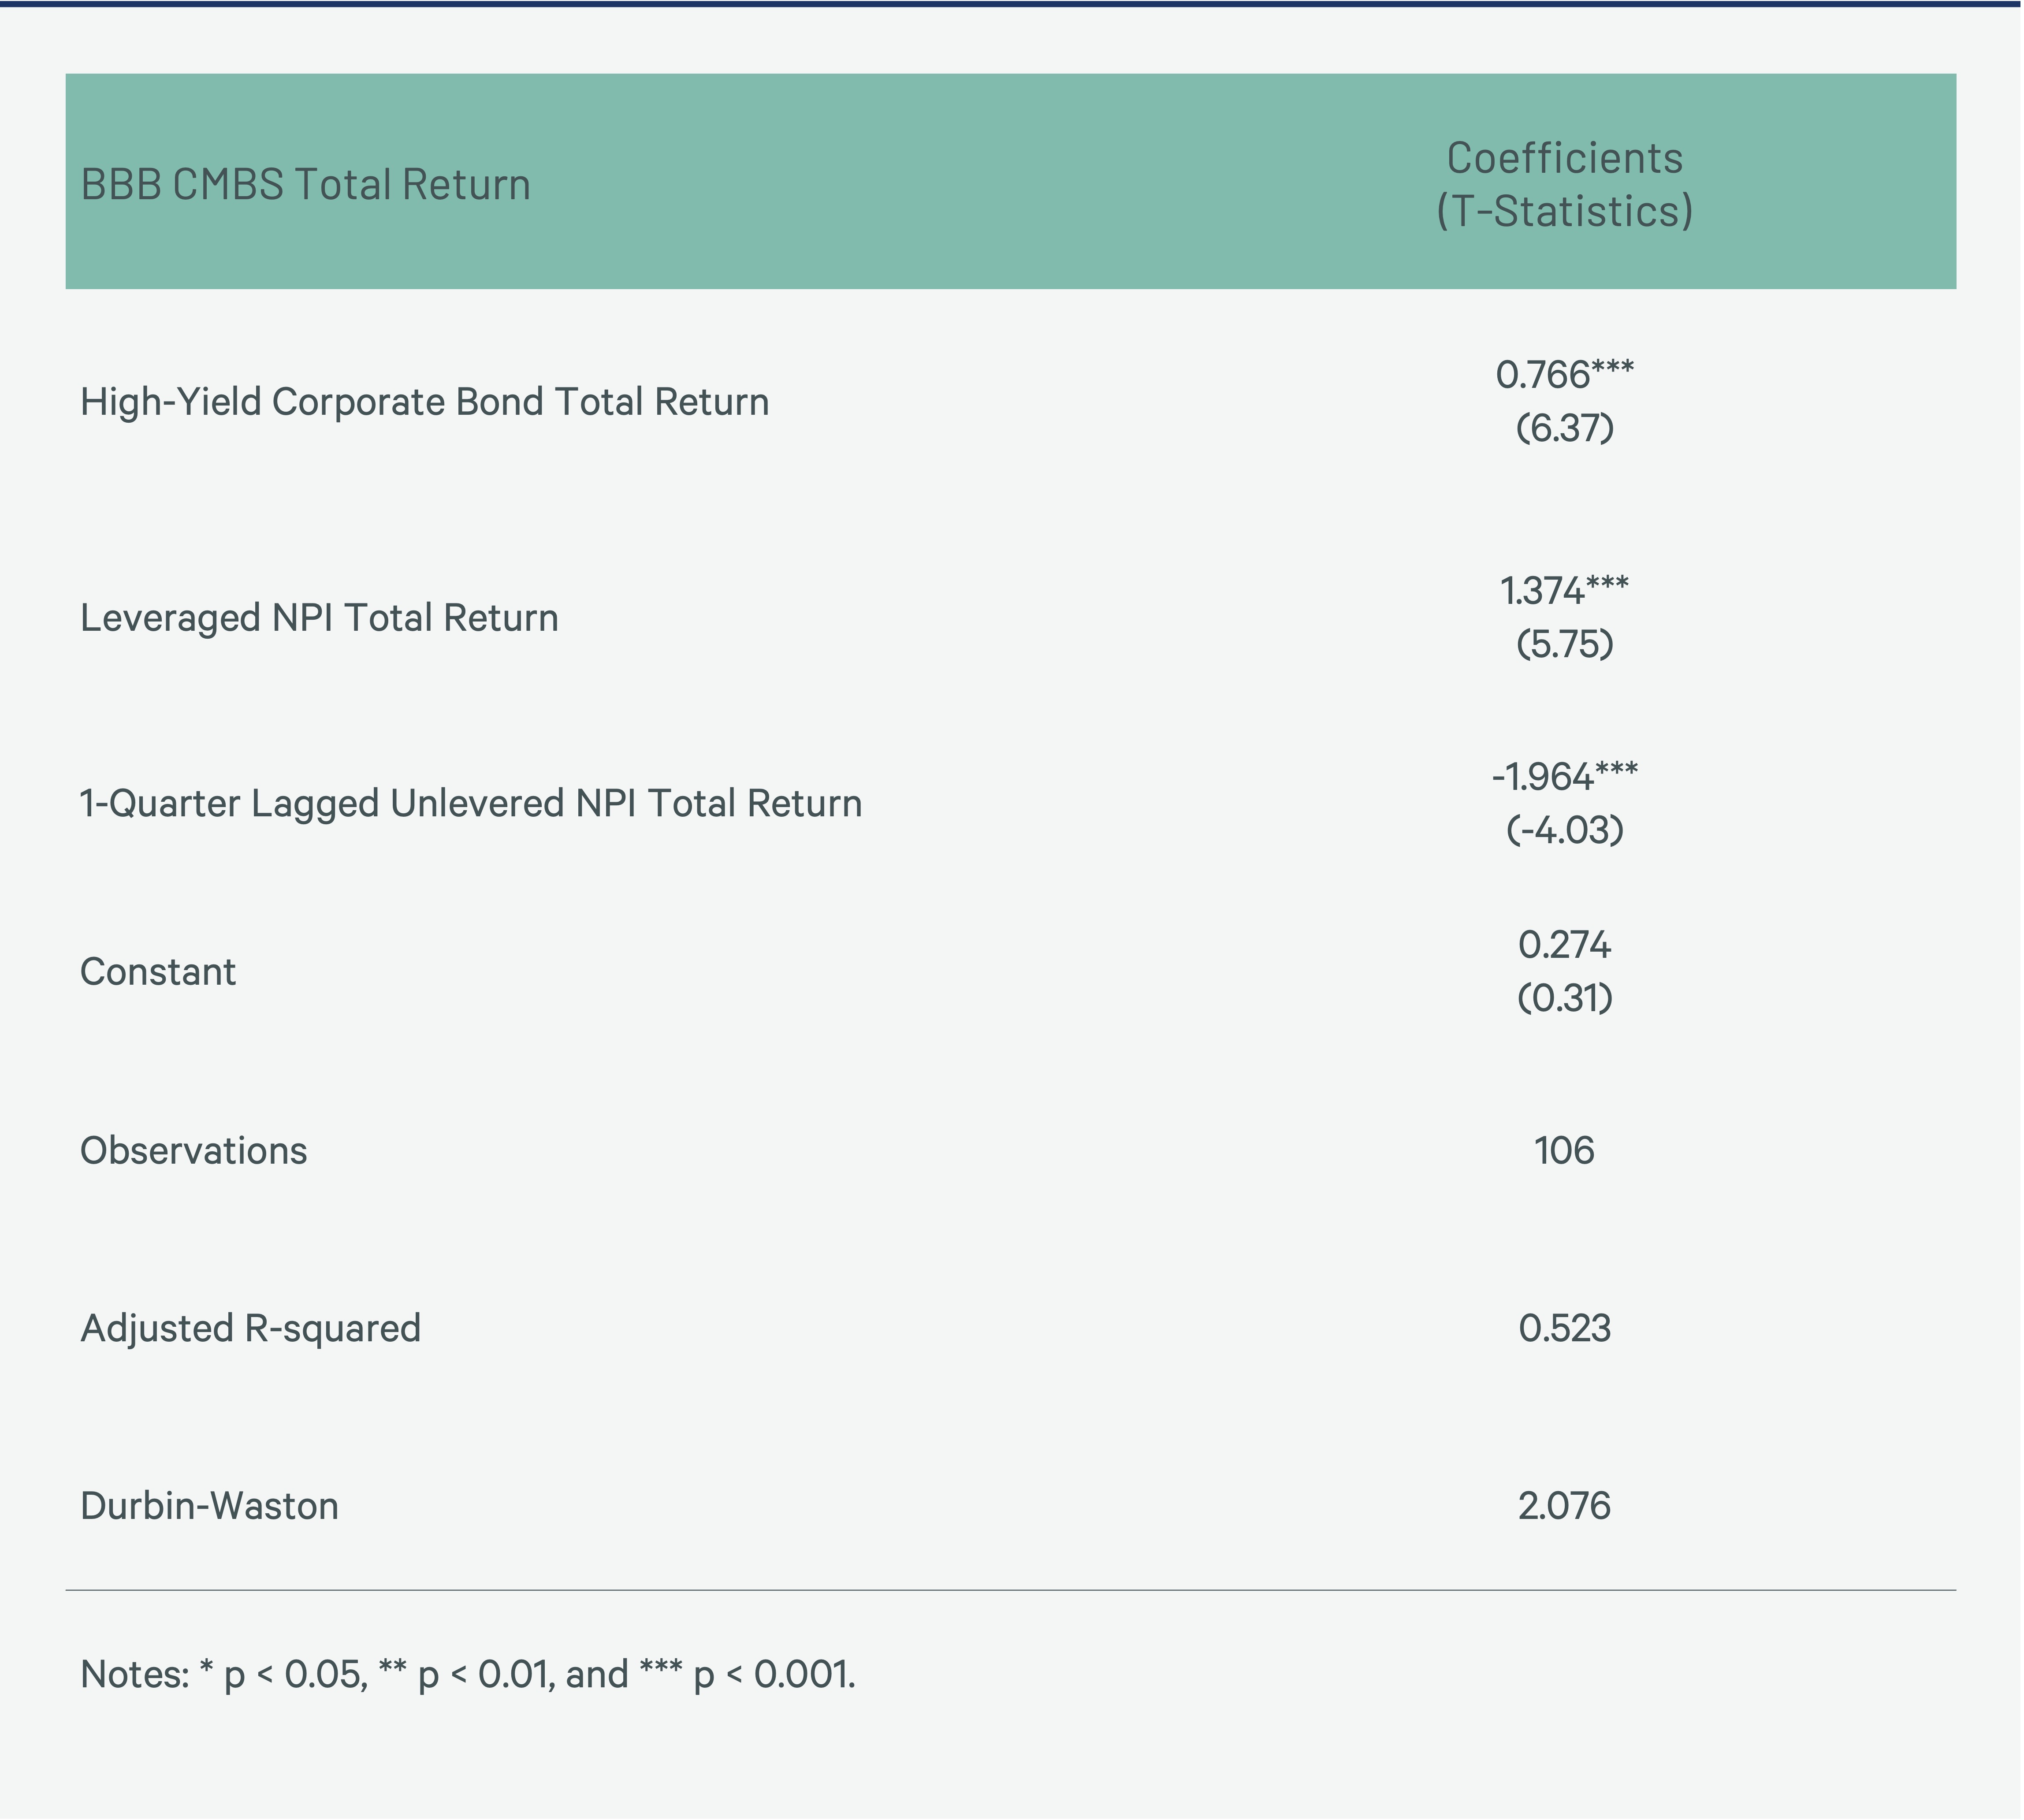
In Model 3, we show subordinate CMBS (BBB) total returns increase if the total returns on high yield bonds and levered property are higher. The greater is the lagged return for unlevered property; the lower is the total return of BBB-rated CMBS. We interpret the negative sign as indicating the presence of reversion to the mean or negative feedback. The model explains 52% of the variation in the dependent variable and the t-statistics are highly significant. The Durbin Watson statistic, a measure of serial correlation, indicates no serial correlation in the residuals of the estimate equation.
Model 3: BBB-rated CMBS Returns Explained
Conclusion
Our analysis provides several important insights:
- The relationship between AAA CMBS notes and AAA corporate bonds is stronger than the relationship between BBB CMBS notes and Baa corporate bonds.
- Subordinate CMBS returns are more strongly driven by real estate fundamentals than senior tranch returns.
- Subordinate CMBS returns are largely explained by high-yield corporate bond returns, leveraged NPI returns, and lagged unleveraged NPI returns.
In future installments of this series, we will explore the relationship between public debt and the other quadrants.
CBRE Econometric Advisors invited Dr. Randall Zisler to co-author this paper on the real estate quadrants. His unique approach reflects a multifaceted career as a Princeton University professor, Goldman Sachs research director, pension fund consultant, and investment banker.
Explore Other Viewpoints in This Series
-
Viewpoint | Intelligent Investment
A Quadrant Approach to Commercial Real Estate Investing: Private Equity
February 5, 2025

Property returns exhibit serial correlation, making them partially predictable based on past returns. This needs to be considered when comparing private and public property returns.
-
Viewpoint | Intelligent Investment
A Quadrant Approach to Commercial Real Estate Investing: Public Equity
November 5, 2024

This Viewpoint is the fourth in a series that examines the relationship between the CRE quadrants of public debt, private debt, private equity and public equity.
-
Viewpoint | Intelligent Investment
A Quadrant Approach to Commercial Real Estate Investing: Private Debt
August 7, 2024

Senior mortgage returns are far more correlated across property types than property investments.
-
Viewpoint | Intelligent Investment
A Quadrant Approach to Commercial Real Estate Investing
June 17, 2024

The four primary ways investors can gain exposure to commercial real estate are private equity, public equity, private debt and public debt.
Related Services
CBRE’s trusted specialists in economics, data science, and forecasting at Econometric Advisors deliver the most sought-after analytical real estate re...
- Invest, Finance & Value
Capital Markets
Gain proactive insights and strategies that unlock value, drive returns and enhance outcomes for your real estat...
Related Insights
-

CBRE EA estimates cap rates at the sector level using four different methods and compares these with our CBRE EA cap rates.
-

Welcome to CBRE’s H2 2023 Cap Rate Survey (CRS). This survey comes at a unique time for real estate capital markets as limited investment volume has caused pricing uncertainty.
-

In June, CBRE Econometric Advisors published debt-funding gap estimates by sector for loans originated in the 2018-2020 period.
Contacts
Dennis Schoenmaker, Ph.D.
Executive Director & Principal Economist, CBRE Econometric Advisors