Intelligent Investment
U.S. Cap Rate Survey H2 2023
Tighter Lending Standards and Distress Expected but Yields Could Be Nearing Their Peak
March 5, 2024 4 Minute Read

Looking for a PDF of this content?
Introduction
The H2 2023 Cap Rate Survey provides a fresh perspective of where market sentiment is trending.
Welcome to CBRE’s H2 2023 Cap Rate Survey (CRS).
To read the full report, please download the PDF.
This survey comes at a unique time for real estate capital markets as limited investment volume has caused pricing uncertainty. The data driving this report was gathered from mid-November through December 2023 and informed by deals that occurred throughout the second half of 2023. We acknowledge that market conditions are fluid but believe that the CRS provides a useful base and unlocks important truths about how investor sentiment is changing.
The CRS captures 3,600 cap rate estimates across more than 50 geographic markets to generate key insights from a wealth of data.
More than 250 CBRE real estate professionals completed the H2 2023 CRS with their real-time market estimates in late 2023. Given the current rapidly changing investment landscape, estimates may not reflect recent events or the most current market conditions. Readers should view all cap rate estimates within this context.
Cap Rates Trended Upward in H2 2023 as Bond Yields Stalled
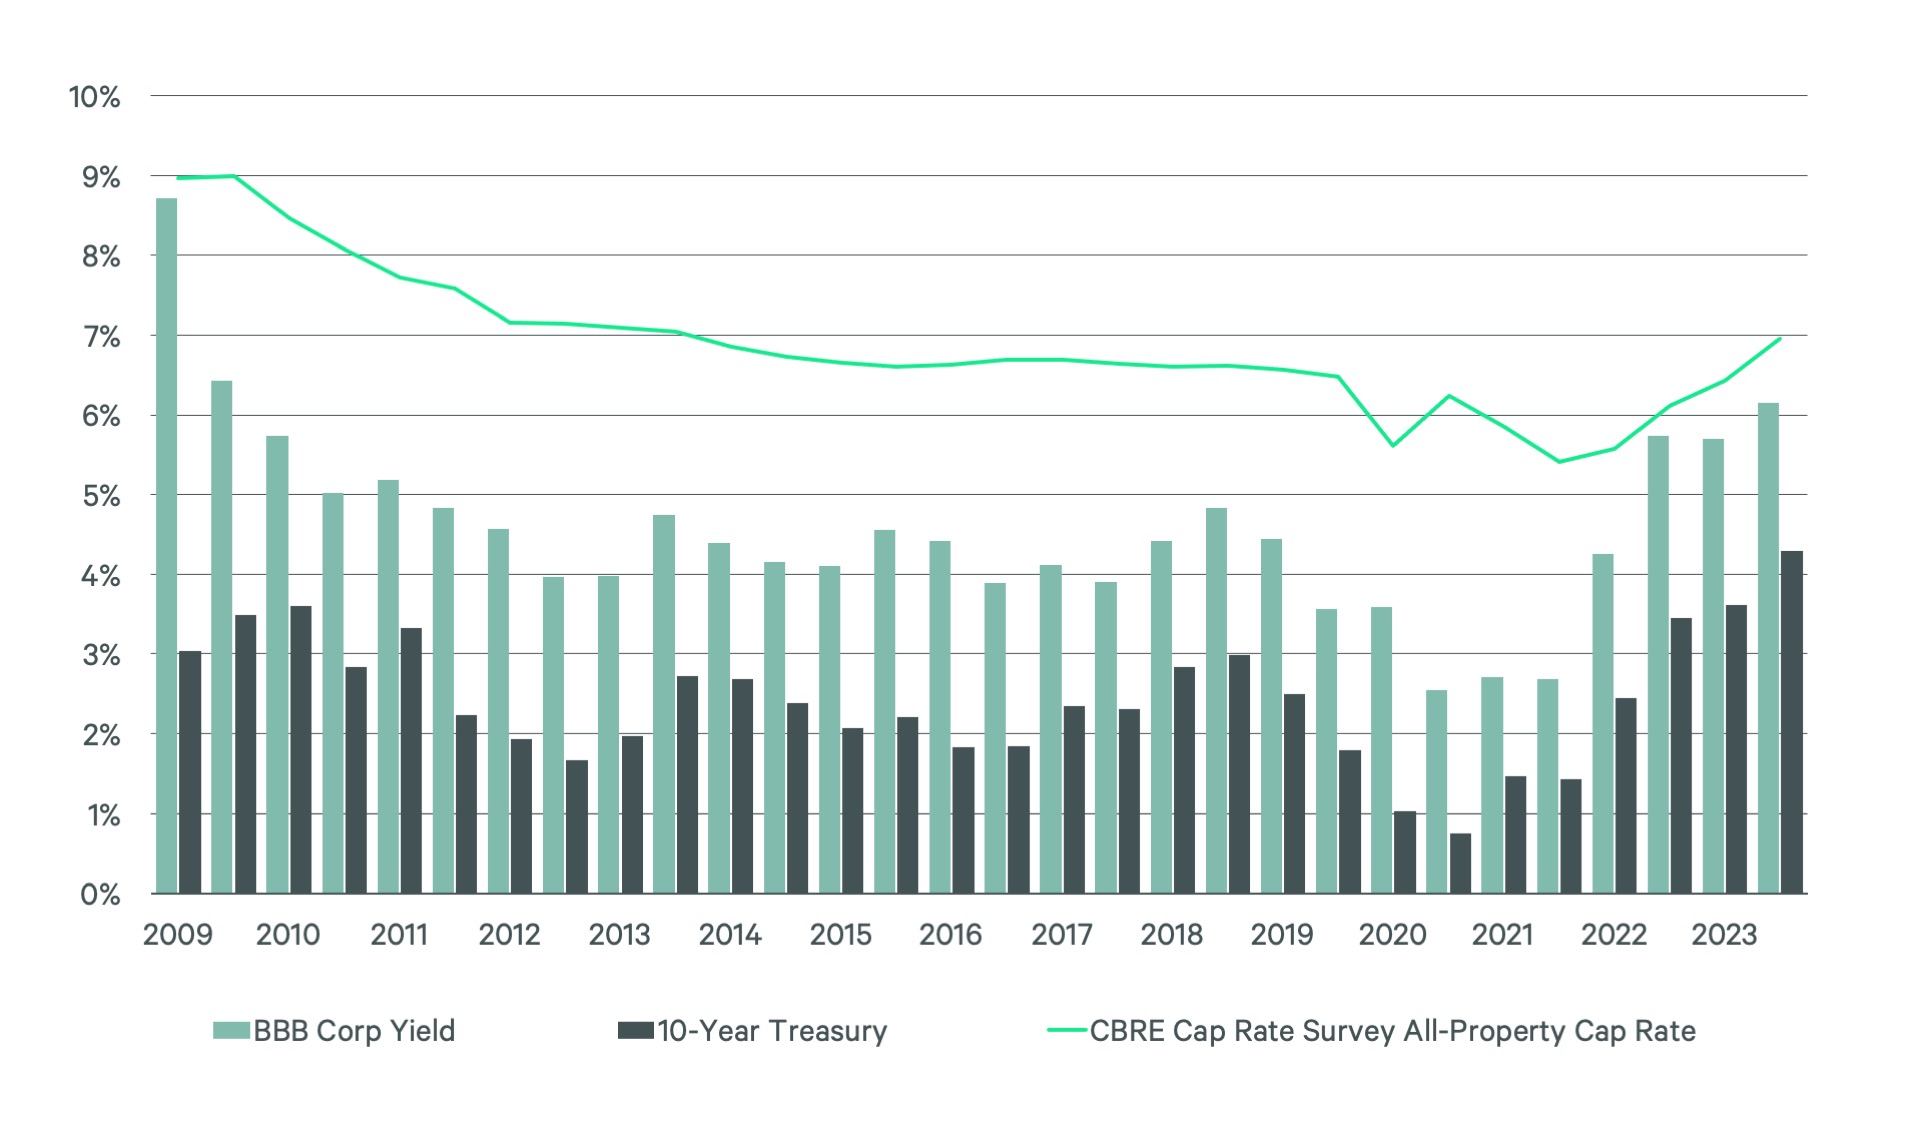
- H2 2023 was a volatile period for bond markets with yields peaking at 5% in October 2023 before falling back below 4% by year-end.
- This rise in bond yields was a headwind to deal flow and caused cap rate expansion to accelerate relative to H1 2023. The average cap rate increased from 6.4% to 7% in H2 2023, with expansion across multiple property types.
- In the final weeks of H2 2023 signals from the broader capital markets and the CRS suggest higher yields may not last. CBRE Econometric Advisors expects that yields are near a peak level, although offices may face further upward pressure.
Figure 1: Real Estate Cap Rate and Bond Yields, Period Average (%)
Cap Rate Expansion Continued, Especially for Commodity Office Stock
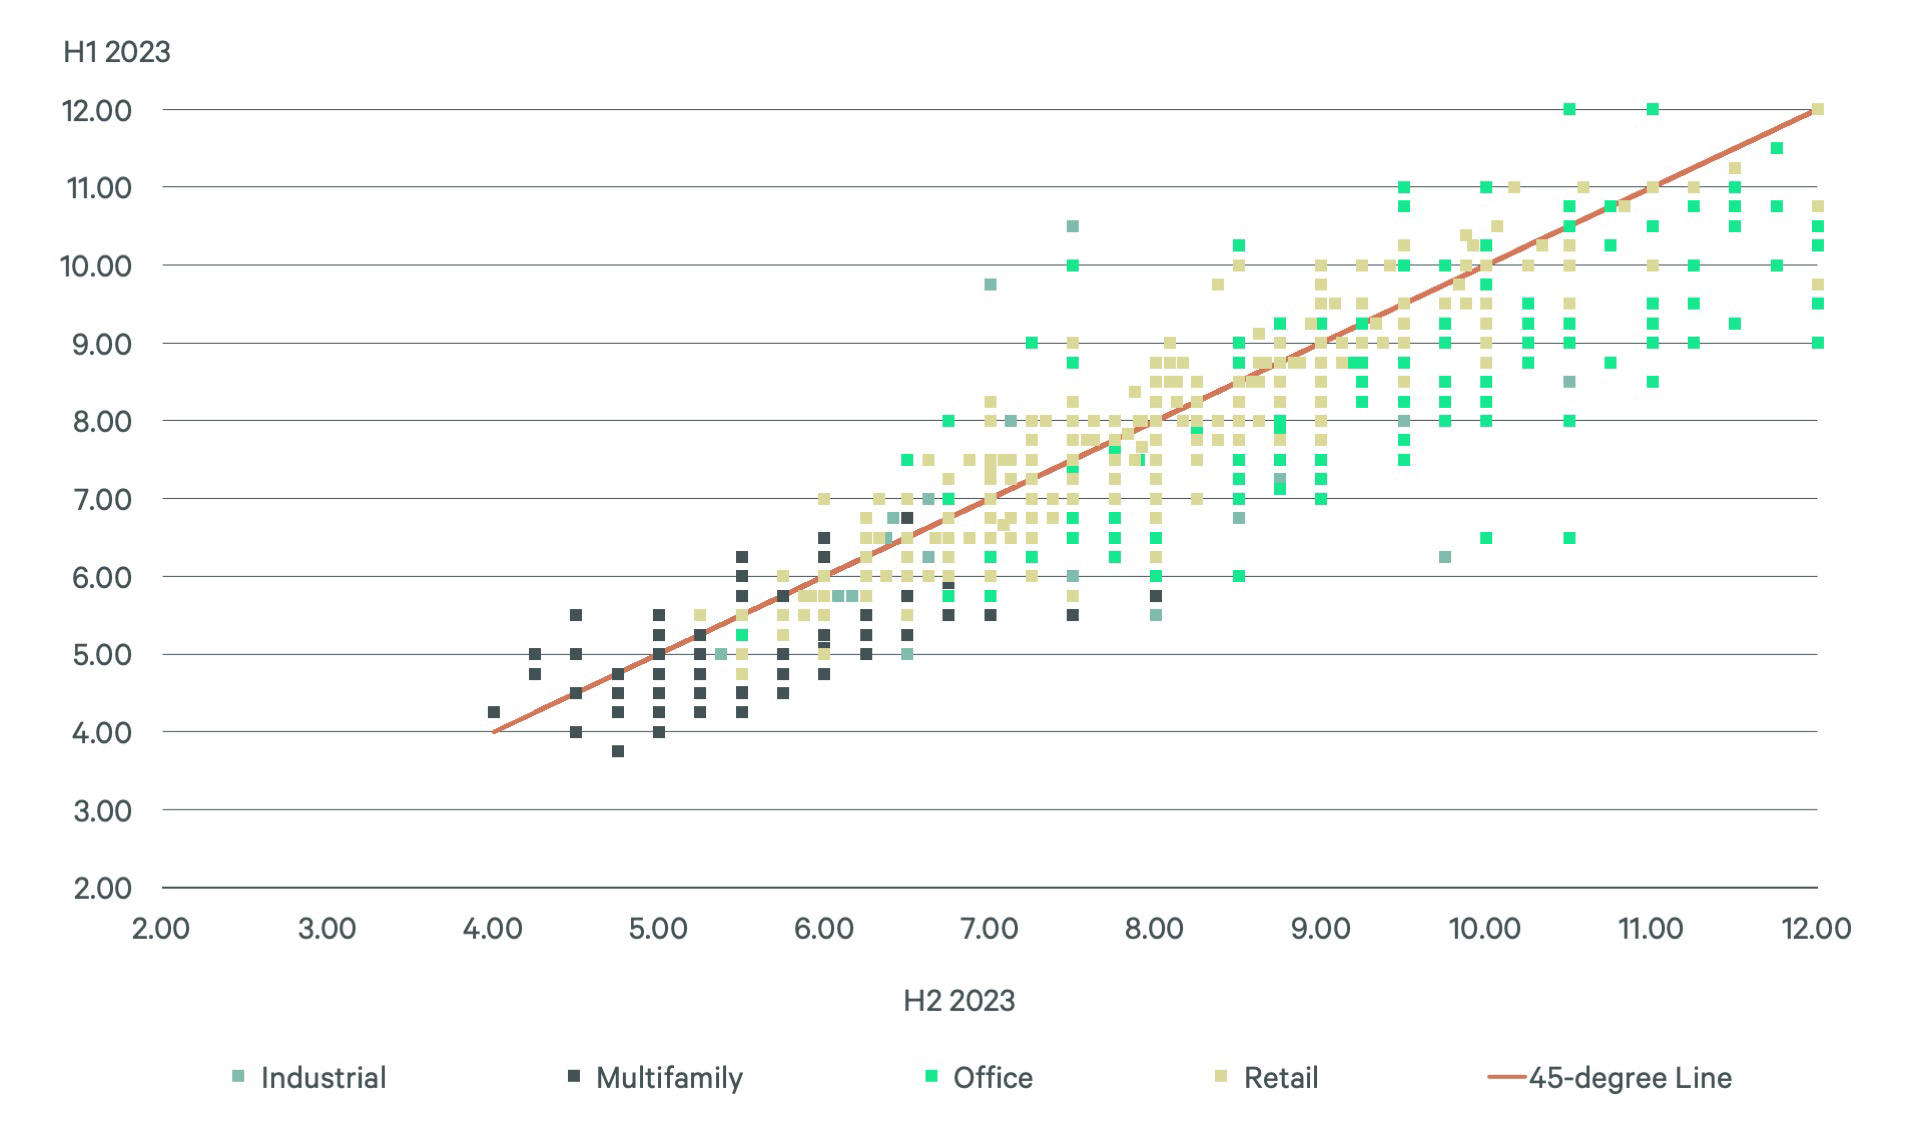
- Figure 2 compares stabilized cap rate estimates from the current CRS (horizontal axis) against H1 2023 estimates (vertical axis) for every property type and geographic market. Dots to the right of the 45-degree line represent markets where cap rates are higher than previous estimates.
- Cap rates expanded the most for commodity office assets, including a 100+ basis point (bp) increase for Class C urban properties. Suburban yield expansion was generally limited to less than 50 bps.
- Cap rate expansion was not limited to offices. The pace of decompression accelerated within the multifamily sector, with cap rates up +50 bps as some key cities are seeing weakening fundamentals.
- Neighborhood retail pricing remains the most stable.
Figure 2: H1 2023 Stabilized Cap Rate Estimates Versus H2 2023 Estimates
Most Respondents Believe That Cap Rates Have Peaked
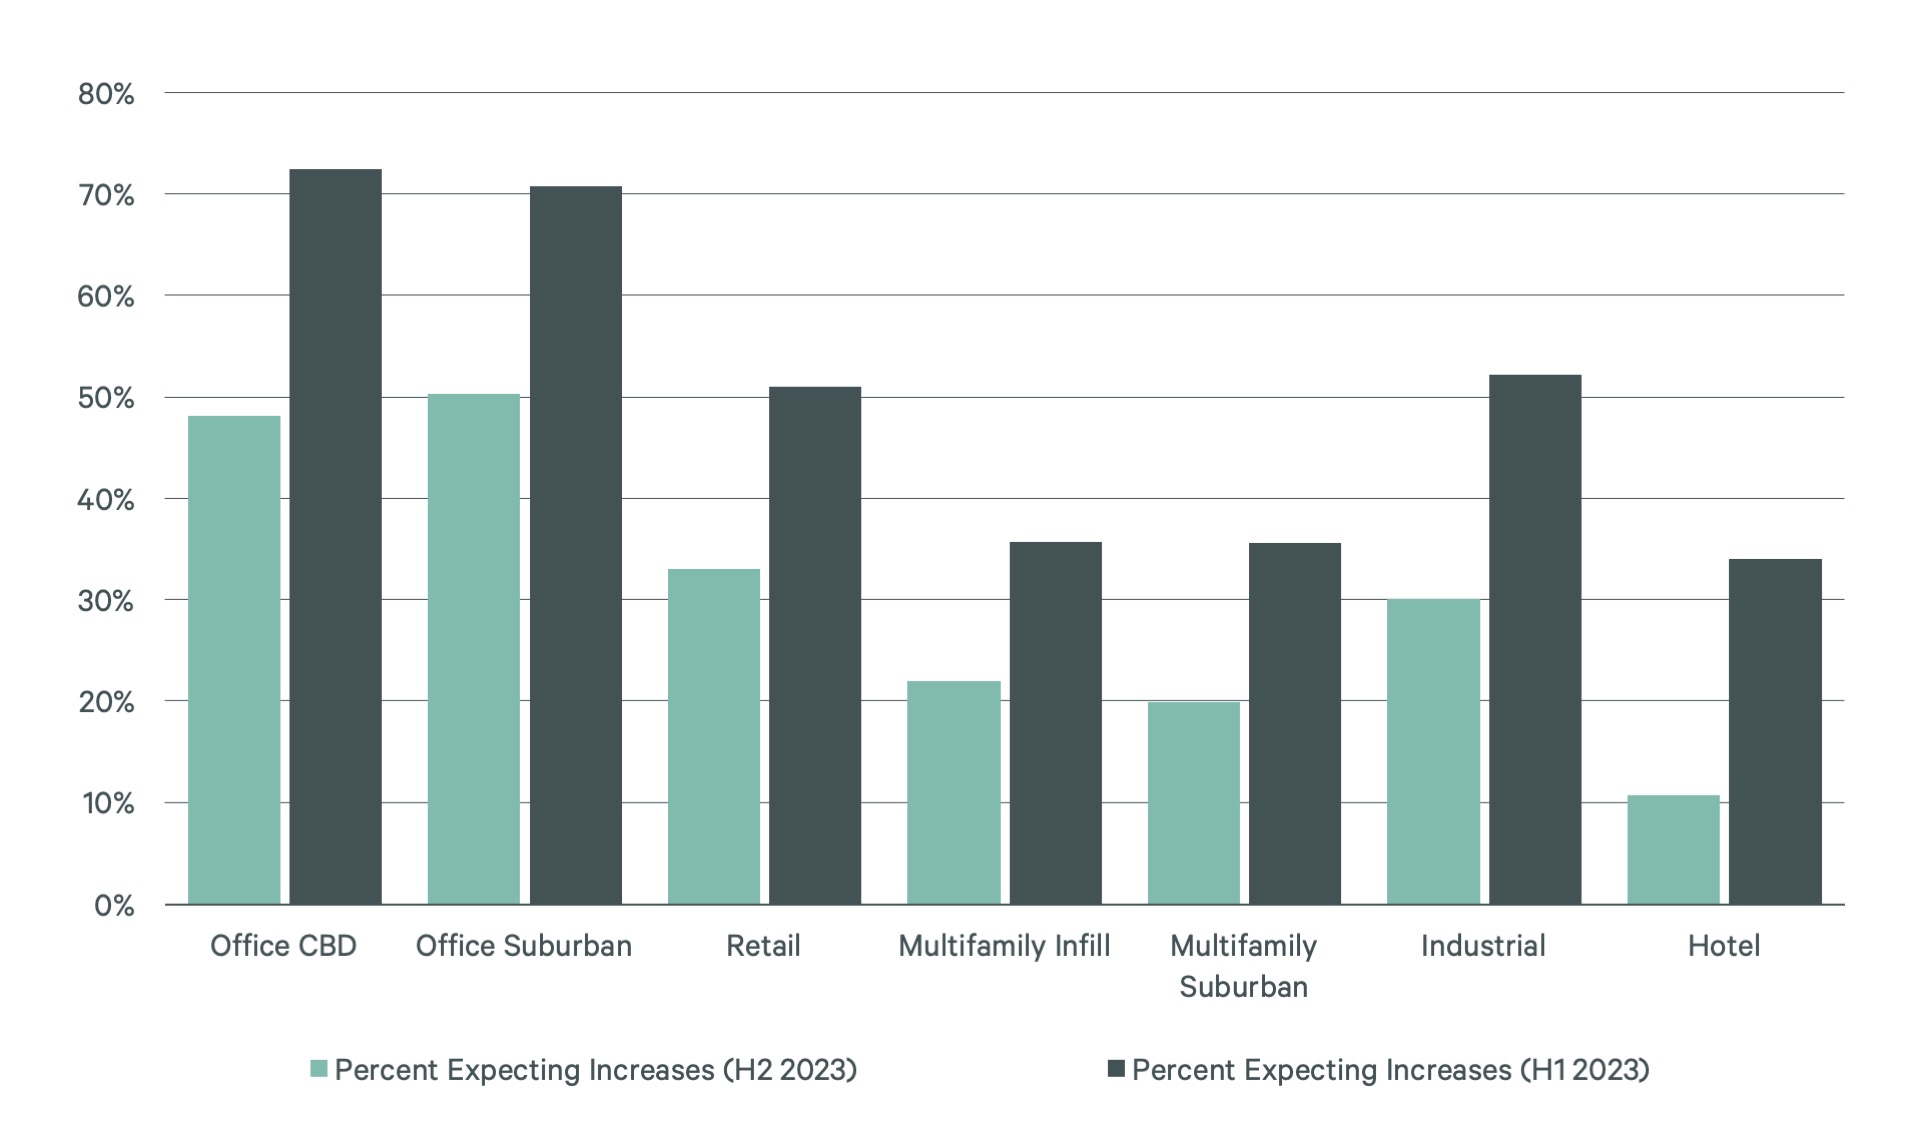
- Every CRS asks respondents to estimate the direction and magnitude of cap rate movement during the next six months. Figure 3 aggregates all answers by property type and displays the results as a fraction of responses expecting further yield increases. The most common response across all categories was “no change.”
- The share of respondents expecting further devaluations is highest within the office sector, reflecting the uncertainty around fundamentals.
- Fewer survey respondents believe cap rates will increase in H1 2024 than did so in H1 2023. This likely reflects investor expectations of a more accommodative Federal Reserve policy and bond yields decline from October 2023 highs.
Figure 3: How will cap rates trend over the next six months?
Definitions
- Markets conform to metropolitan area and metropolitan divisions as defined by U.S. Census Bureau.
- The cap rates presented in this report are based upon estimates by CBRE capital markets and valuation professionals. These estimates are informed by recent trades within their respective markets and discussions with investors. The ranges represent the cap rates at which a given asset is likely to trade in the current market. Cap rates within each subtype vary, occasionally falling outside the stated ranges, based on asset location, quality and property-specific characteristics.
- Stabilized properties are assets leased at market rents with typical lease terms and have vacancy levels close to market averages.
- Stabilized cap rates are the ratio of stabilized net operating income (NOI) to the acquisition price of the asset.
- Value-add cap rates are the ratio of stabilized NOI after property enhancements to the acquisition price of the asset plus value-add capital.
- The NOI calculation is based on net income less operating expenses.
Related Insights
-

Investors cited higher-for-longer interest rates, tight credit conditions and differing buyer and seller expectations as the biggest impediments to commercial real estate investment activity in 2024.
-

The H1 2023 Cap Rate Survey provides a fresh perspective of where market sentiment is trending.
Related Services
EA is CBRE’s forecasting Research group, comprised of professional economists, data scientists and analytical experts.
CBRE’s trusted specialists in economics, data science, and forecasting at Econometric Advisors deliver the most sought-after analytical real estate re...
- Invest, Finance & Value
Capital Markets
Gain proactive insights and strategies that unlock value, drive returns and enhance outcomes for your real estat...
Gain accurate insights on your property value from our experts across valuations, appraisals and advisory services, globally.
Research Contacts
Dennis Schoenmaker, Ph.D.
Executive Director & Principal Economist, CBRE Econometric Advisors

Darin Mellott
Vice President, Head of U.S. Capital Markets Research, CBRE


Capital Markets Contacts
Christopher R. Ludeman
Global President, Capital Markets

Kevin Aussef
Americas President of Investment Properties, CBRE

James Millon
President, US Debt & Structured Finance, Advisory Services


Christopher J. Decouflé
Managing Director, Retail Capital Markets, U.S.


Valuation & Advisory Services Contact
Thomas Edwards, FRICS, CPV
Global President, Valuation & Advisory Services

.jpg)