Chapter 4
Changing Occupancy Metrics
Global Occupancy Insights 2021-2022
3 Minute Read
The data points that matter most to decision-makers
Twenty-eight percent of survey respondents said that utilization rate was the occupancy metric that mattered most (Figure 4), followed by a tie for seat (design) density and vacancy percentage (both 20%).
Figure 4: Occupancy metric that matters the most (ranked in order of relevance)
Source: CBRE Global Occupancy Insights Report, 2021.
Utilization rate is the metric that matters most.

Traditionally, vacancy was the most relevant metric to occupiers, but with the ability to track actual space utilization, more users are adopting utilization data as they plan their future real estate needs, with 83% of respondents tracking or planning to track utilization going forward (Figure 5). By contrast, only 29% of respondents have a target office-vacancy rate (Figure 6).
Figure 5: Does your client plan to track
utilization data in the future?
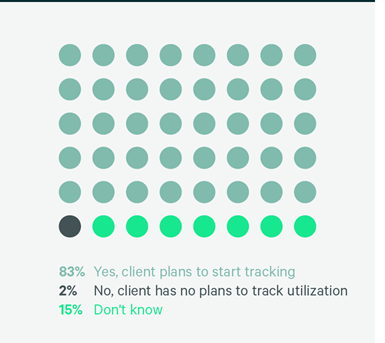
Source: CBRE Global Occupancy Insights Report, 2021.
Figure 6: Does the client have a target
office vacancy rate?

Source: CBRE Global Occupancy Insights Report, 2021.
The key to using metrics successfully is to first understand business needs and mapping those to metrics that measure them. It’s crucial to constantly measure and benchmark these metrics over time (Figure 7).
Figure 7: Understanding business needs
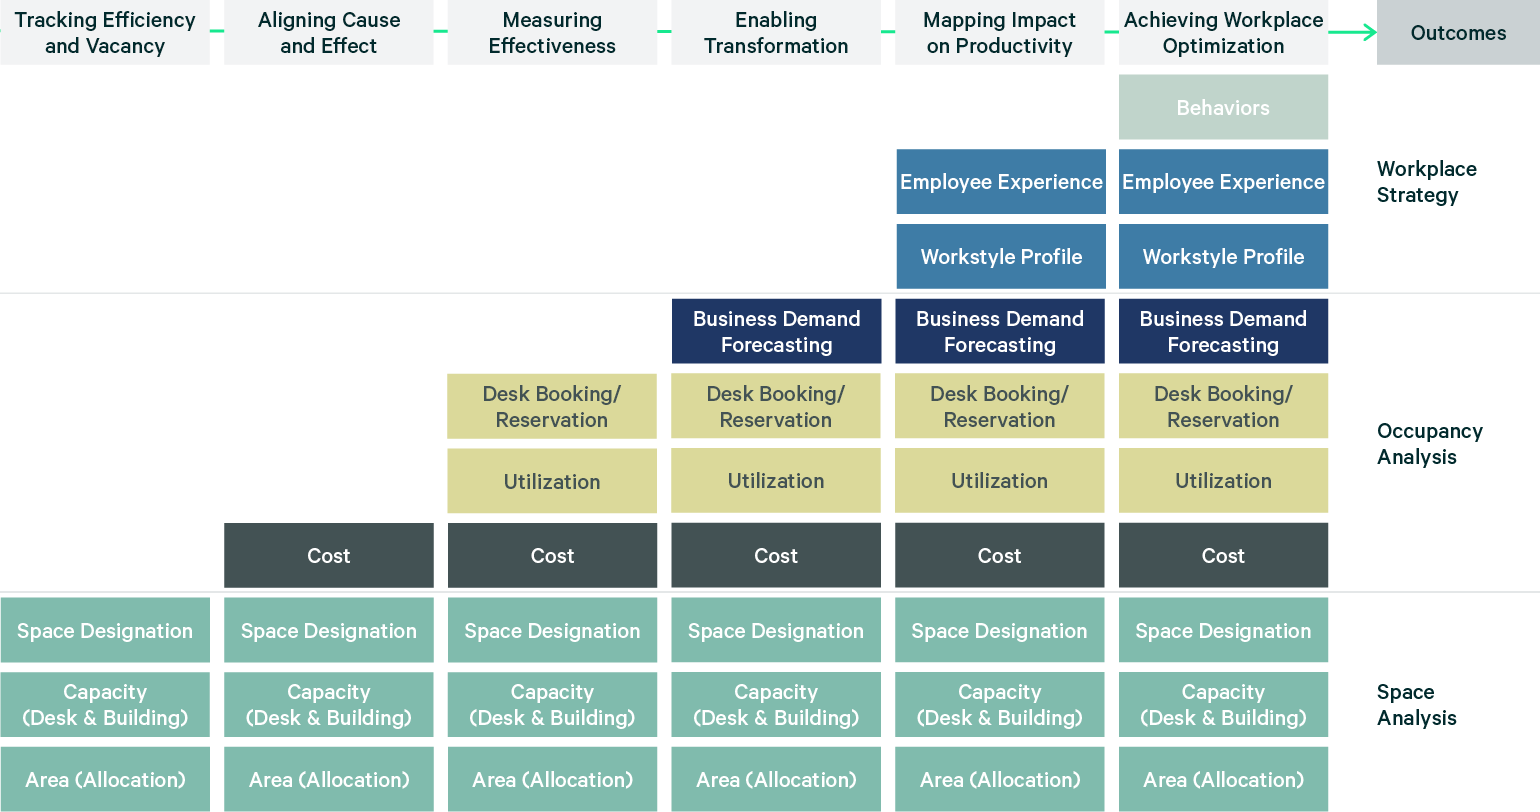
Source: CBRE Global Occupancy Insights Report, 2021.
New occupancy metrics key to future decisions
A major theme from our survey is the important role occupancy data plays in real estate decision-making.
Organizations want to measure their occupancy metrics against peers, and they want to know how others are handling the return-to-office process. In addition, new metrics and ways of capturing and measuring data are so abundant that some traditional occupancy metrics, like vacancy rates and seat density, have become less relevant.
The ability to measure and compare metrics requires standardized data definitions, which include the following:
CAPACITY
The total number of seats (workspaces like offices or workstations)
SEAT (DESIGN) DENSITY
The total number of seats divided by the total rentable or usable sq. ft. or sq. m.
HEADCOUNT
The total number of individuals that occupy or are assigned to a seat, neighborhood, floor, building or campus
PLANNED VACANCY
The number of vacant seats held for anticipated future growth
VACANCY
The total number of seats not assigned to an individual headcount or business unit
UTILIZATION RATE
The number of individuals using a space divided by capacity
Regional differences in density
On a global basis, seat (design) density averaged 195 sq. ft. per seat. Regionally, the Americas averaged the highest allocation, at 223 sq. ft. per seat, followed by EMEA and APAC, at 172 and 142 sq. ft. per seat, respectively.
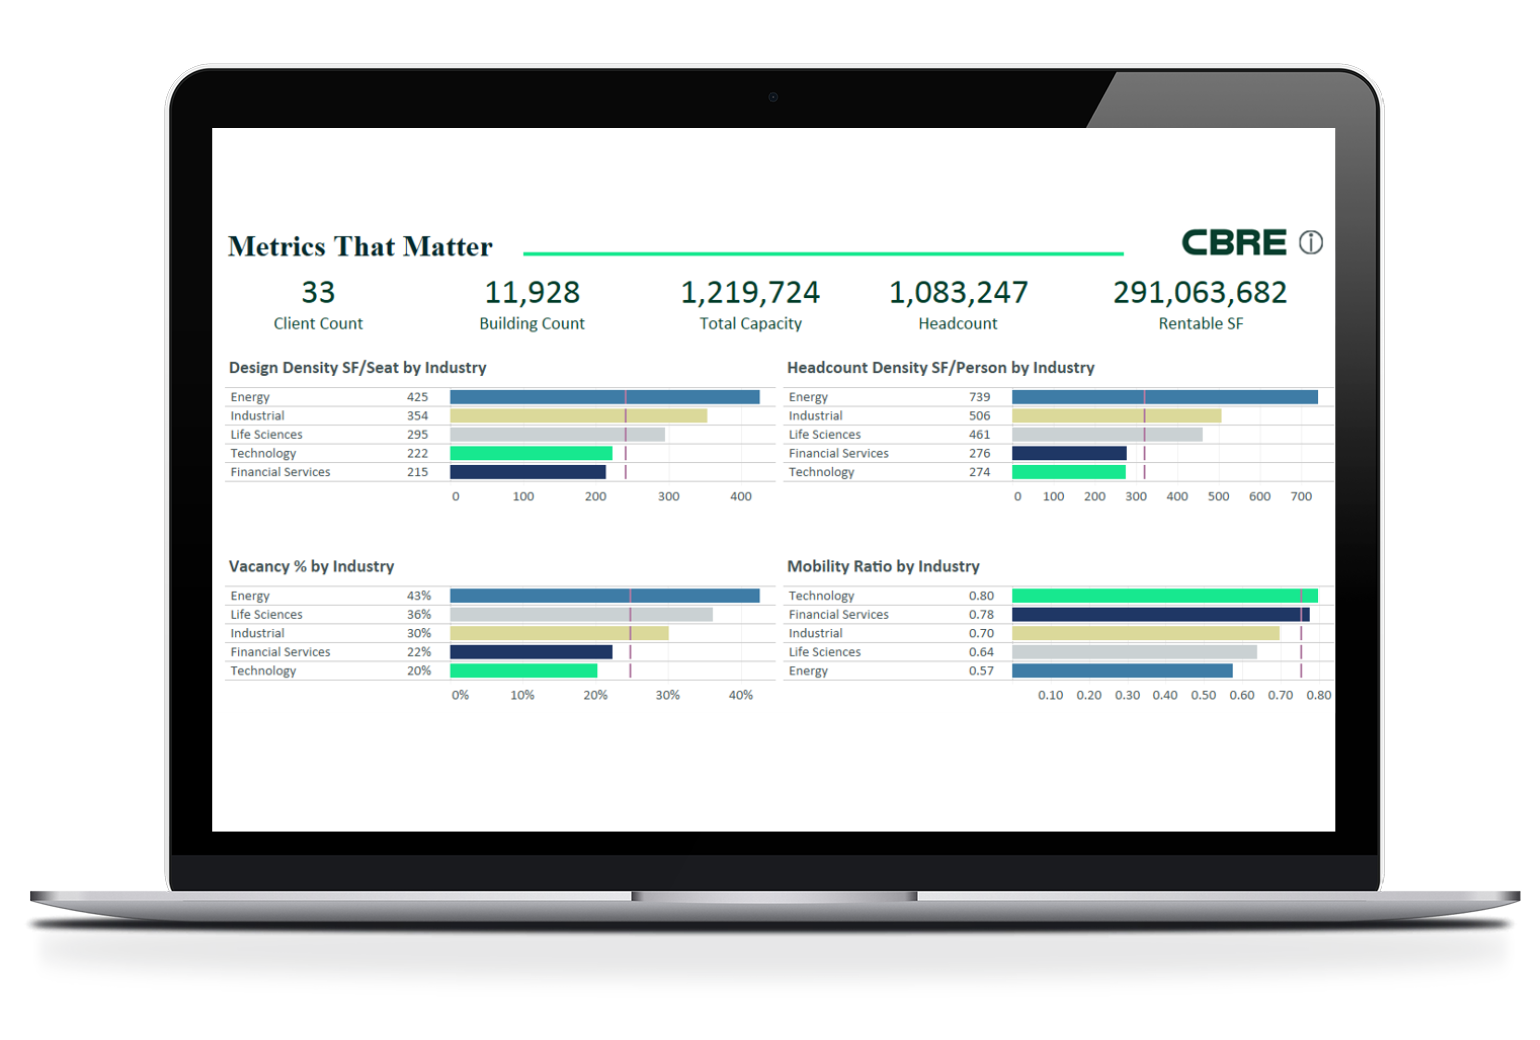
Using CBRE’s Occupancy Management Property Benchmarking Dashboard to track occupancy metrics
Seat (design) density, vacancy, mobility and other key metrics can be analyzed in CBRE’s Occupancy Management Property Benchmarking Dashboard, a proprietary web-based tool. See screenshot below for the “Metrics that Matter” view. For more information on CBRE’s Occupancy Management Subjective Survey Dashboard or to request a demo, contact the team leader from your region, listed on the Contributors page.