Chapter 3
Methodology
Global Occupancy Insights 2021-2022
2 Minute Read
Figure 2: Responses by geography
Source: CBRE Global Occupancy Insights Report, 2021.
This report is the result of a three-part study, conducted by CBRE over the course of 2021. The first part, conducted in January, April and August, measured how organizations were affected by the pandemic and what they were doing to reopen their offices.
The second part collected a host of occupancy metrics and measurements from 12,000 buildings, including capacity, headcount and square footage, broken down by space type and function. The data was tabulated via CBRE’s Occupancy Management Property Benchmarking Dashboard, which reports the findings by industry, property type and geography to help benchmark, analyze and compare occupancy metrics.
The third part, a 100-plus questionnaire of CBRE’s Occupancy Management client leads, analyzed how organizations manage their workplace, space and occupancy programs now—and how they plan to adapt their programs in the future.
Figure 3: Responses by industry
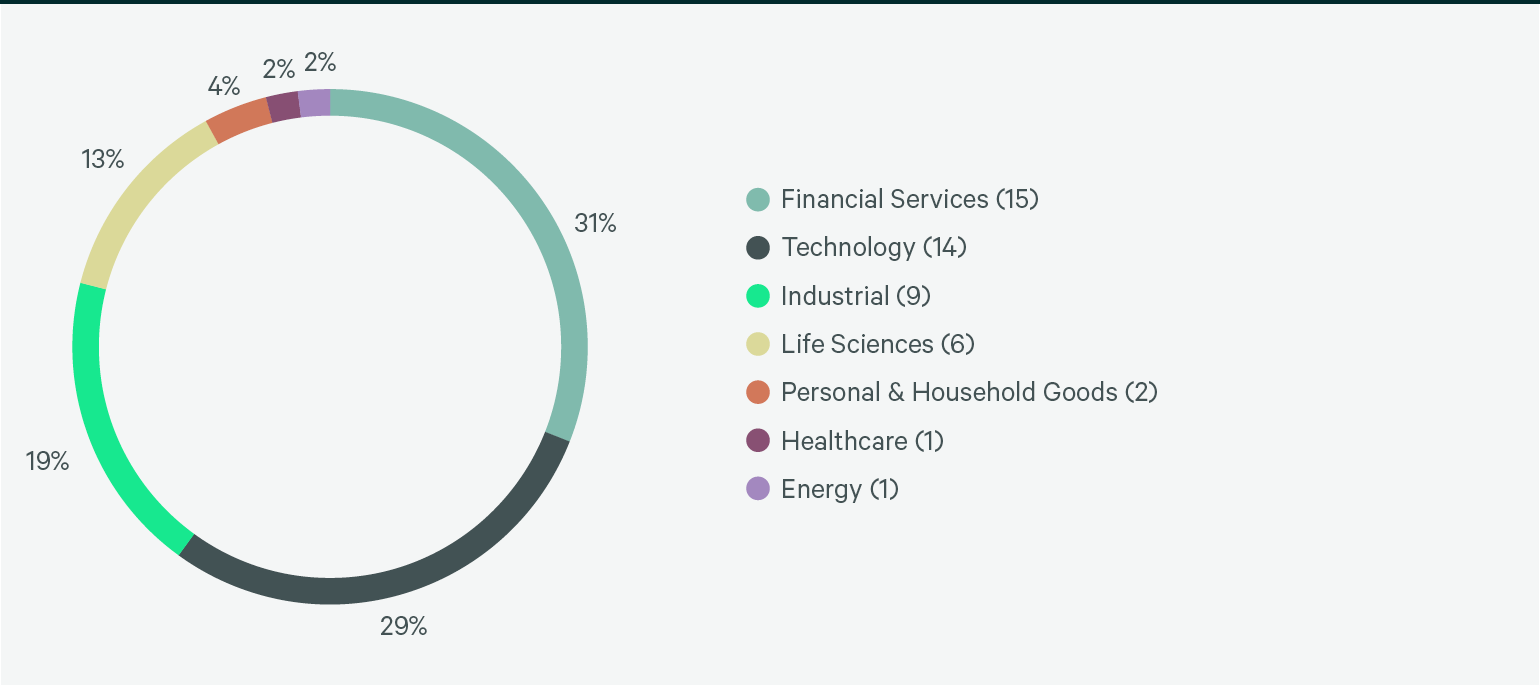
Source: CBRE Global Occupancy Insights Report, 2021.
The results and findings are based on data and responses from 42 global CBRE Occupancy Management client leads. We received 48 total responses—several client teams had individual responses by region. Collectively, these clients oversee 350 million sq. ft., or 32.5 million sq. m., of space across seven industries.
This results of this survey will serve as baseline for future studies to track ongoing shifts in space, occupancy, mobility and utilization trends.
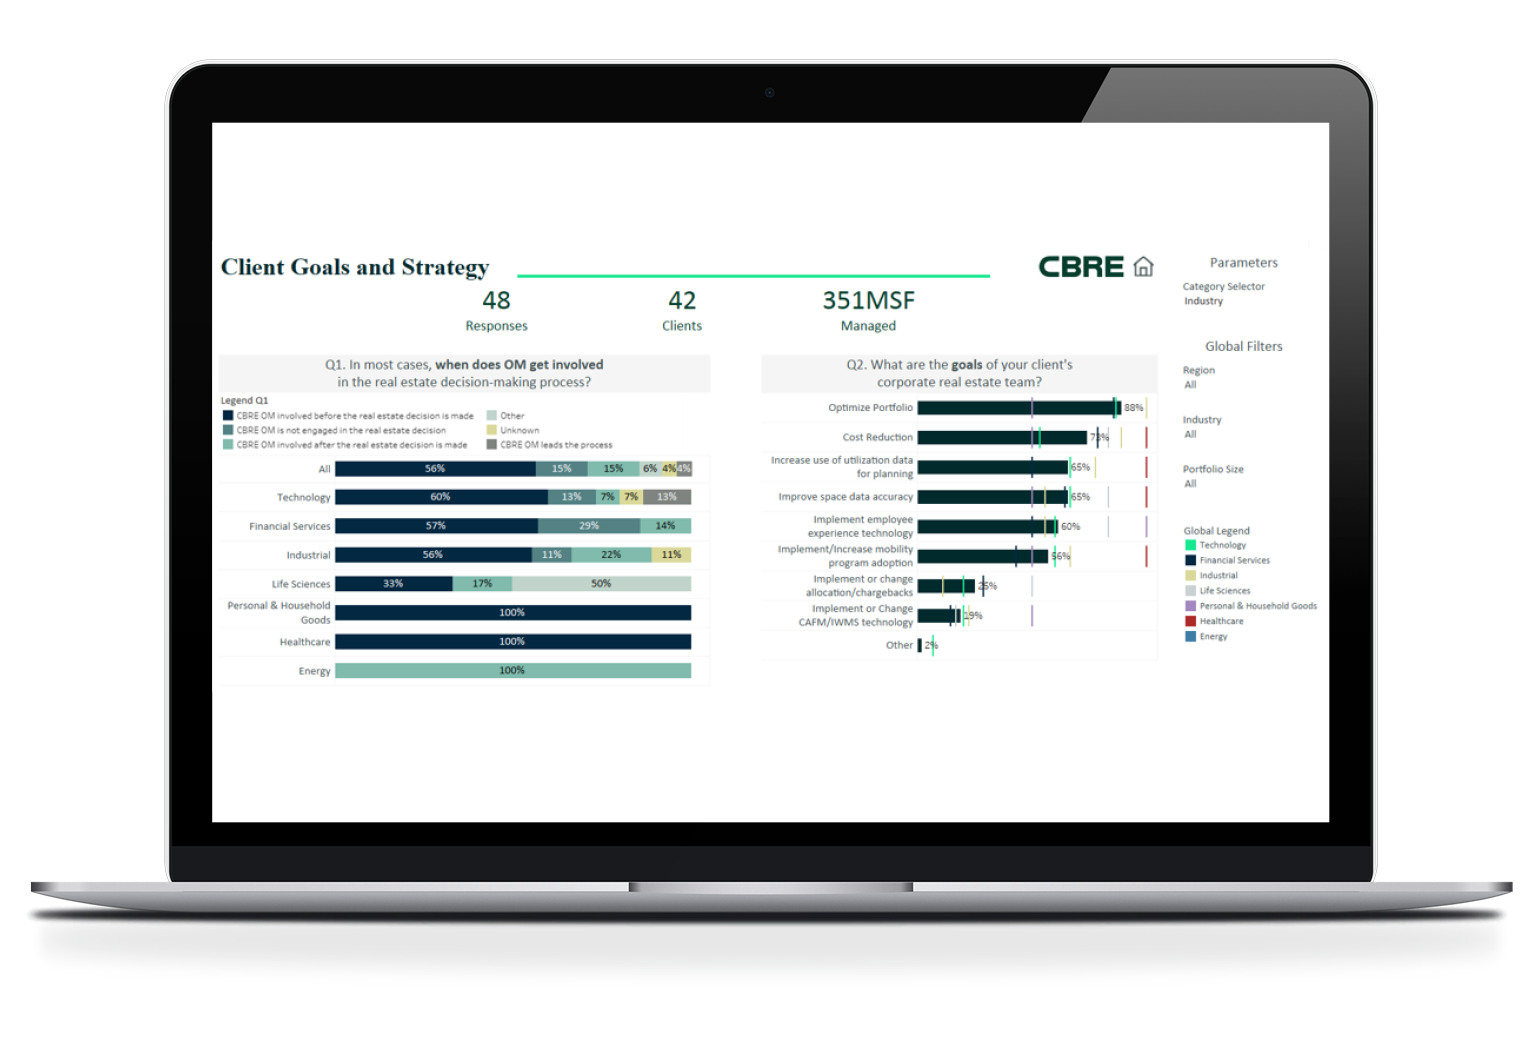
Using CBRE’s Occupancy Management Subjective Survey Dashboard to dig further into the results.
The responses for our annual survey have been visualized in an interactive dashboard. The data can be viewed by region, industry, and portfolio size. See screenshot for a portion of the “Client Goals and Strategy” view. For more information on CBRE’s Occupancy Management Subjective Survey Dashboard or to request a demo, contact the team leader from your region, listed on the Contributors page.