Future Cities
Nashville Market
2025 North America Industrial Big-Box Review & Outlook
April 16, 2025 5 Minute Read

Supply & Demand
Nashville continues to experience strong big-box fundamentals due to its central location and population growth. Leasing activity finished the year at 6.4 million sq. ft., slightly lower than 2022’s 6.9 million sq. ft. Net absorption hit a record in 2023 at 6.2 million sq. ft. This helped vacancy rates stay below 3% for the third consecutive year, at 2.5%, the second-lowest of all U.S. markets in this report. General retailers & wholesalers were most active, accounting for 47.5% of total leases.
8.5 million sq. ft. was under construction by year-end, nearly all still available to lease. There is nearly three times more available under construction space than available existing space. This may lead to more vacancies even with continued strong lease volume. Given that this market has had 97% occupancy since the pandemic’s onset, occupiers are expected to have the most lease options in years.
Figure 4: Share of 2023 Leasing by Occupier Type
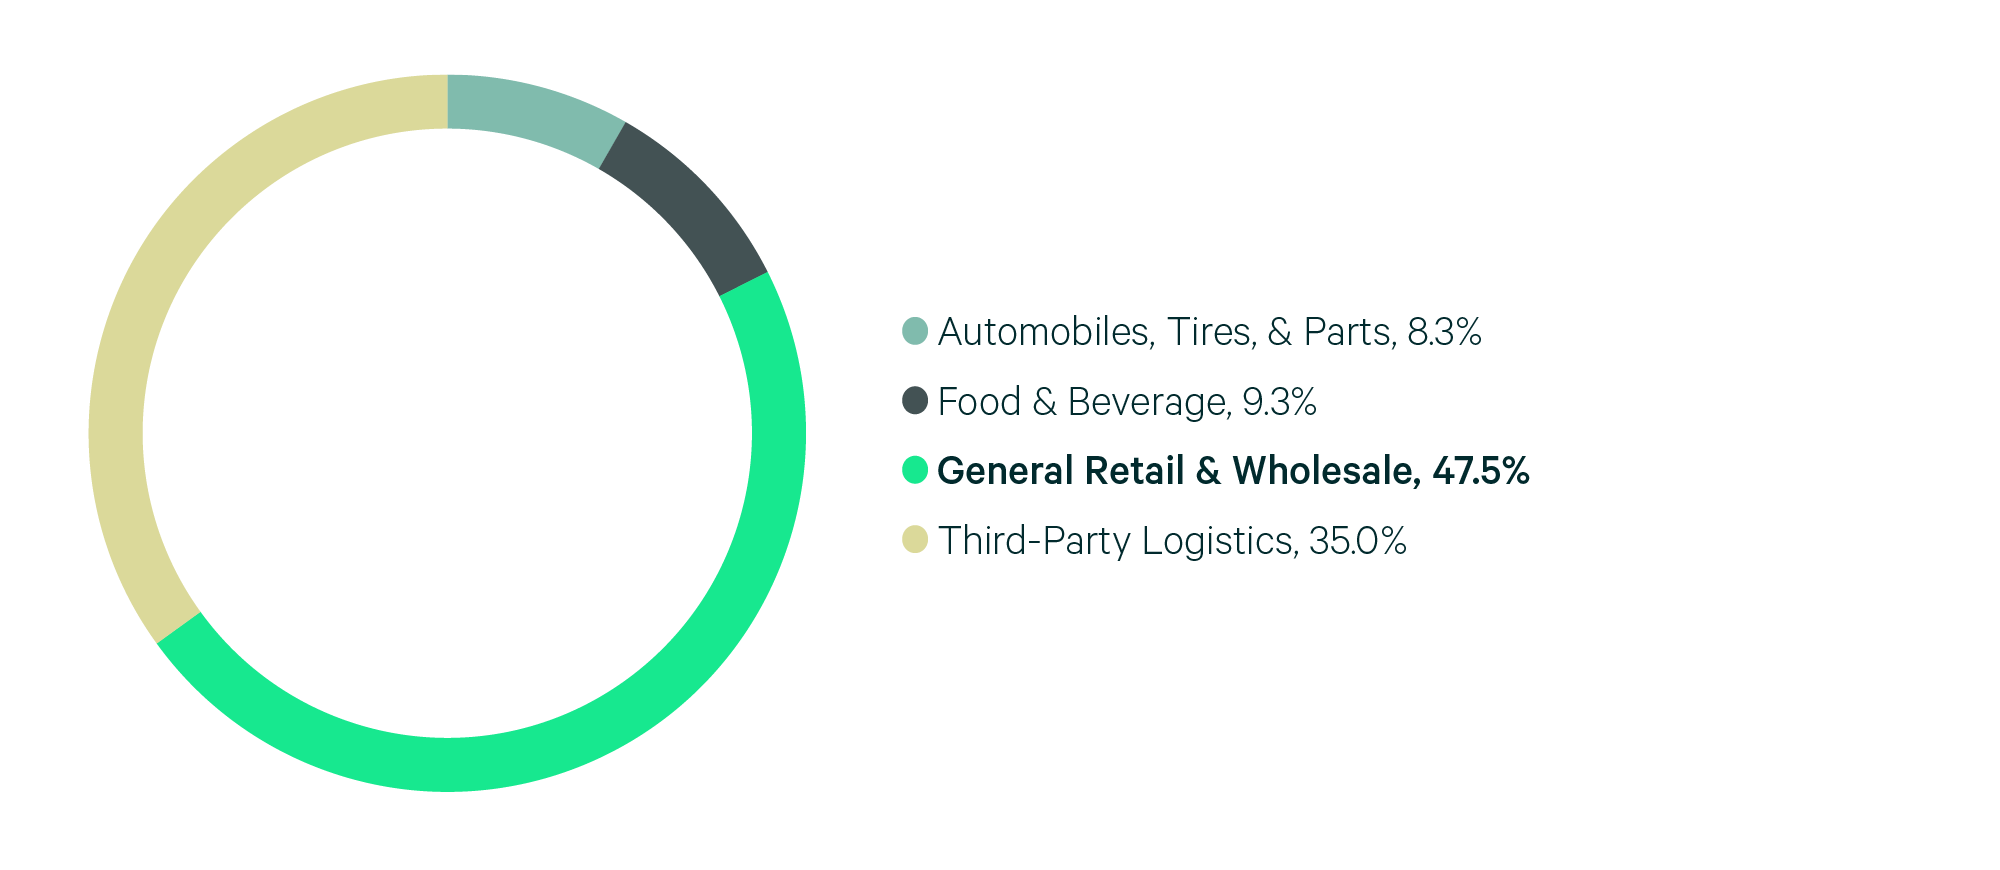
Source: CBRE Research.
Figure 5: Lease Transaction Volume by Size Range
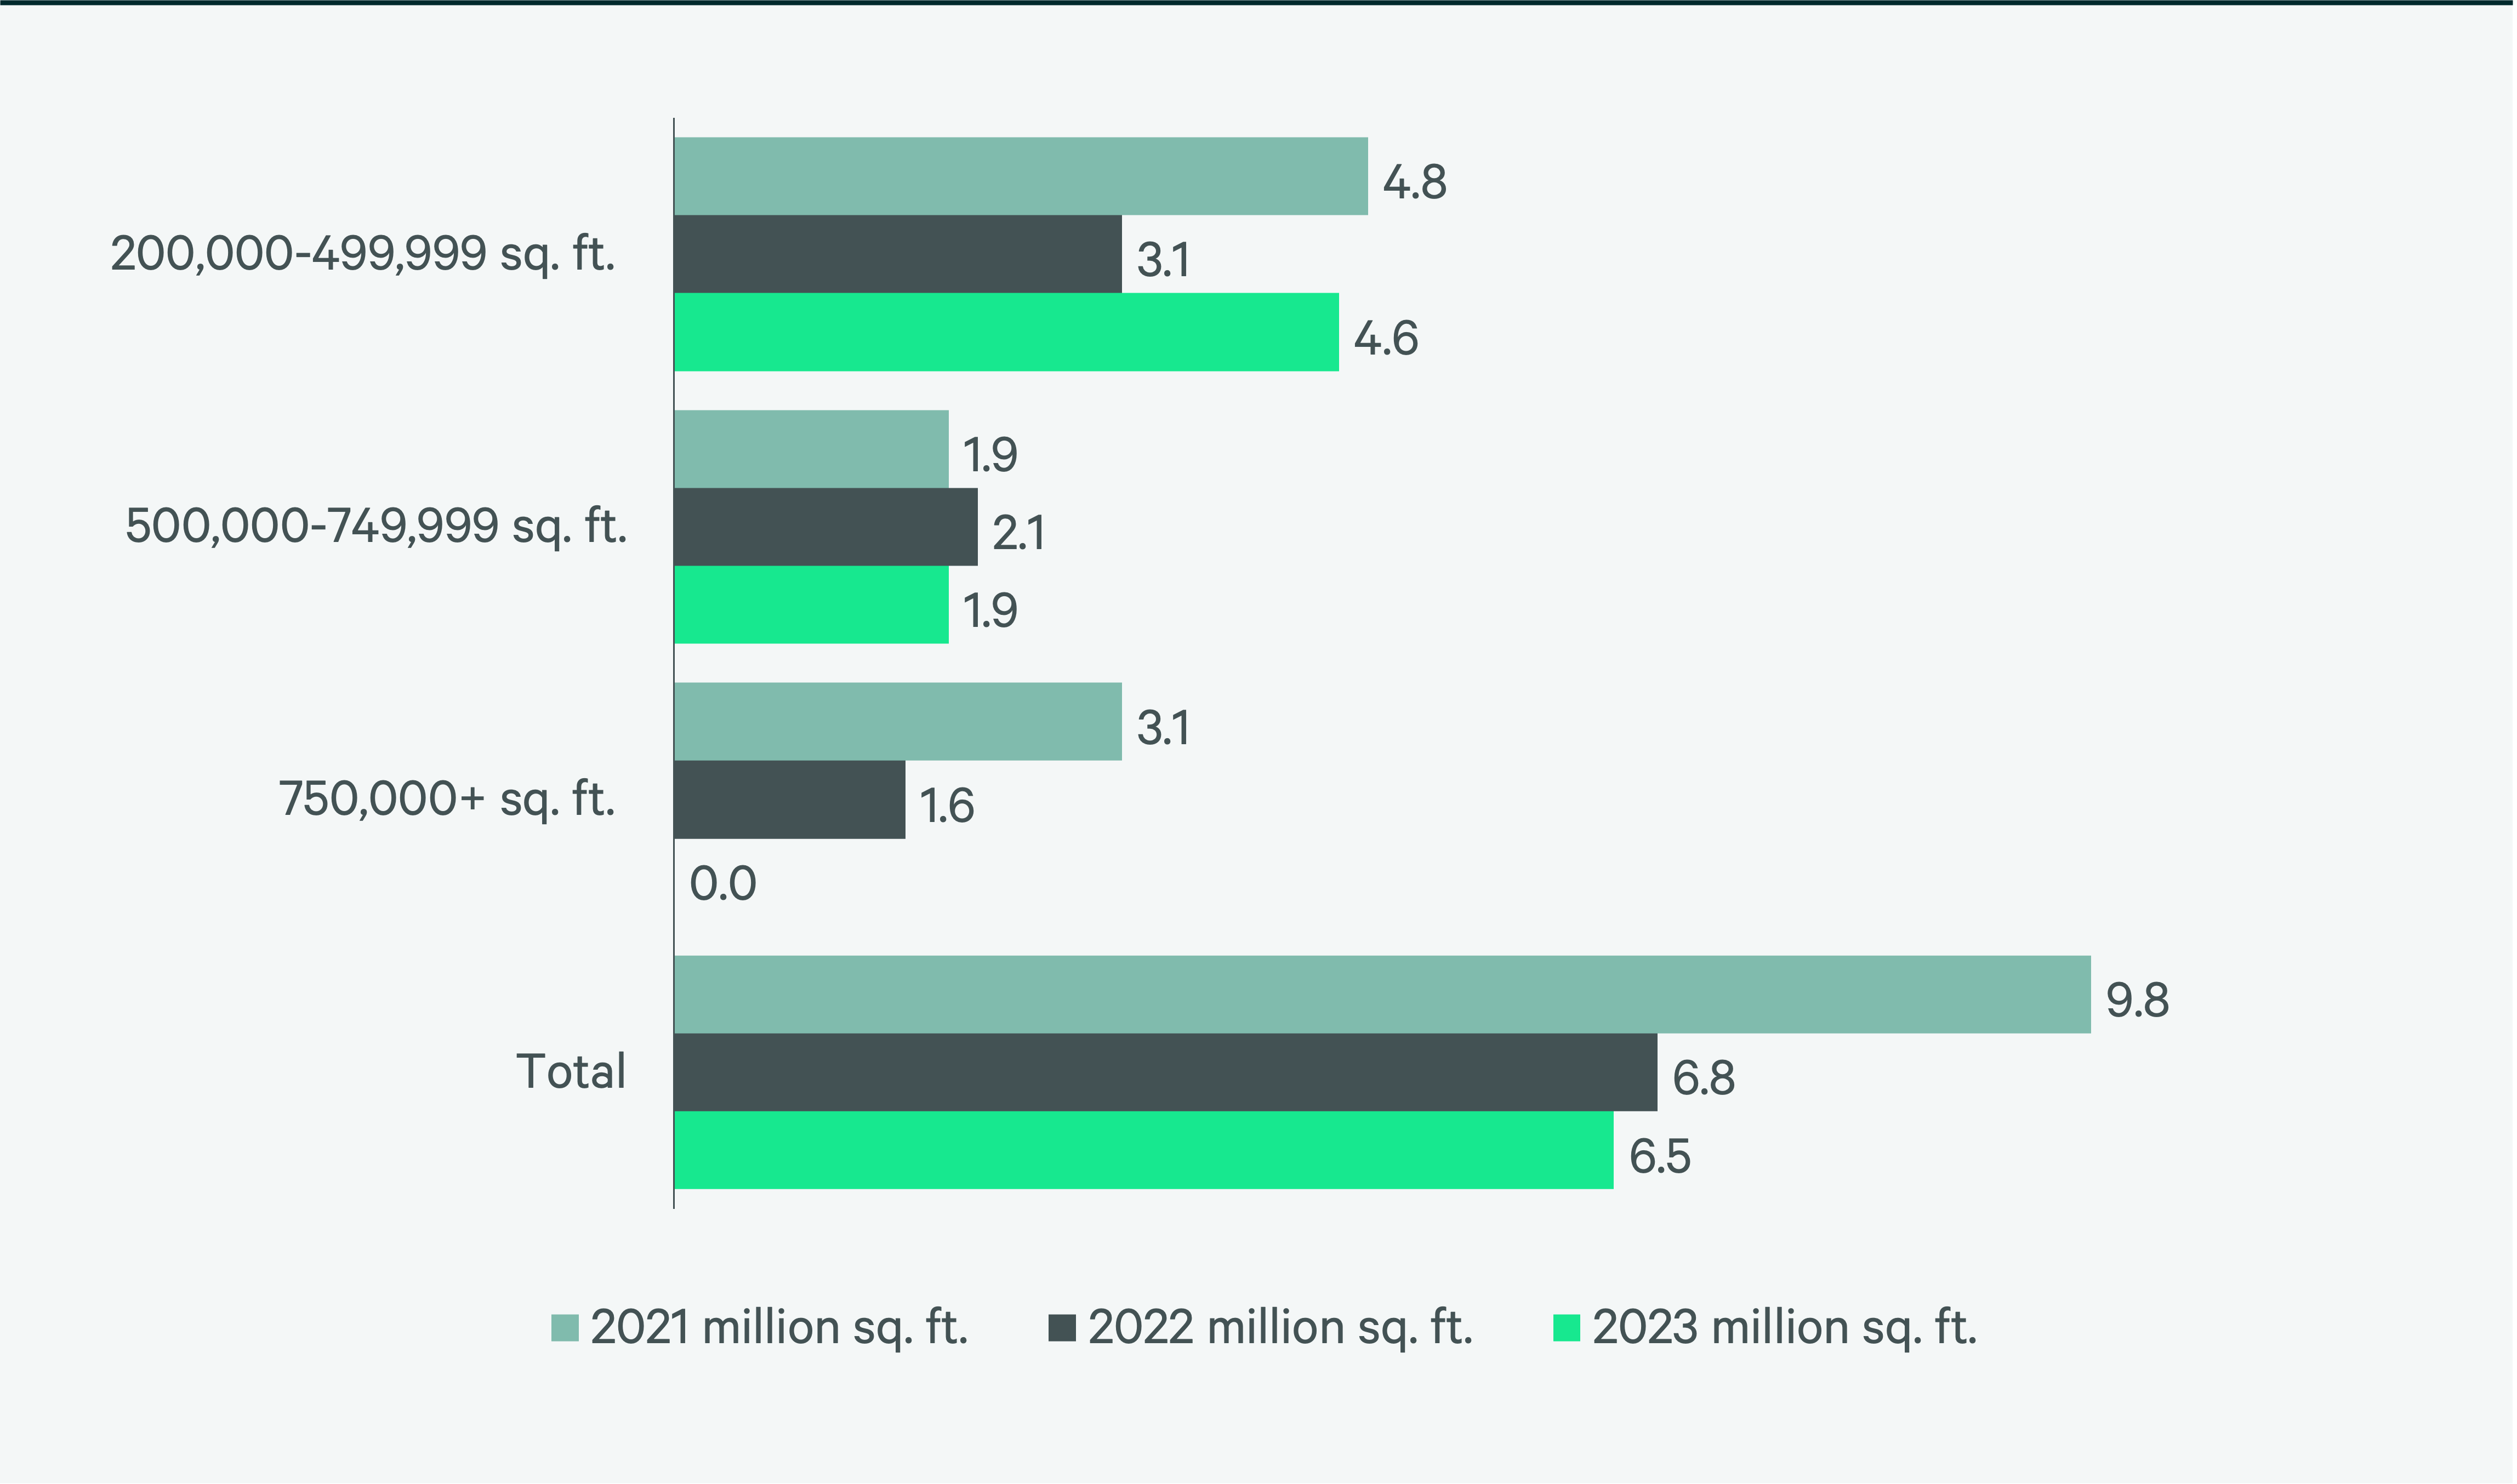
Source: CBRE Research.
Figure 6: 2023 Construction Completions vs. Overall Net Absorption by Size Range
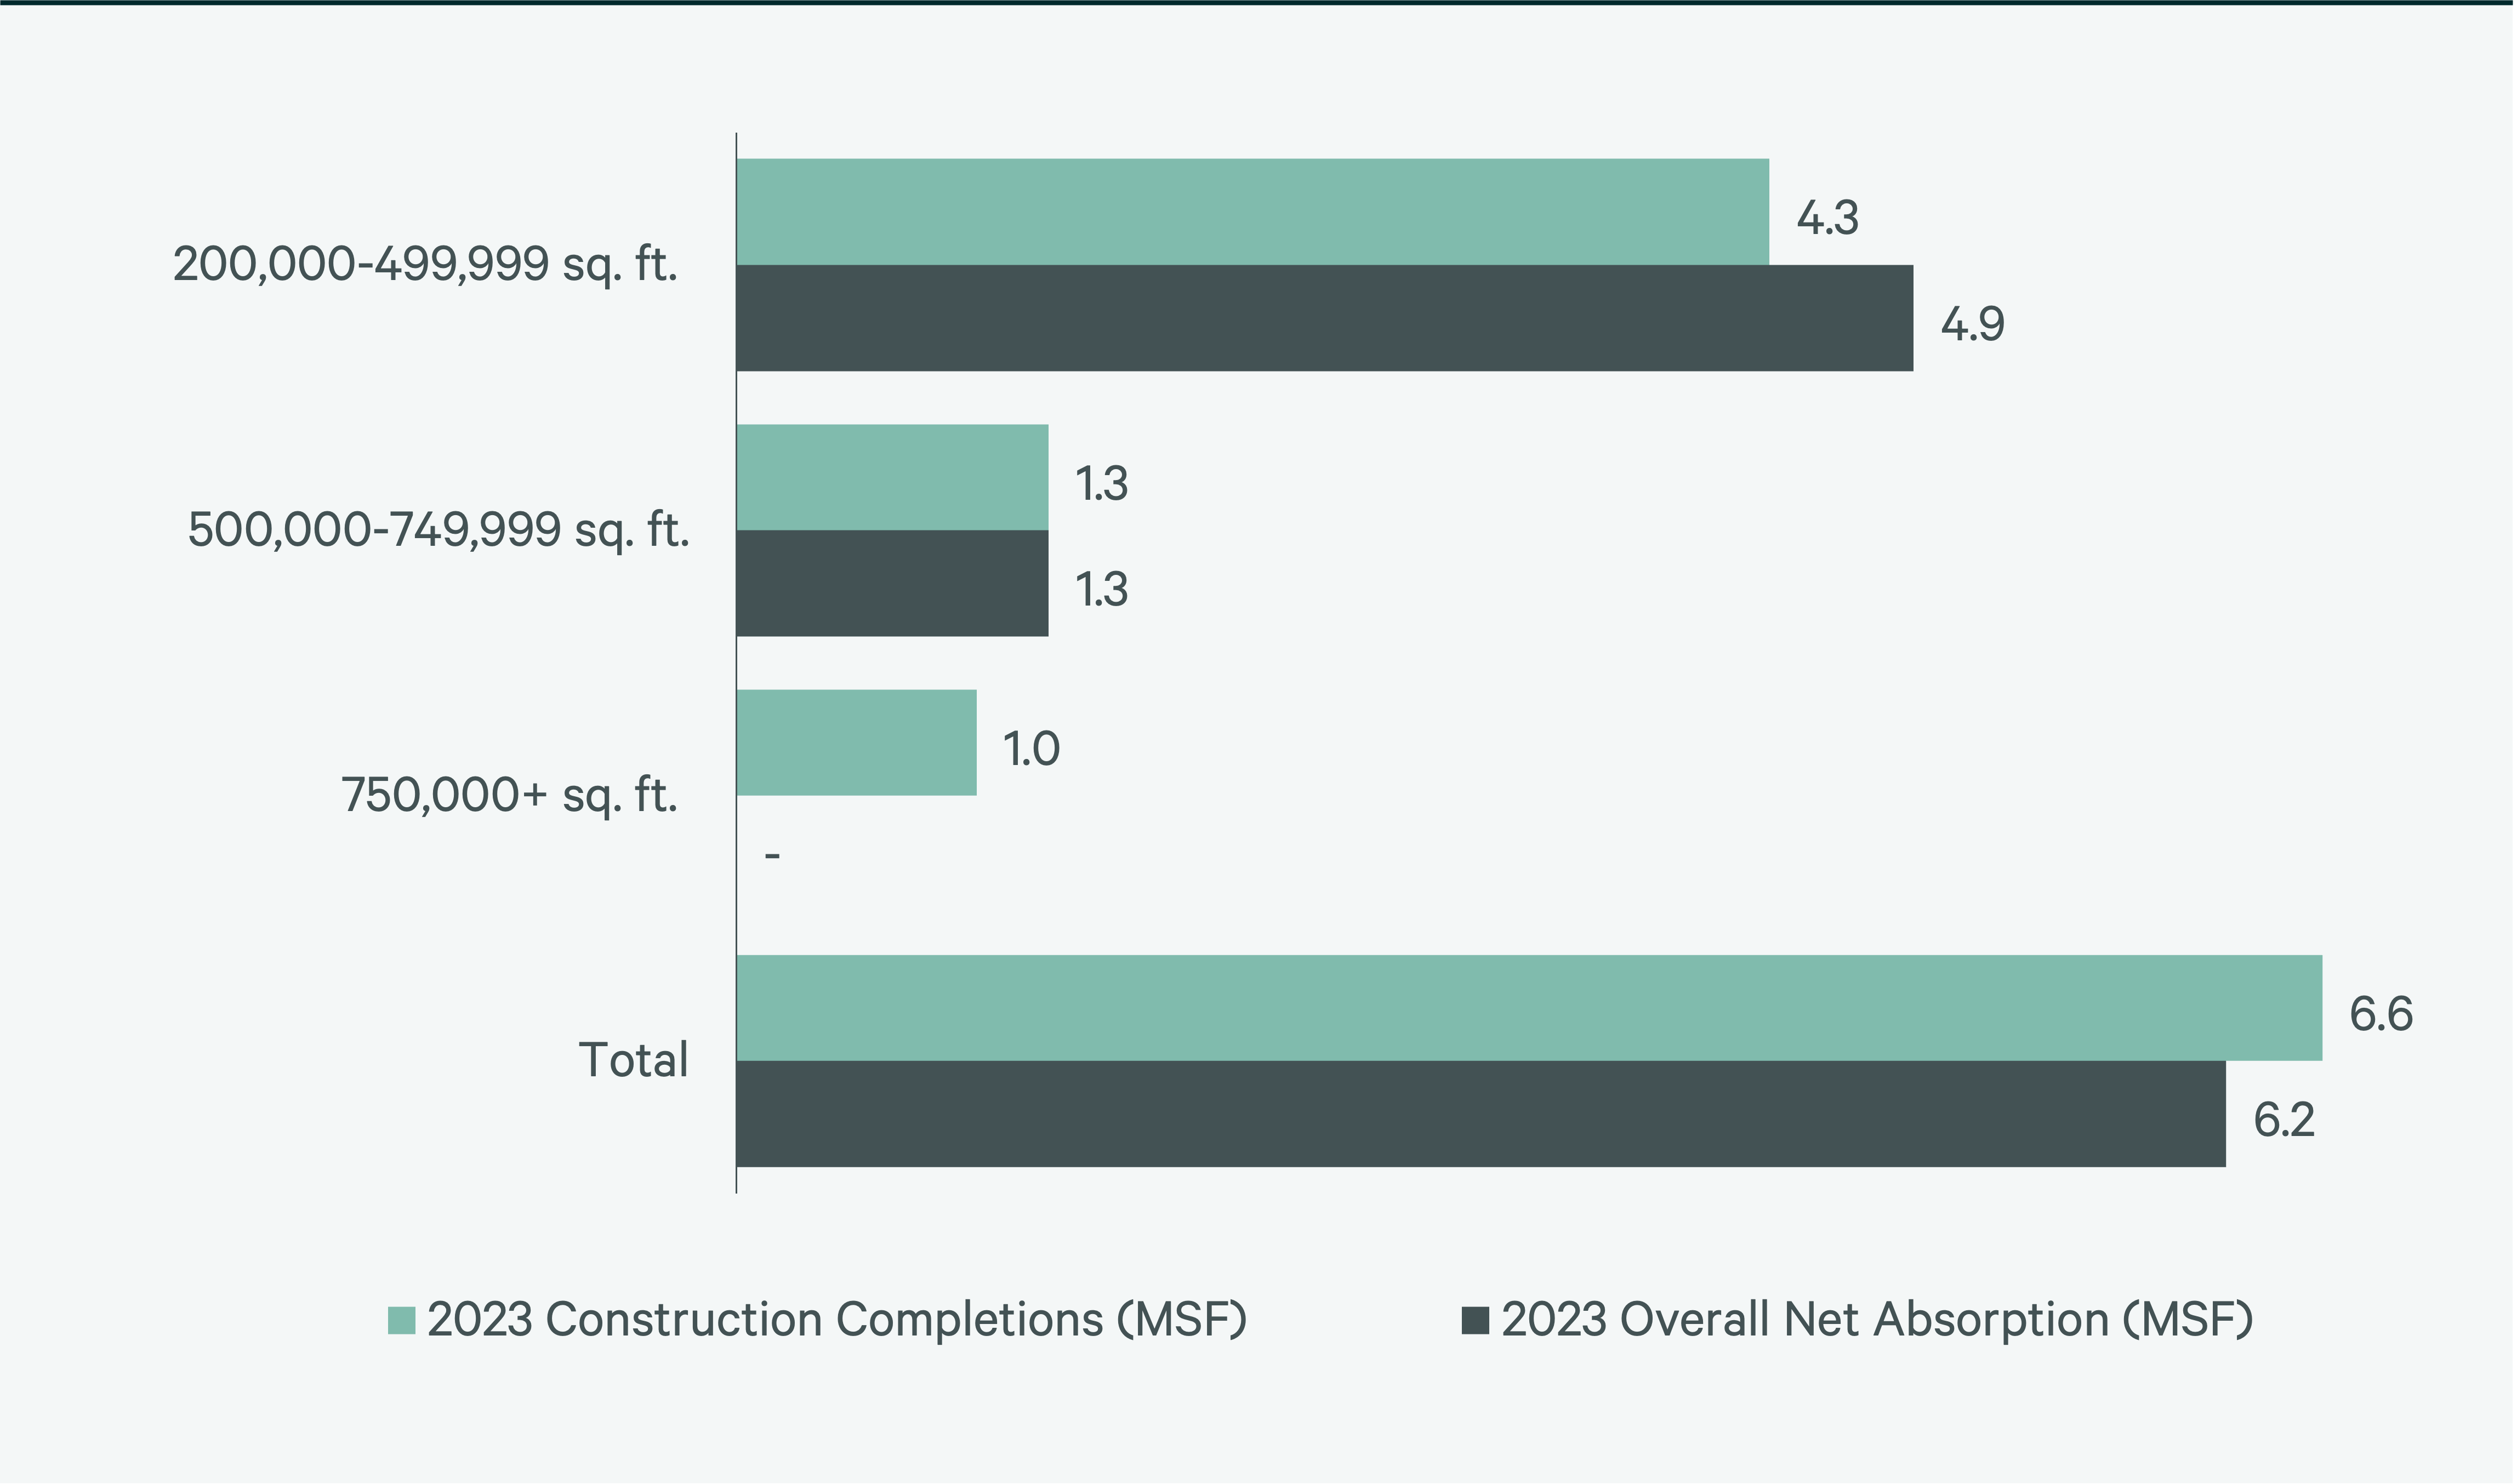
Figure 7: Direct Vacancy Rate by Size Range
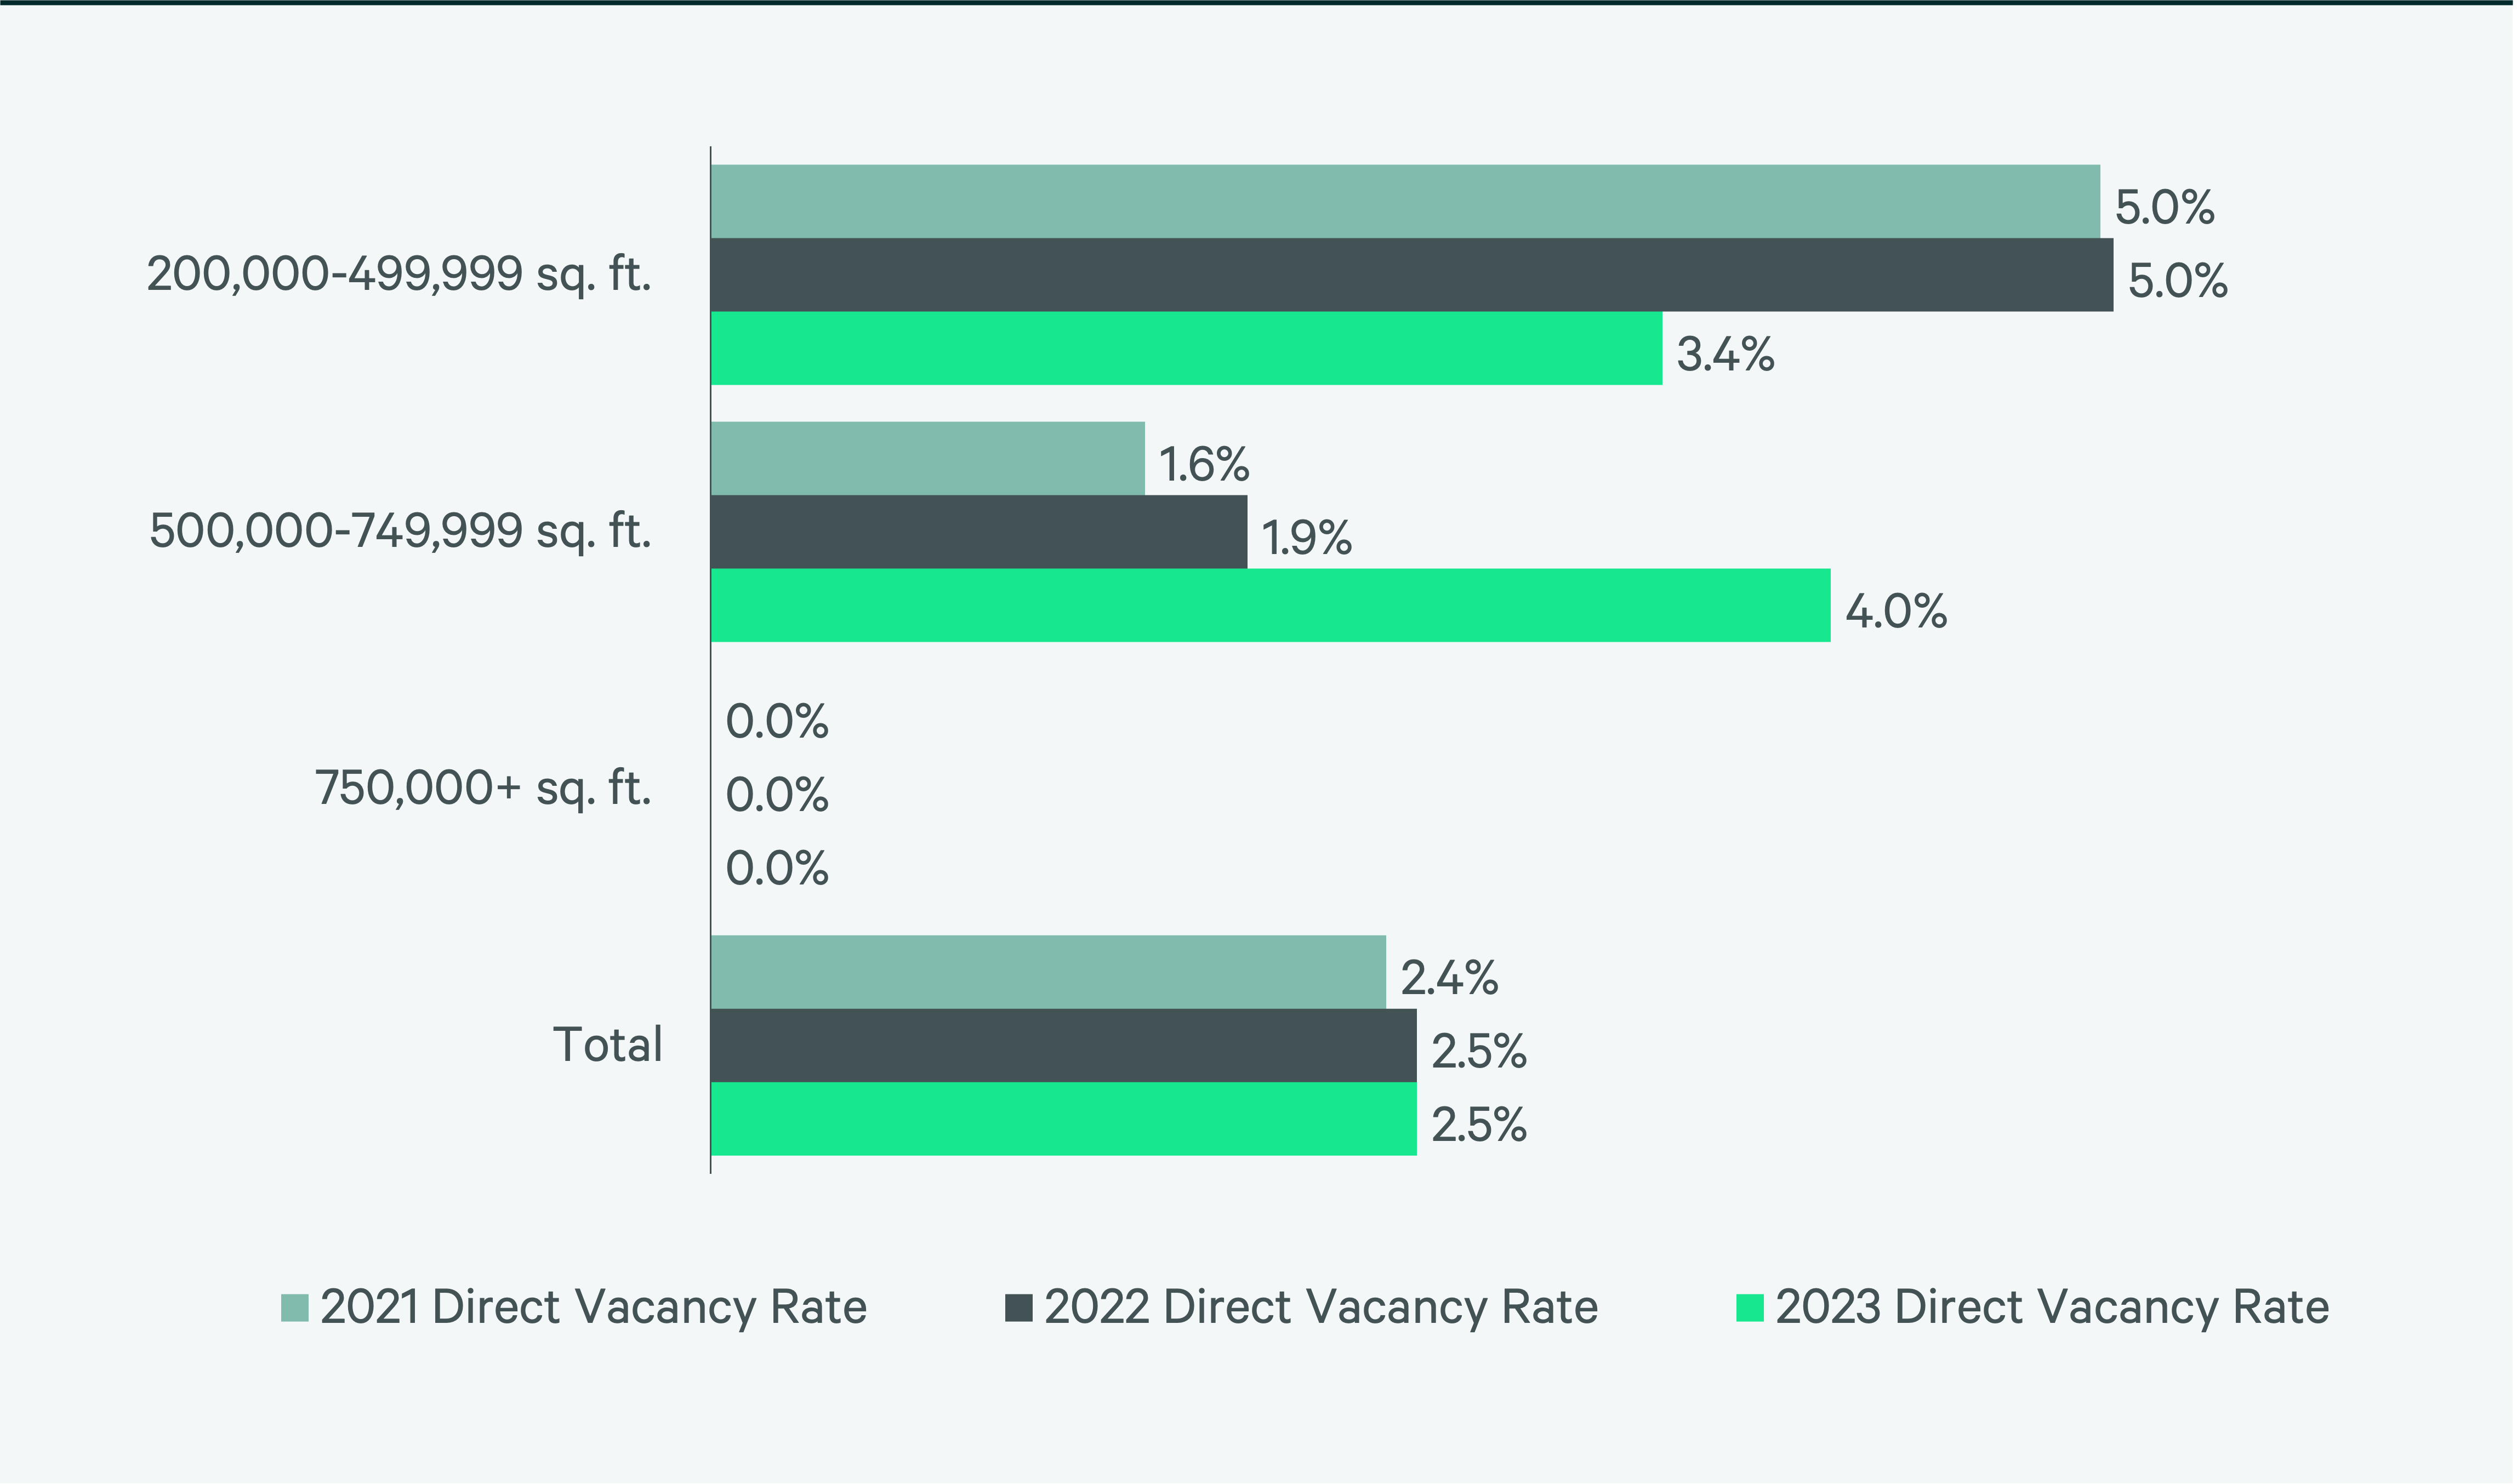
Figure 8: Under Construction & Percentage Preleased
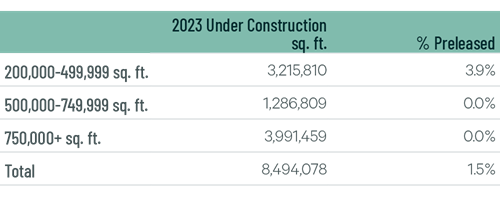
Figure 9: First Year Taking Rents (psf/yr)
Source: CBRE Research.
Explore Big-Box Insights by Market
Industrial & Logistics Research
James Breeze
Vice President, Global Industrial and Retail Research

John Morris
President, Americas Industrial & Logistics, Advisory Services