Future Cities
Toronto
2024 North America Industrial Big-Box Review & Outlook
April 29, 2024 5 Minute Read
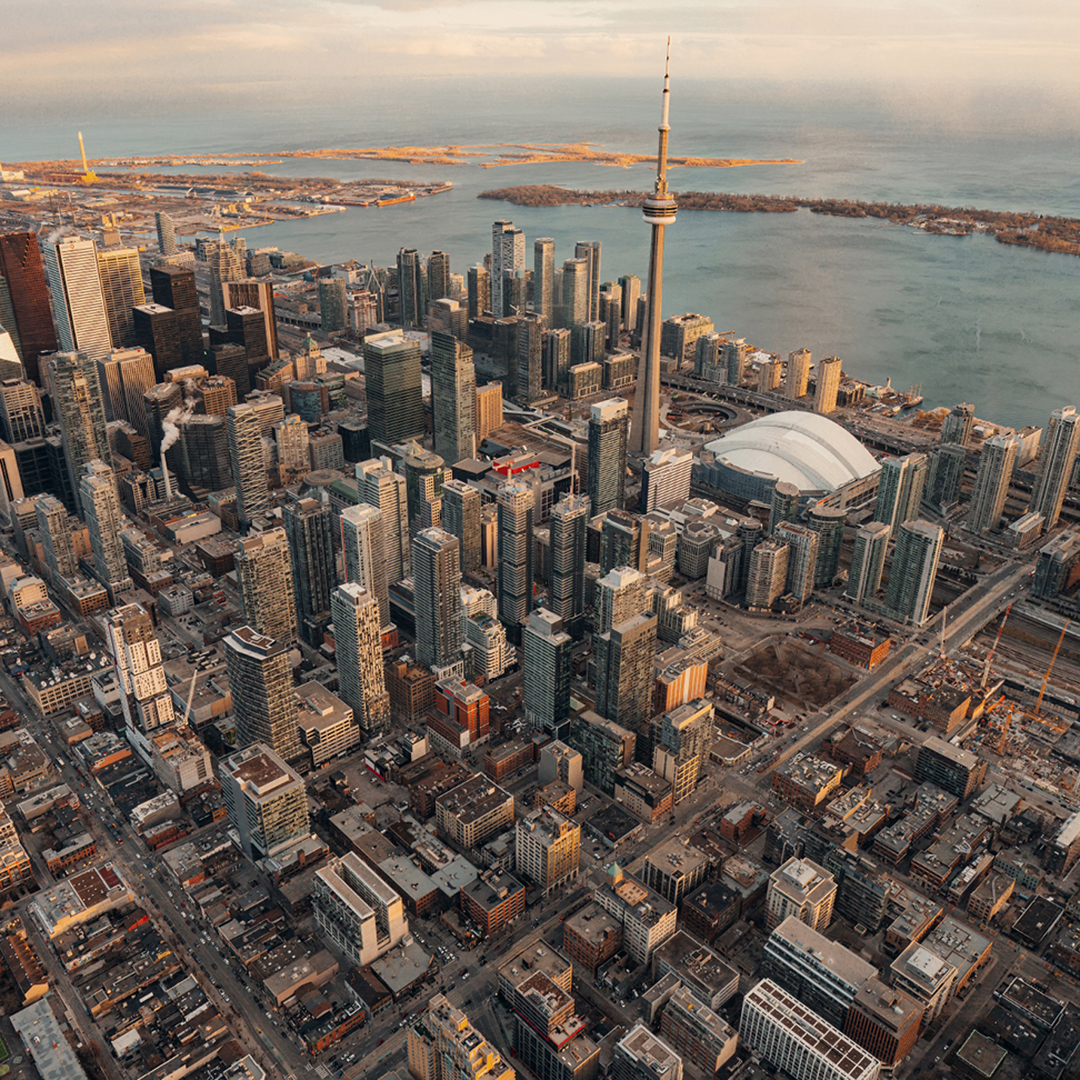
Demographics
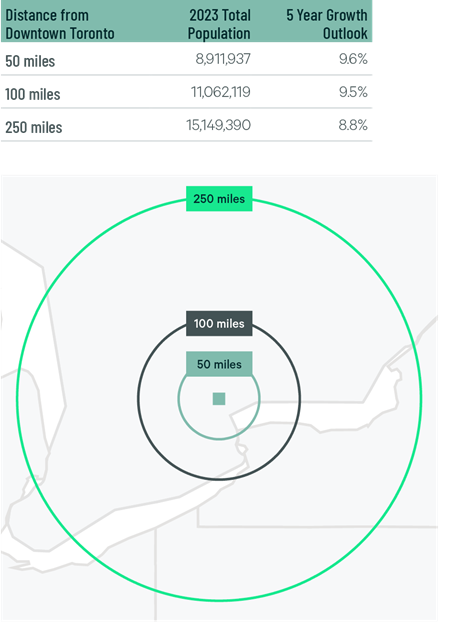
Around 9 million people live within 50 miles of the market’s core, the highest population concentration in Canada. The population’s expected five-year growth rate is 9.6%. Just over 15 million people live within 250 miles, with a projected 8.8% five-year growth rate.
Figure 1: Toronto Population Analysis
The local warehouse labor force of 217,310 is expected to grow by 25.6% by 2034, according to CBRE Labor Analytics. The average wage for a non-supervisory warehouse worker is C$19.00 (USD $14.11), tied with Montreal as the second-lowest of any market in this report.
Figure 2: Toronto Warehouse & Storage Labor Fundamentals
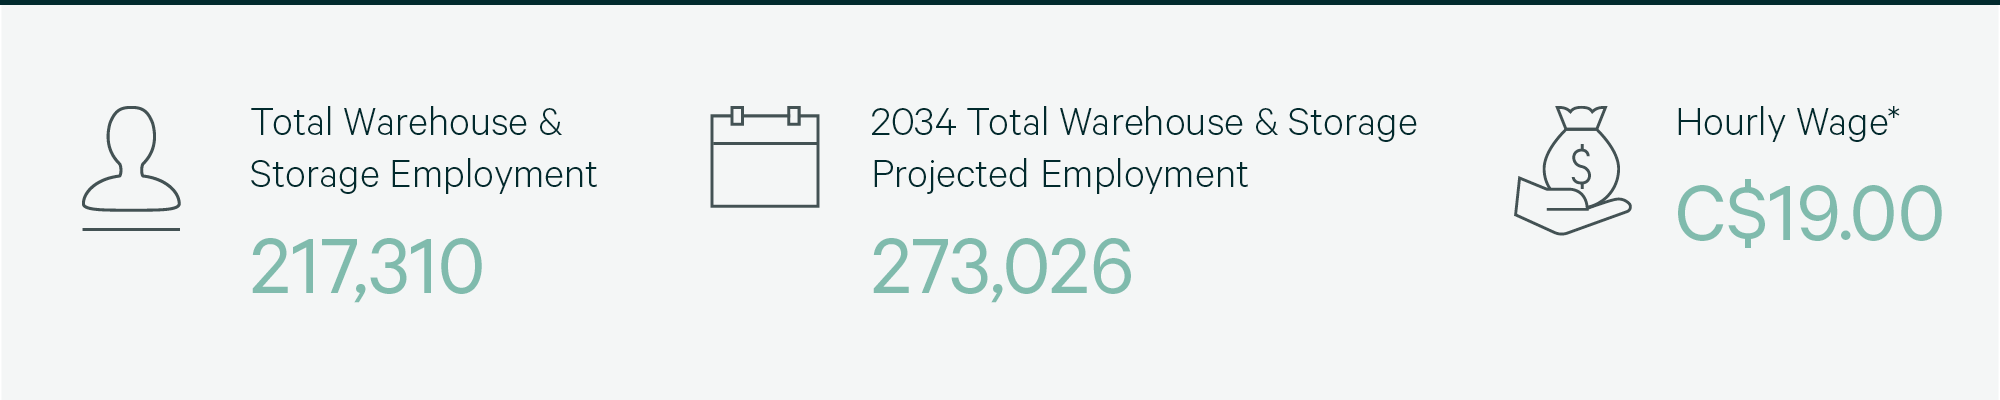
*Median Wage in Canadian Dollars; Warehouseperson occupation (NOC 7452).
Location Incentives
Over the past five years, there have been over 90 economic incentives deals for an average of $95,400 per new job in metro Toronto, according to fDi Intelligence.
CBRE’s Location Incentives Group reports that the extent, if any, of province and local incentives offerings for industrial projects in metro Toronto depends on the location and scope of the operation.
Figure 3: Toronto Top Incentive Programs
Note: The extent, if any, of state and local incentive offerings depends on location and scope of the operation.
Logistics Driver
Toronto has convenient access to seven major highways that connect to locations across Canada and U.S. border crossings. The market is served by both the Canadian National and Canadian Pacific railways, with intermodal rail yards in Brampton, Caledon, Milton and Vaughan.
Toronto Pearson International Airport processes more than 45% of Canada’s air cargo, serving 175 international destinations. The airport is at the center of the region’s rail and highway network, making cargo easy to ship to the region’s big-box facilities.

Toronto is Canada’s largest big-box market and North America’s seventh-largest. However, 2023 saw a dramatic rise in vacancy rates to 5.1%, up from 0.8% in 2022.
Supply & Demand
Toronto, with 277 million sq. ft. of total inventory, is Canada’s largest big-box market and North America’s seventh-largest. However, 2023 saw a dramatic rise in vacancy rates to 5.1%, up from 0.8% in 2022, driven by 3 million sq. ft. of negative net absorptions and 11.6 million sq. ft. of construction completions. Net absorption remained negative even with solid leasing performance that matched 2022’s 8.9 million sq. ft. A diverse group of occupiers was active in Toronto, with 3PLs leading at 42.9% and general retailers & wholesalers following at 33.3% of leasing.
An additional 8.8 million sq. ft. of industrial big-box space is currently under construction, with most set to complete in 2024. Given this development and the prevailing economic uncertainty in Canada, vacancy rates are expected to hold steady at their current levels over the coming quarters, potentially stabilizing rent growth in 2024.
Figure 4: Share of 2023 Leasing by Occupier Type
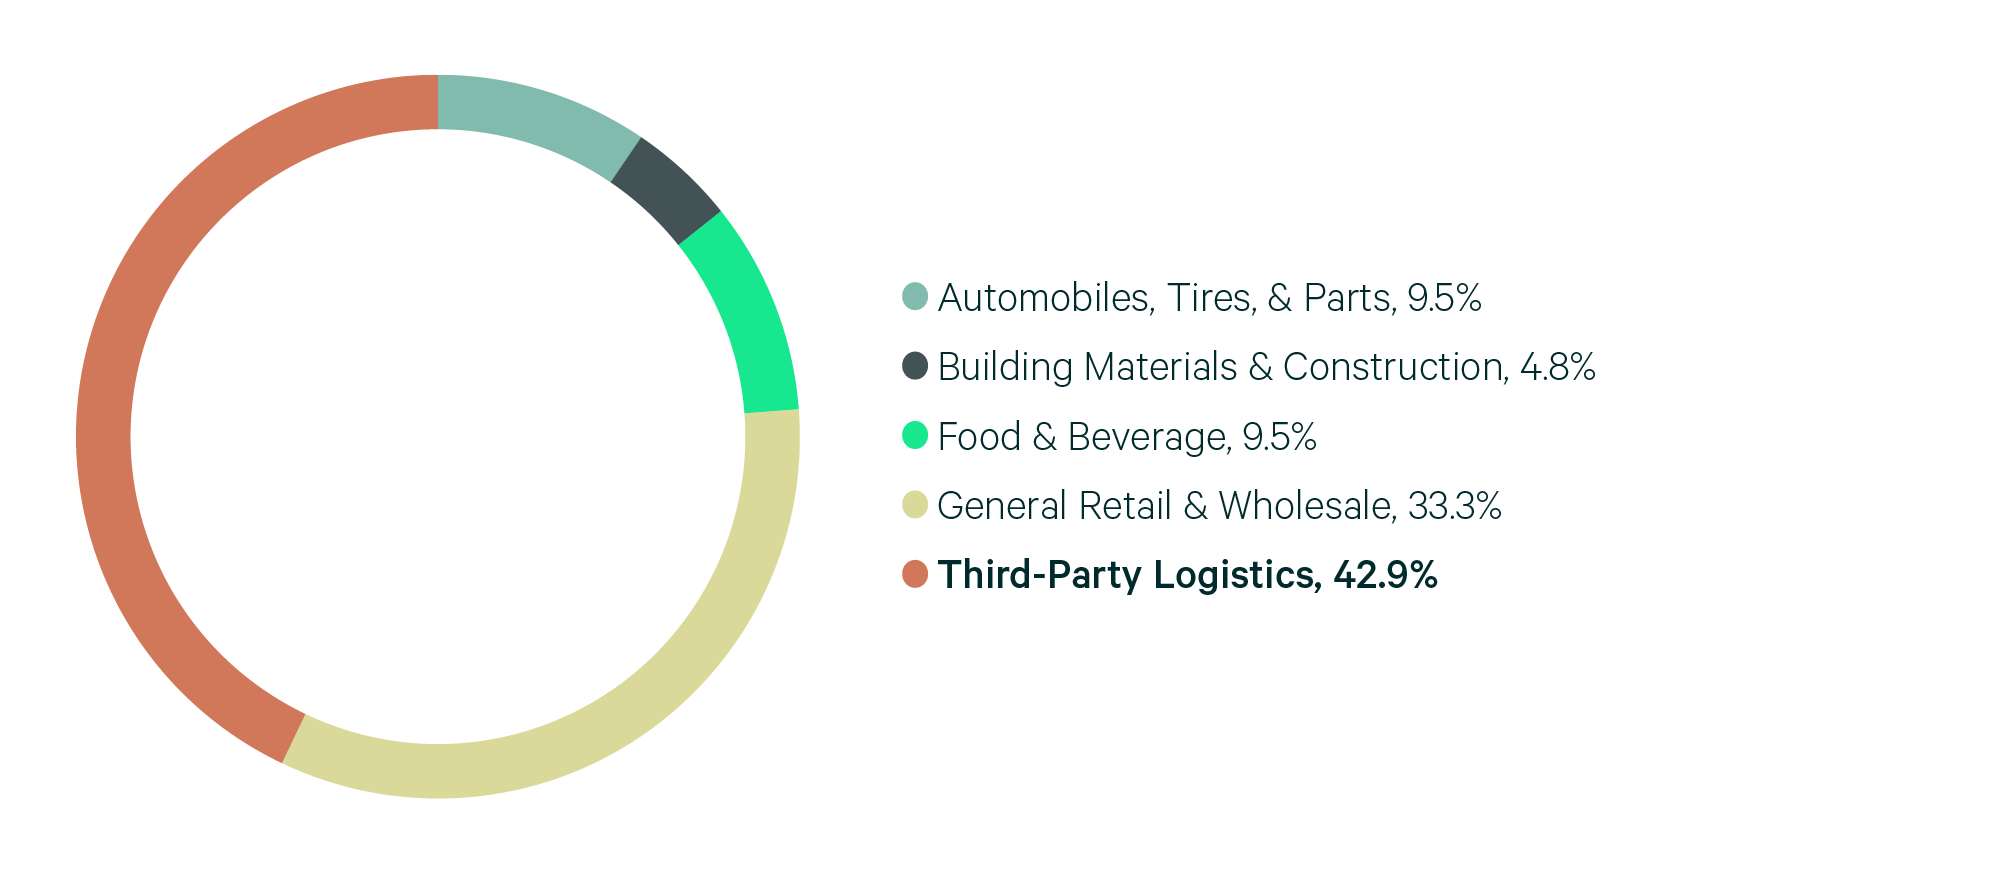
Source: CBRE Research.
Figure 5: Lease Transaction Volume by Size Range
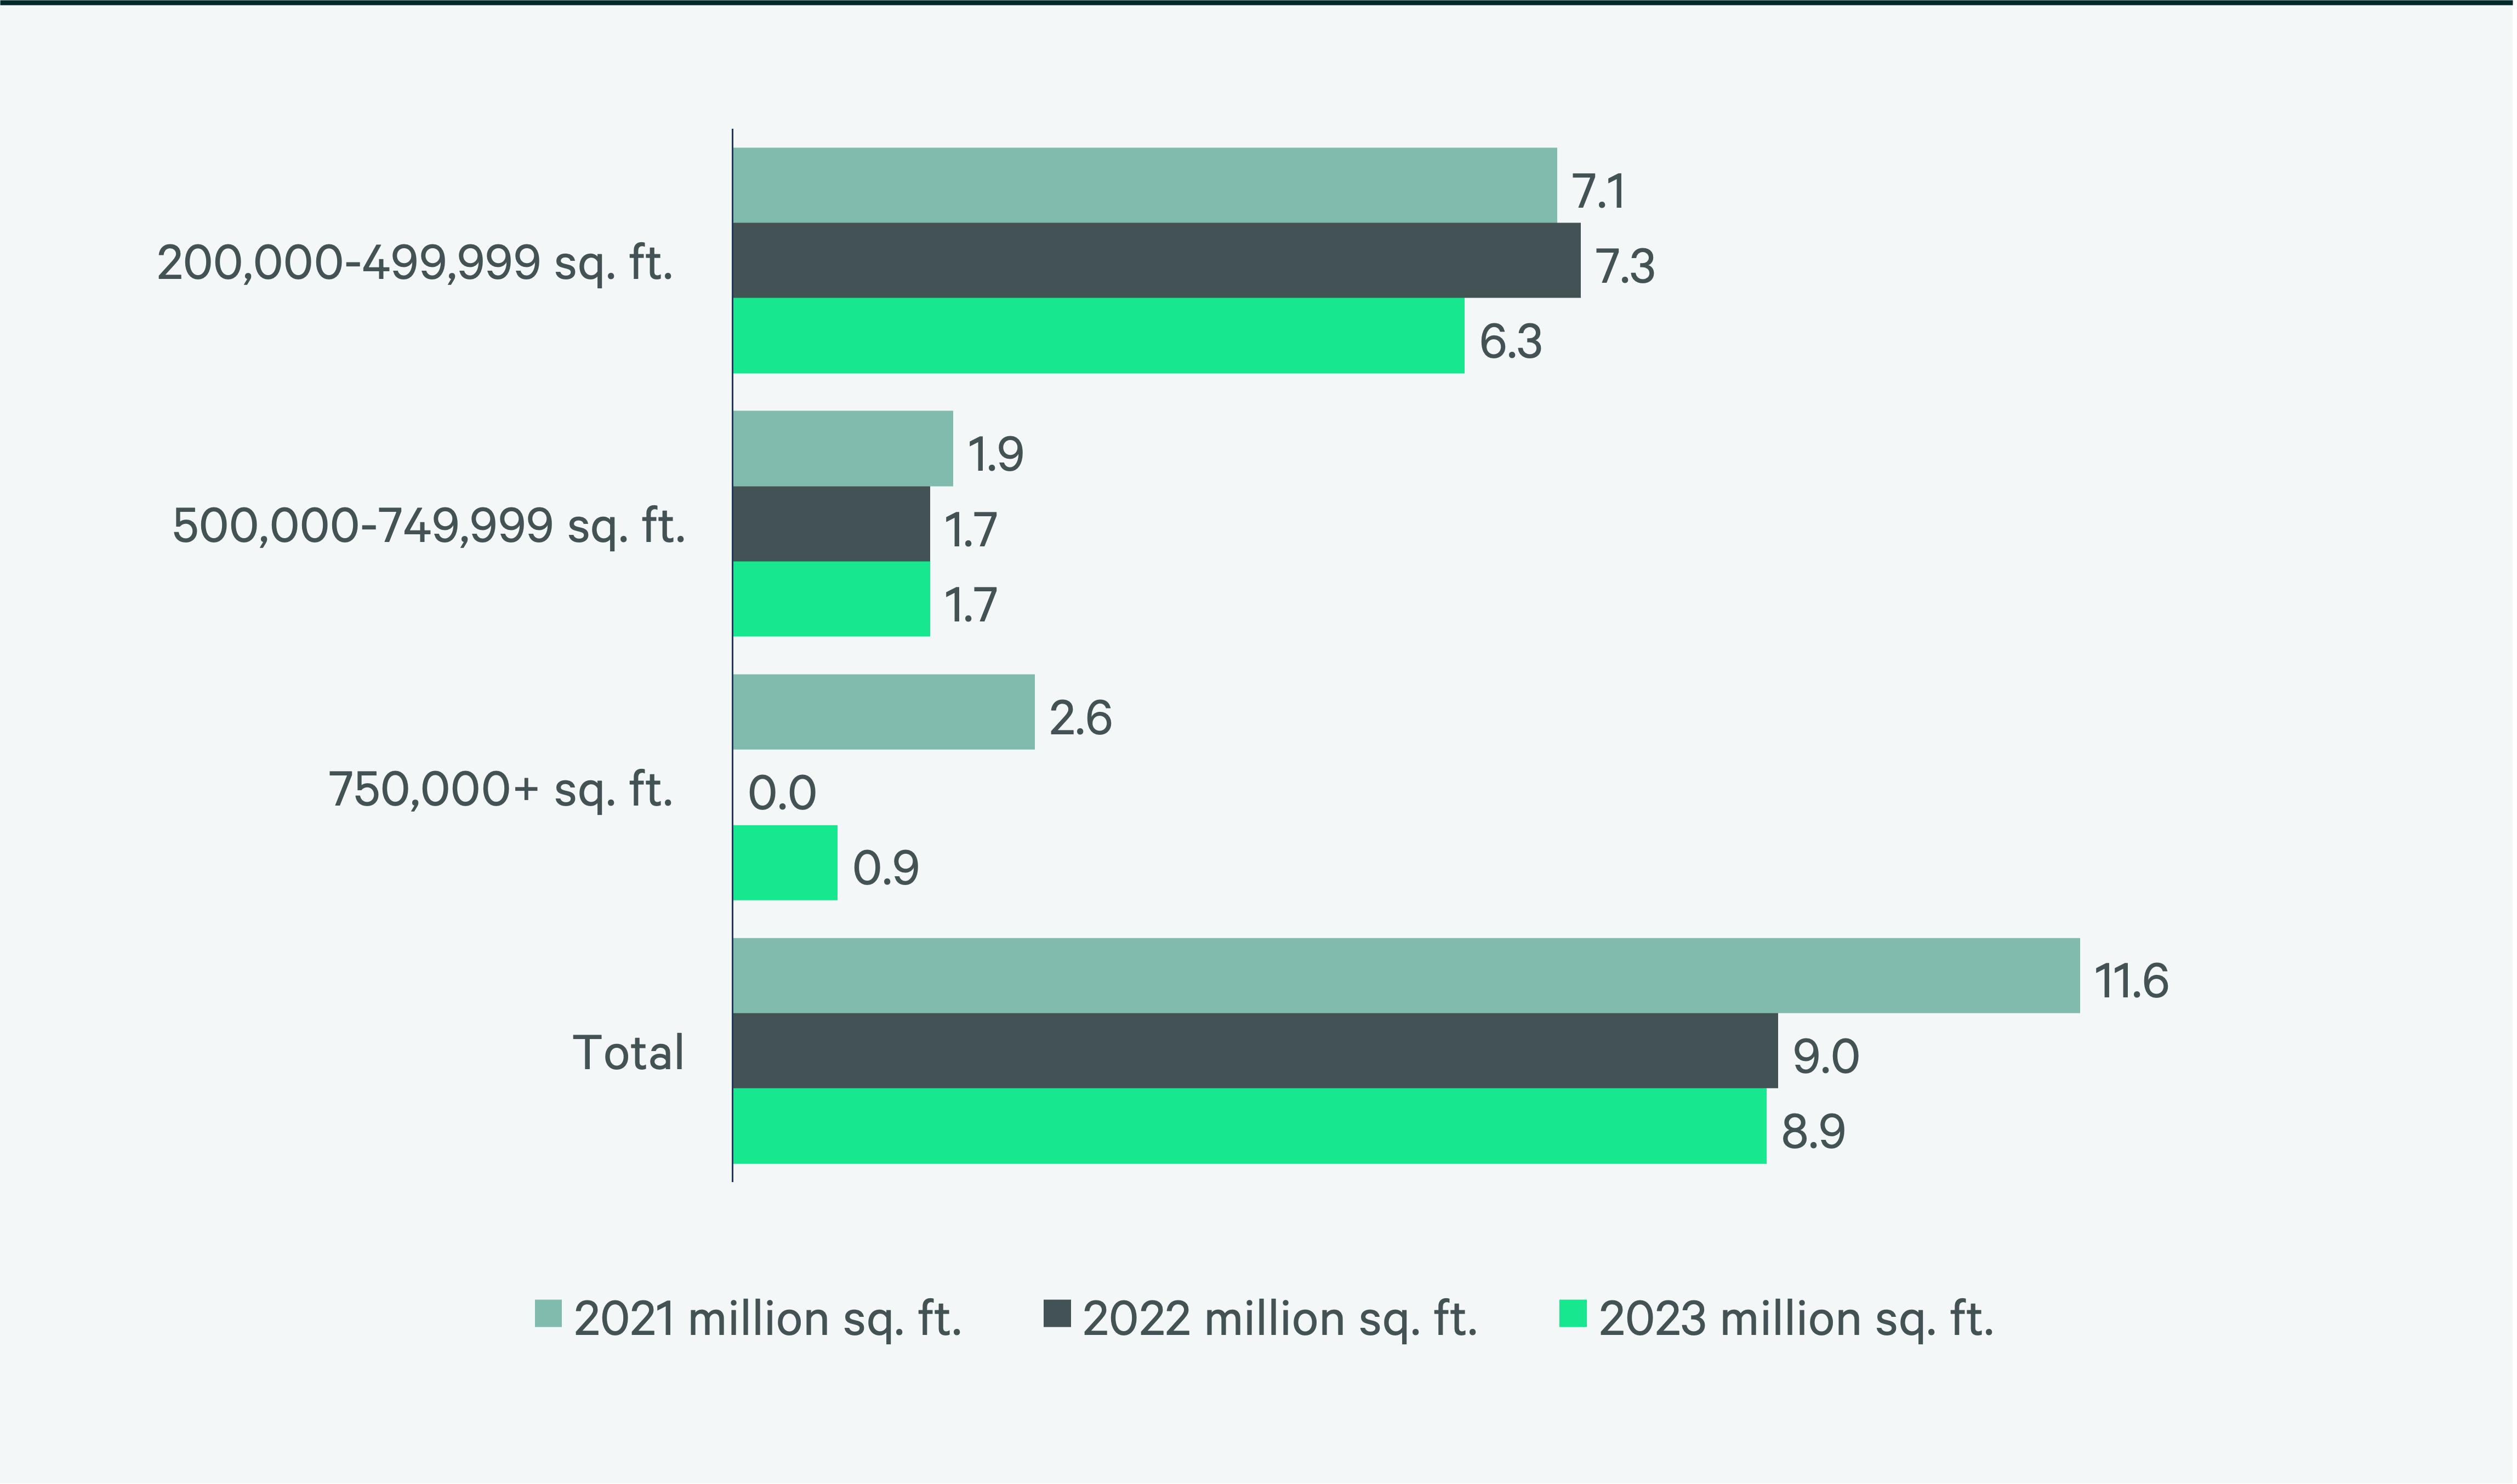
Source: CBRE Research.
Figure 6: 2023 Construction Completions vs. Overall Net Absorption by Size Range
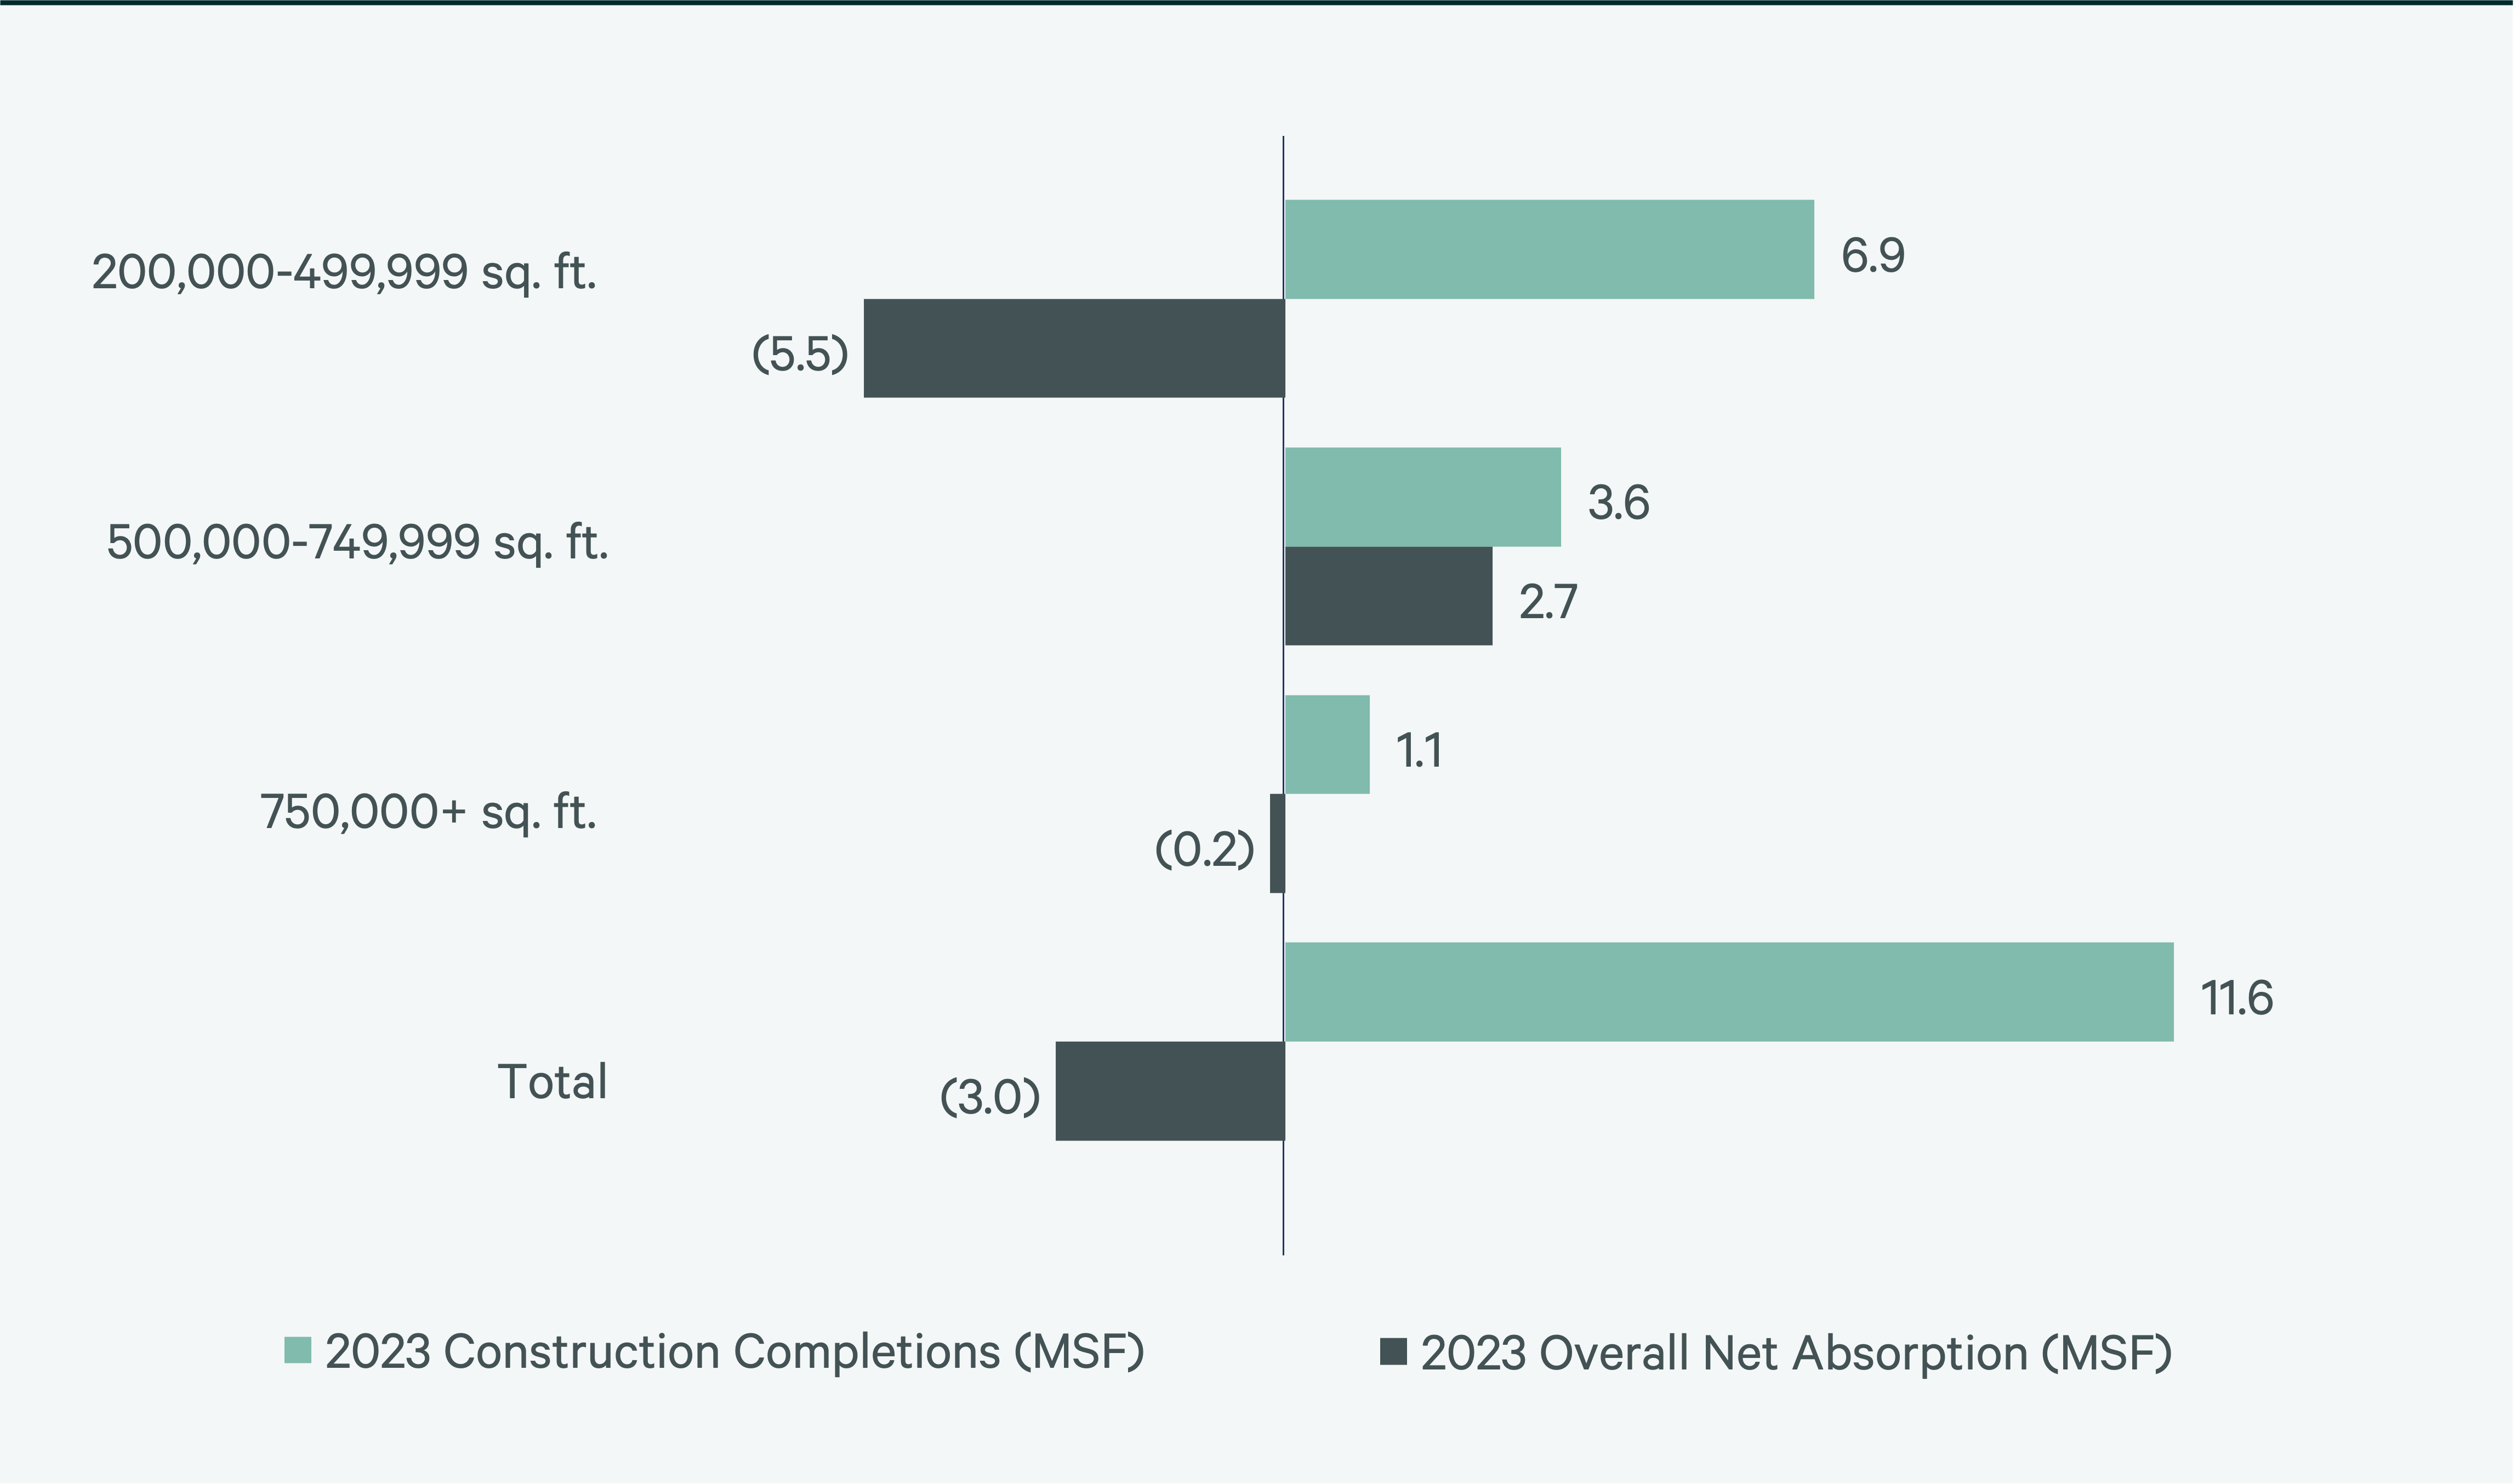
Figure 7: Direct Vacancy Rate by Size Range
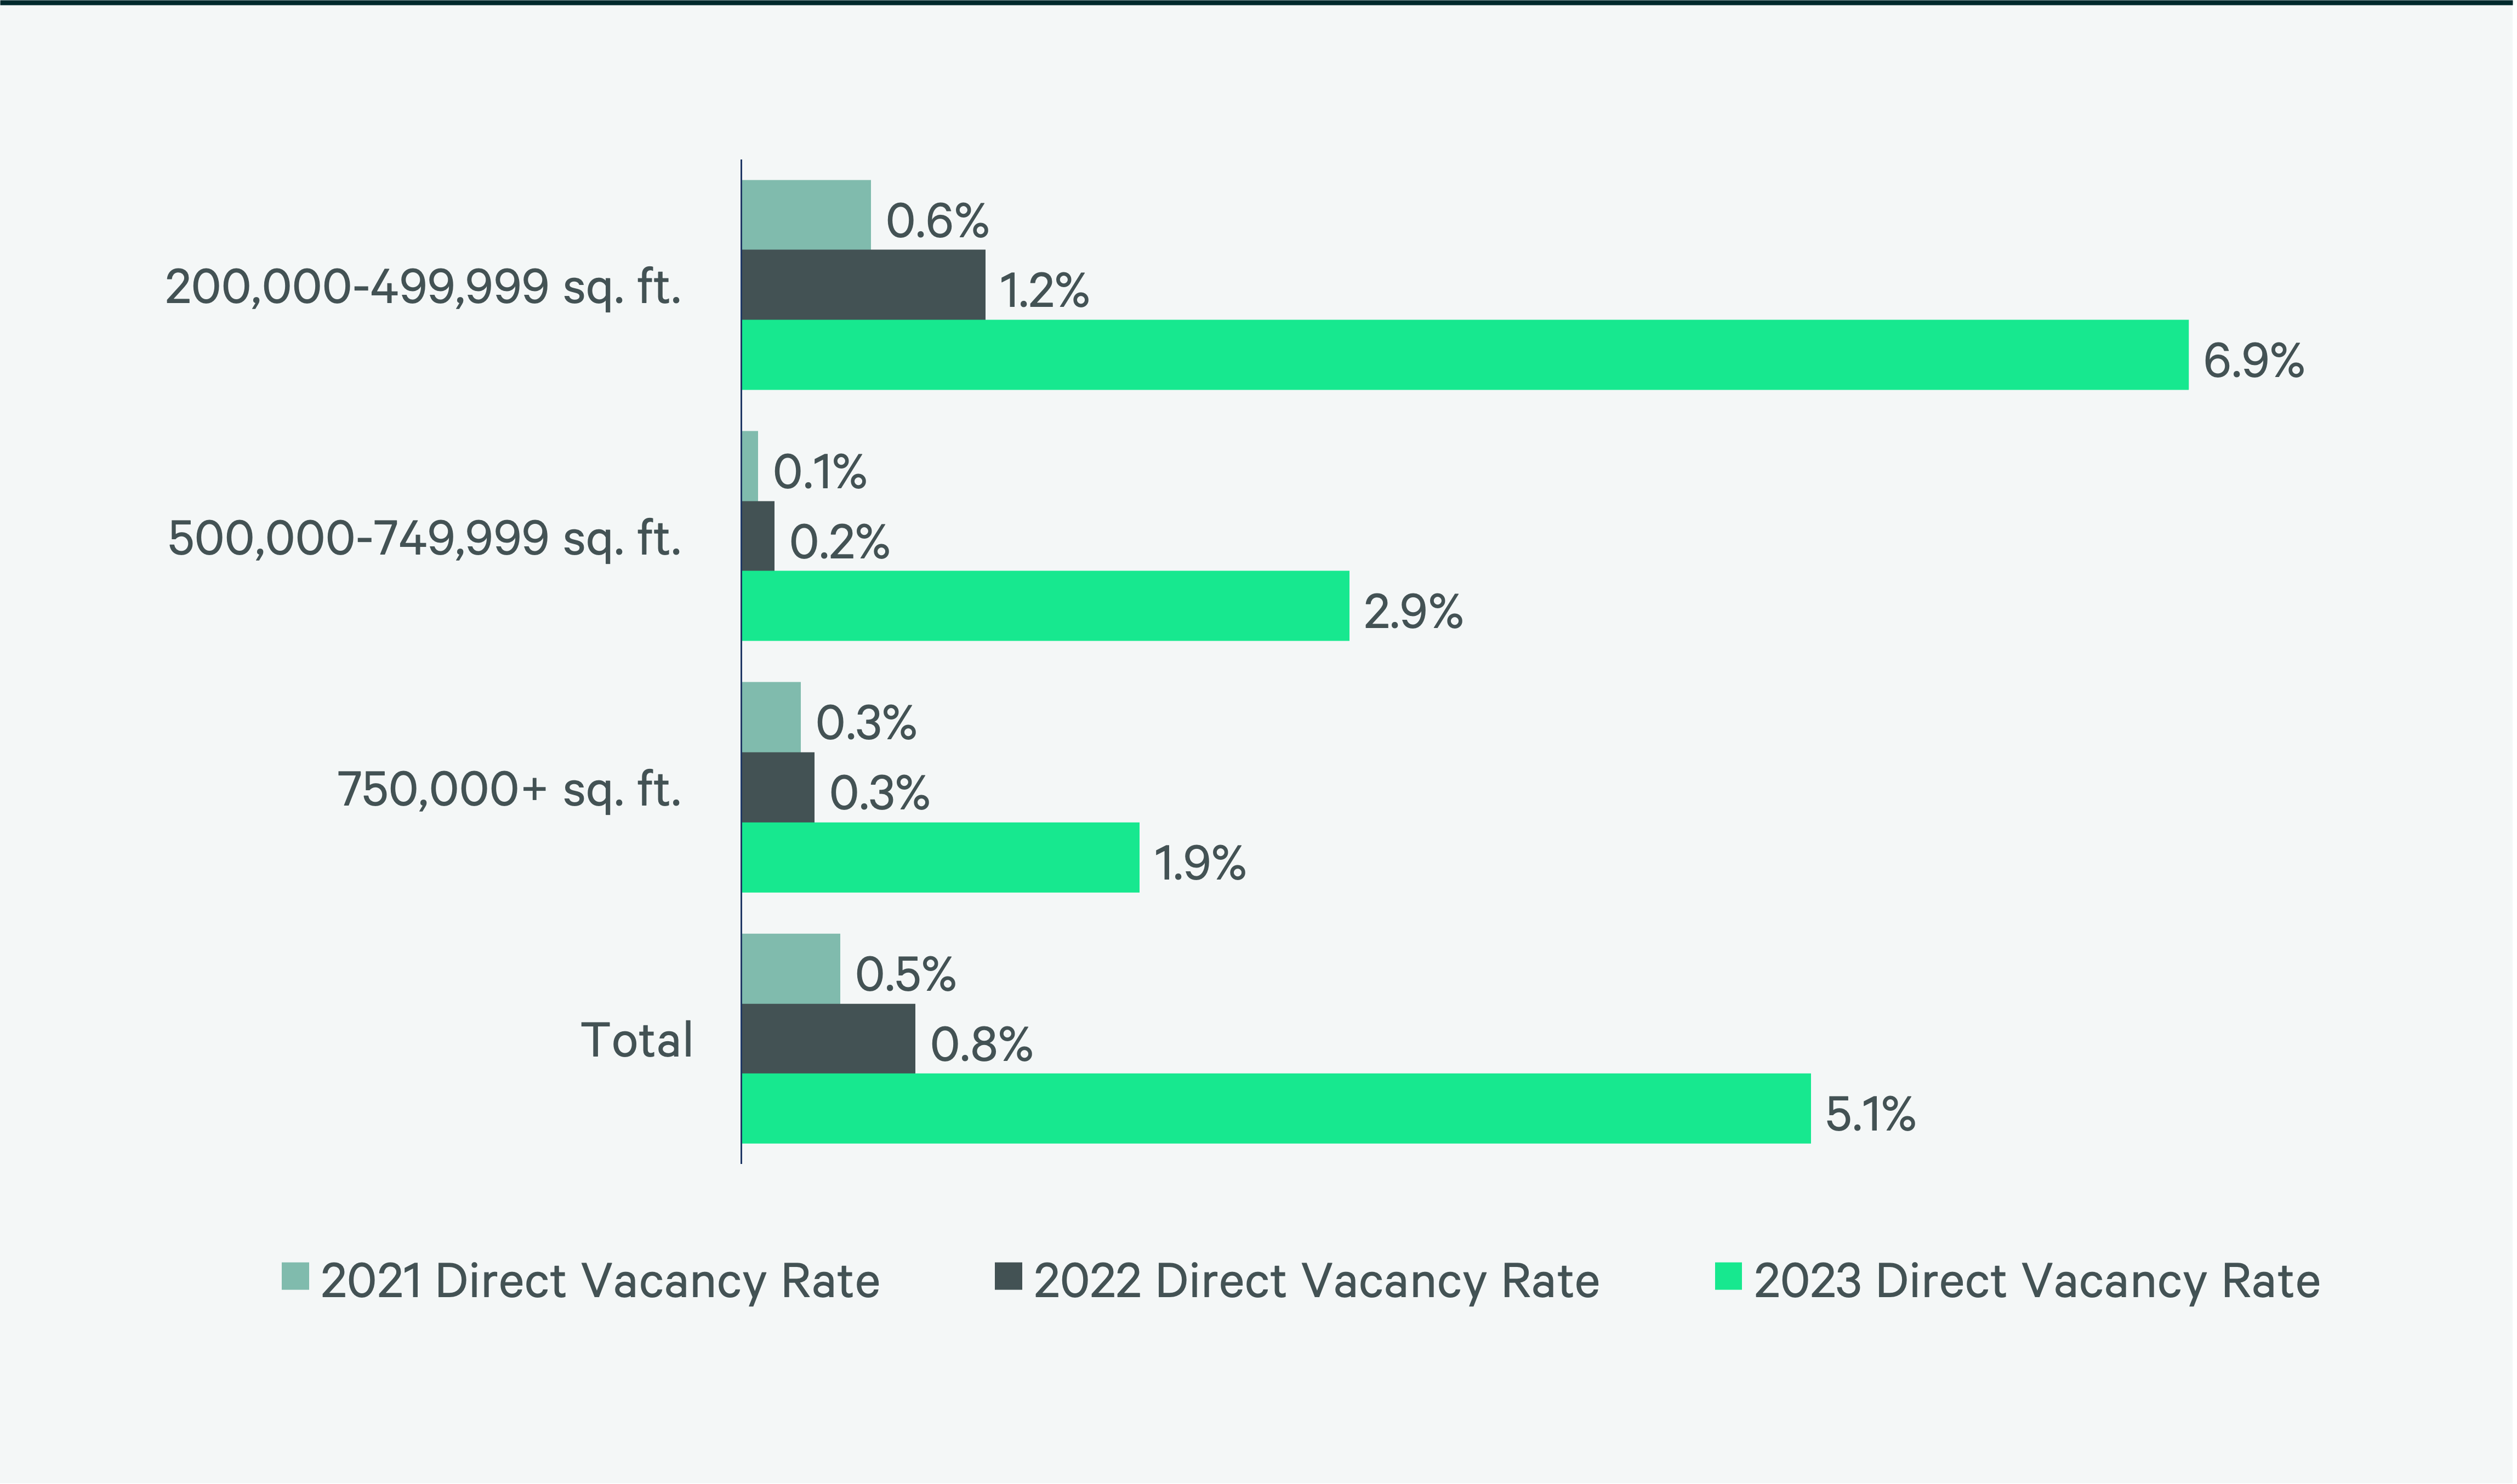
Figure 8: Under Construction & Percentage Preleased
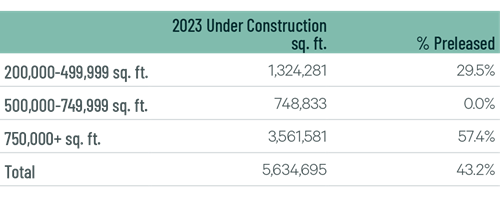
Figure 9: First Year Taking Rents (psf/yr)
Source: CBRE Research.
Explore Big-Box Insights by Market
-
Over 9 million people live within 50 miles of the market’s core, which is expected to decline by 0.7% by 2028.
-
More than 2.6 million people live within 50 miles of the market’s core, with a projected five-year growth rate of 1.8%.
-
More than 5 million people live within 50 miles of the market’s core, with an expected five-year growth rate of 5.9%.
Industrial & Logistics Research
James Breeze
Vice President, Global Industrial and Retail Research

John Morris
President, Americas Industrial & Logistics, Advisory Services