Future Cities
Chicago
2024 North America Industrial Big-Box Review & Outlook
April 29, 2024 5 Minute Read

Demographics
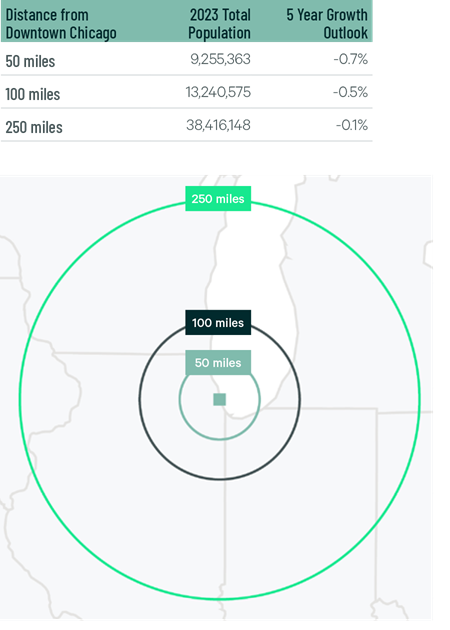
Over 9 million people live within 50 miles of the market’s core, which is expected to decline by 0.7% by 2028. Even with this decline, Chicago would still have North America’s sixth-largest 250-mile radius population by 2028.
Figure 1: Chicago Population Analysis
The local warehouse labor force of 270,323 is the second-largest in the U.S, according to CBRE Labor Analytics. The average wage for a non-supervisory warehouse worker is $20.22 per hour, 18.5% above the national average.
Figure 2: Chicago Warehouse & Storage Labor Fundamentals
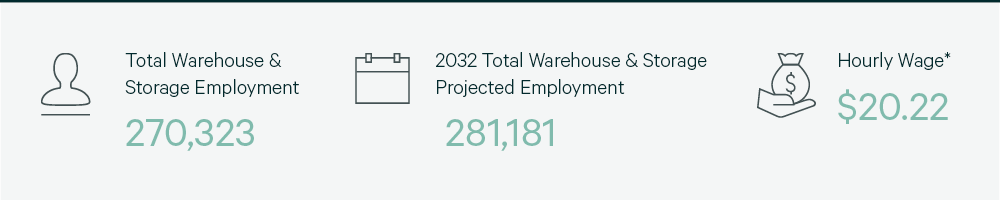
*Median wage (1 year experience); non-supervisory warehouse material handlers.
Location Incentives
Over the past five years, there have been more than 390 economic incentives deals totaling more than $990 million for an average of $32,500 per new job in metro Chicago, according to fDi Intelligence.
CBRE’s Location Incentives Group reports that top incentive programs in metro Chicago include the Economic Development for a Growing Economy Program (EDGE). It provides non-refundable discretionary corporate income tax credits for up to 10 years. These credits equal up to 50% of new income tax withholdings generated by a project’s new job creation. To qualify, companies with more than 100 employees worldwide must invest a minimum of $2.5 million and create new jobs equal to 10% of the company’s total employment. Companies with less than 100 employees worldwide must create new jobs equal to 5% of the company’s total employment.
Figure 3: Chicago Top Incentive Programs
Note: The extent, if any, of state and local incentive offerings depends on location and scope of the operation.
Logistics Driver
As a top U.S. rail hub, Chicago is home to seven Class 1 rail carriers. More than 1,300 freight, passenger and commuter trains pass through the region daily, according to the Journal of Commerce. Illinois has the third-most interstate routes and mileage. The two longest, I-90 and I-80, provide east and west access. Two key connections to the Gulf States, I-55 and I-65, end in the Chicago area. Add in I-57, I-64, I-70 and I-94 and an Illinois driver can reach almost every population center in the nation by using one interchange.
Chicago O’Hare International Airport is one of the world’s largest air cargo gateways. O’Hare processes just under 2 million metric tons of cargo per year, worth over $200 billion. Chicago Rockford International is one of the world’s fastest-growing cargo airports and offers another viable goods transportation option to the market.

More than 1,300 freight, passenger and commuter trains pass through the region daily, according to the Journal of Commerce.
Supply & Demand
With 619 million sq. ft. of total inventory, Chicago is North America’s largest industrial big-box market. Demand did not keep pace with the previous year, with lease volume falling to 29.5 million sq. ft. Despite the decline, it was the fourth-highest in North America. Lower lease volume led to a 23% decline in positive net absorption. This decline, coupled with a record-setting 33.7 million sq. ft. of construction completions, caused vacancy rates to rise to 5.8%, more than double the 2.5% seen in 2022. Despite higher vacancies, rents increased in all major size ranges, resulting in an overall 25.2% rise for firs-year taking rents compared to 2022.
In 2023, big-box developers in Chicago struggled to initiate new projects due to difficulties in construction financing, resulting in a 53% reduction in space under construction. Nearly 50% of this space is preleased, indicating that available first-generation space will decrease this year. This reduction is expected to help stabilize vacancy rates and support continued rent growth in the coming quarters.
Figure 4: Share of 2023 Leasing by Occupier Type
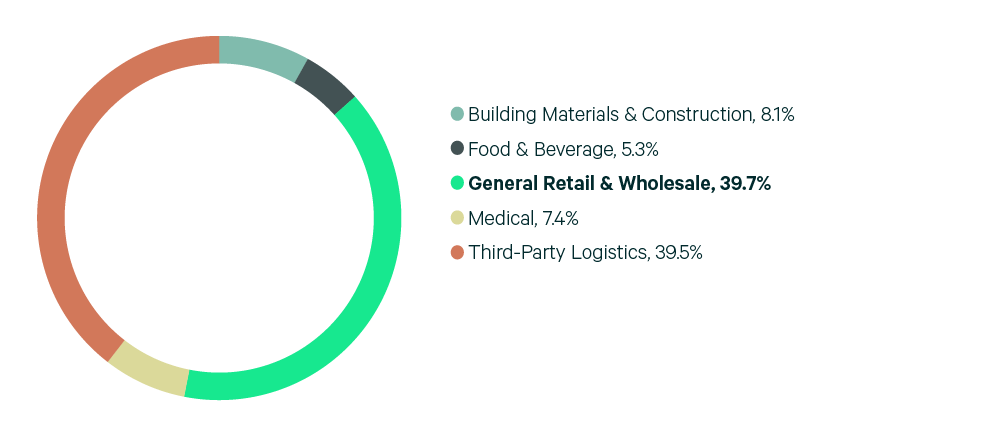
Source: CBRE Research.
Figure 5: Lease Transaction Volume by Size Range
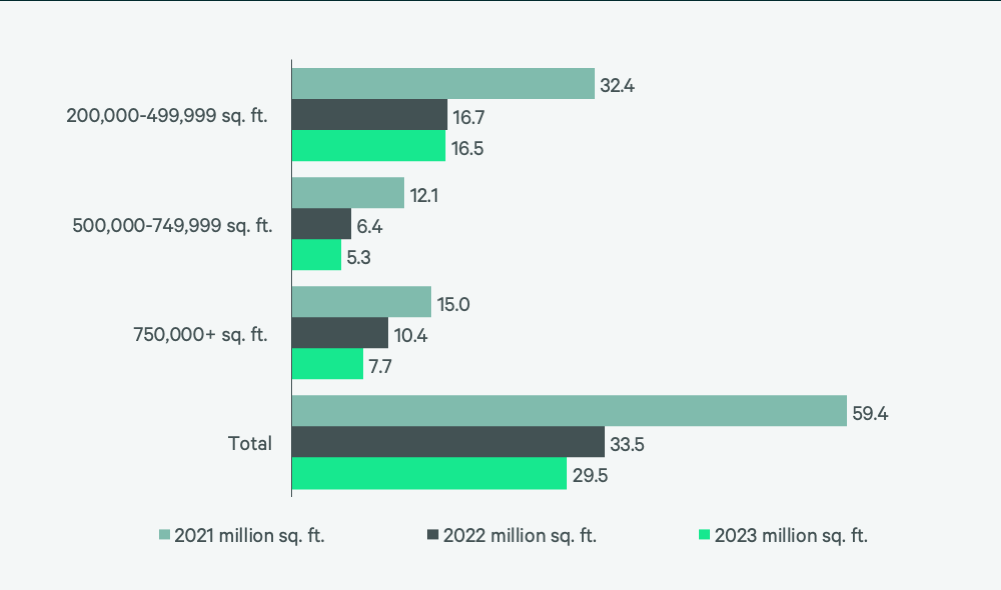
Source: CBRE Research.
Figure 6: 2023 Construction Completions vs. Overall Net Absorption by Size Range
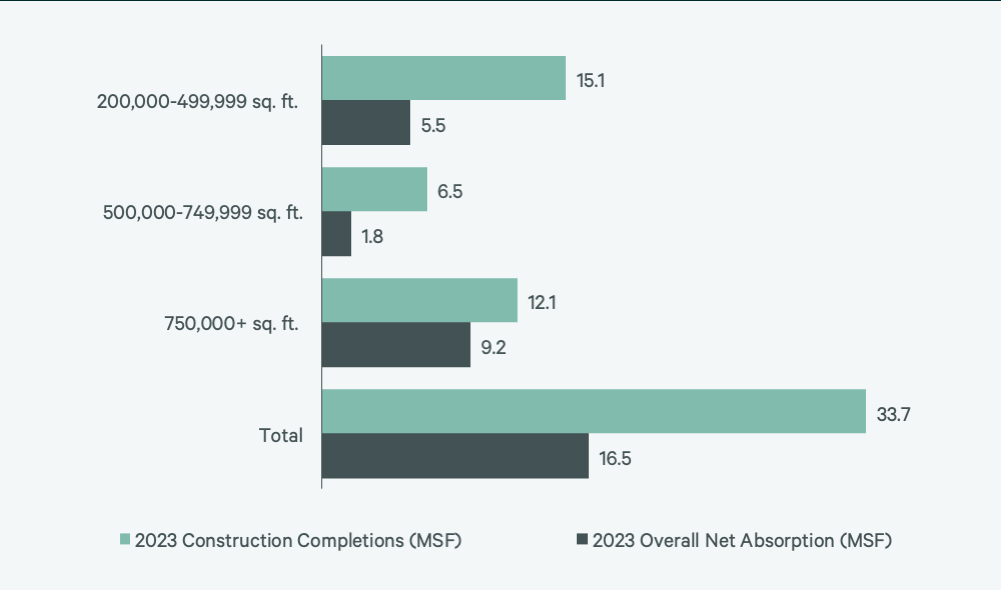
Figure 7: Direct Vacancy Rate by Size Range
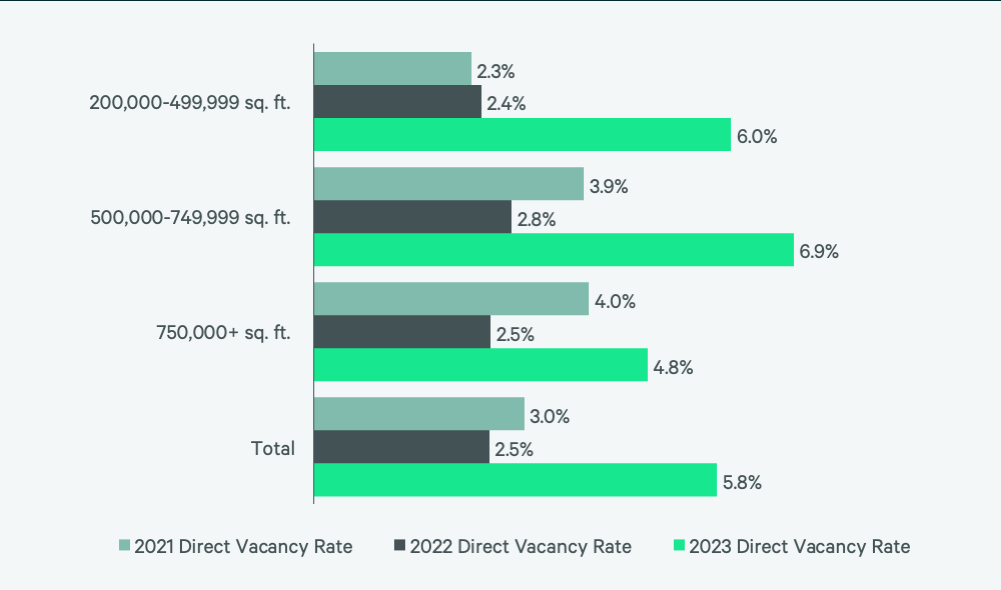
Figure 8: Under Construction & Percentage Preleased
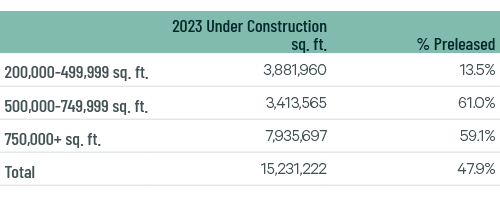
Figure 9: First Year Taking Rents (psf/yr)
Source: CBRE Research.
Explore Big-Box Insights by Market
-

More than 2.6 million people live within 50 miles of the market’s core, with a projected five-year growth rate of 1.8%.
-

Over 2.6 million people live within 50 miles of the market’s core, with a 1.9% expected five-year growth rate.
-

Nearly 3 million people live within 50 miles of the market’s core but, like many Midwest markets, this is expected to decline by 0.2% over the next five years.
Industrial & Logistics Research
James Breeze
Vice President, Global Industrial and Retail Research

John Morris
President, Americas Industrial & Logistics, Advisory Services