Future Cities
Columbus
2024 North America Industrial Big-Box Review & Outlook
April 29, 2024 5 Minute Read

Demographics
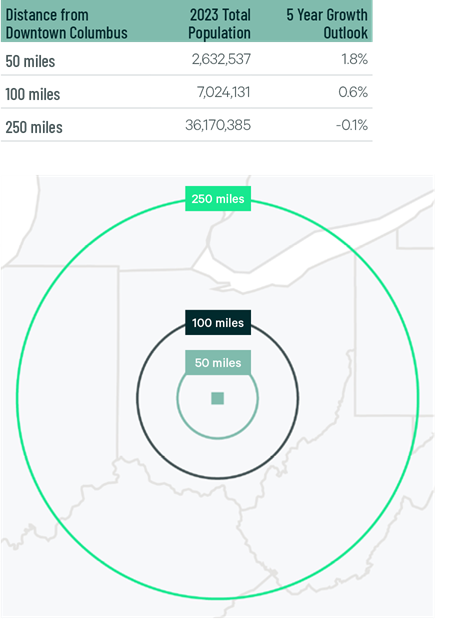
More than 2.6 million people live within 50 miles of the market’s core, with a projected five-year growth rate of 1.8%. Home to one of the U.S.’s largest public universities, nearly 25% of the city’s 50-mile-radius population is aged 18-34. The market can reach just over 36 million people within 250 miles, more than Dallas-Ft. Worth, Atlanta or the Inland Empire.
Figure 1: Columbus Population Analysis
The region’s warehouse labor force totals 54,480, according to CBRE Labor Analytics. The average wage for a non-supervisory warehouse worker is $18.49 per hour, 4.2% above the national average.
Figure 2: Columbus Warehouse & Storage Labor Fundamentals
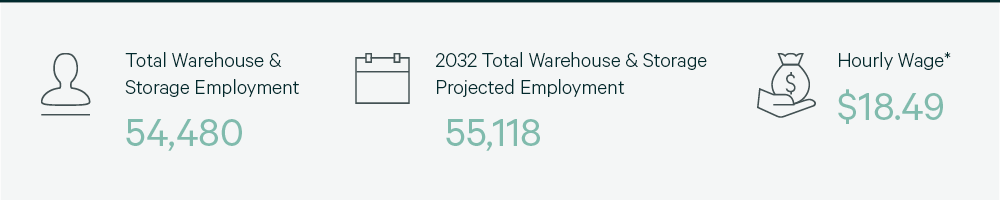
*Median wage (1 year experience); non-supervisory warehouse material handlers.
Location Incentives
Over the past five years, there have been over 250 economic incentives deals for an average of $20,800 per new job in metro Columbus, according to fDi Intelligence.
CBRE’s Location Incentives Group reports that top incentive programs offered in metro Columbus include the Job Creation Tax Credit (JCTC) program. It provides a refundable, performance-based tax credit calculated as a percentage of created payroll and applied toward a company’s commercial activity tax liability. JCTC was designed to incentivize companies considering doing business elsewhere.
Another program is the Economic Development Grant. This discretionary cash grant intended to promote job creation and business expansion. It is typically awarded based on companies’ fixed-asset and infrastructure investments, as well as substantial job creation.
Figure 3: Columbus Top Incentive Programs
Note: The extent, if any, of state and local incentive offerings depends on location and scope of the operation.
Logistics Driver
The Rickenbacker Inland Port is one of the country’s fastest growing inland ports and the epicenter of Columbus air, rail and ground transportation. Rickenbacker International is one of the world’s only cargo-dedicated airports, with direct flights to Europe, Asia and the Middle East. Norfolk Southern and CSX have rail hubs within the port, providing direct rail access to major East Coast seaports. I-70 passes through Columbus, providing direct highway access to a large part of the U.S. population.

Over the past five years, there have been over 250 economic incentives deals for an average of $20,800 per new job in metro Columbus, according to fDi Intelligence.
Supply & Demand
In 2023, 10.8 million sq. ft. was leased–27% below 2022 and nearly half of 2021. Vacancy rates rose to 7.4% due to lower transaction volume and a record 16.2 million sq. ft. of construction completions, the second consecutive year that completions topped 10 million sq. ft. A diverse set of occupiers expanded into or renewed in Columbus, led by 3PLs at 38% and general retailers & wholesalers at 33.7%. Despite lower leasing and higher vacancies, taking rents increased by 18.6% year-over-year.
Higher vacancies and challenges in construction financing markets have significantly reduced the space under construction to 4.7 million sq. ft., almost half of which is preleased. The decline in available new construction this year will give the market time to absorb available space. This will stabilize and eventually lead to vacancy reductions and protection from major drops in rental rates.
Figure 4: Share of 2023 Leasing by Occupier Type
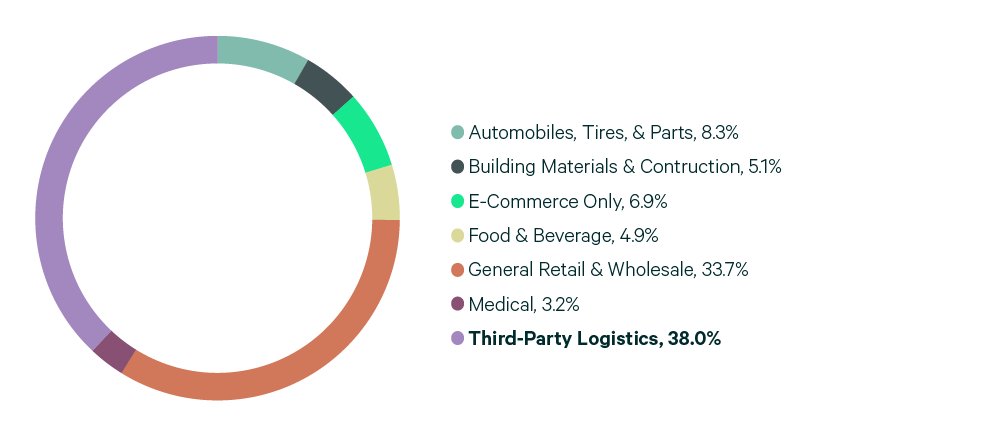
Source: CBRE Research.
Figure 5: Lease Transaction Volume by Size Range
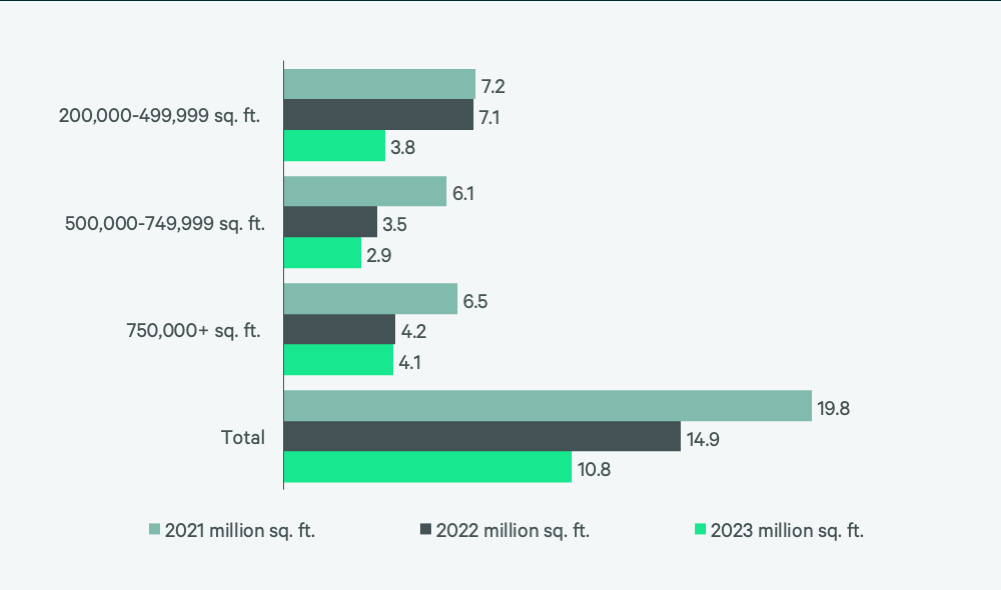
Source: CBRE Research.
Figure 6: 2023 Construction Completions vs. Overall Net Absorption by Size Range
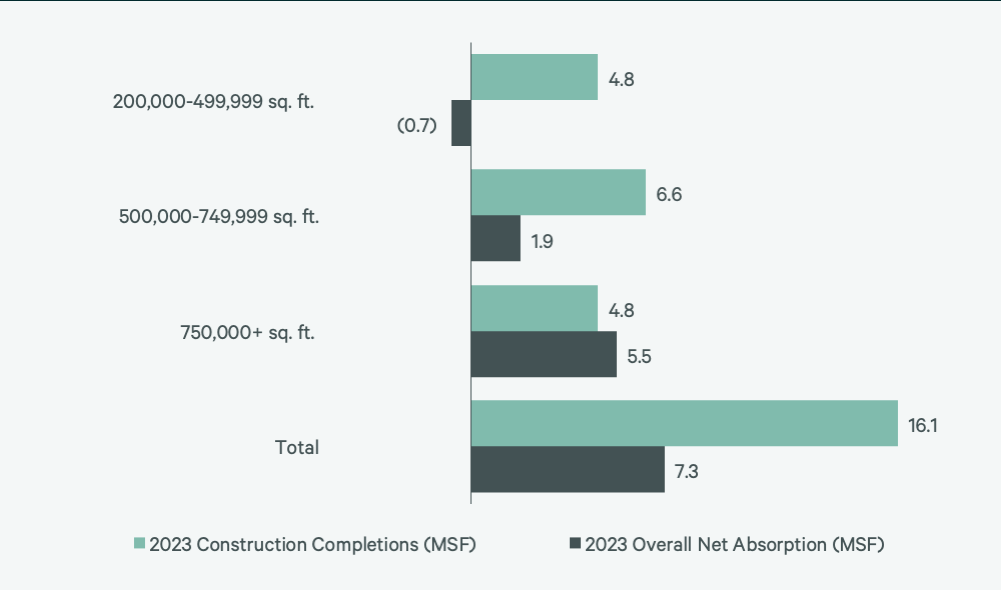
Figure 7: Direct Vacancy Rate by Size Range
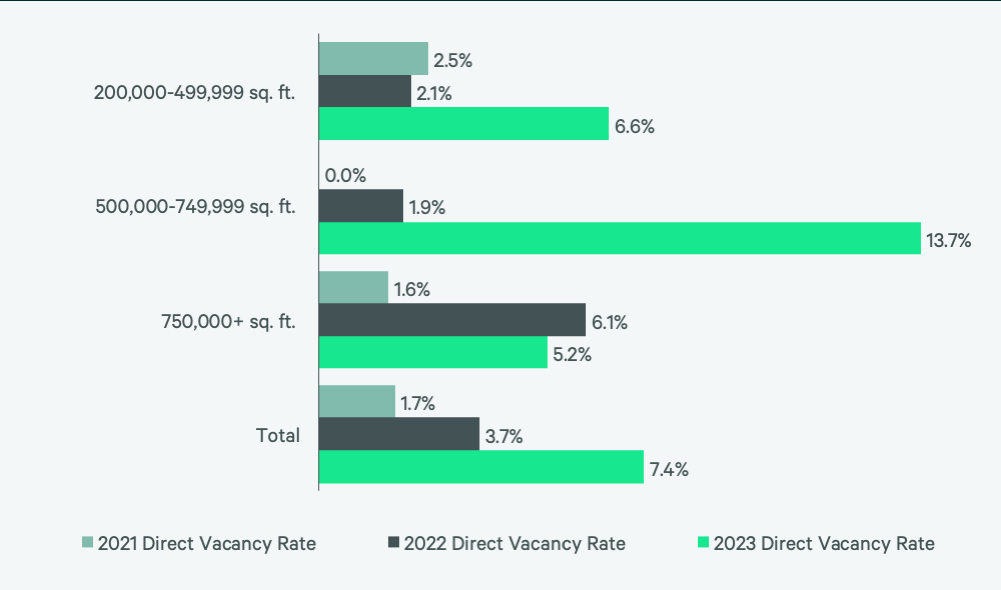
Figure 8: Under Construction & Percentage Preleased
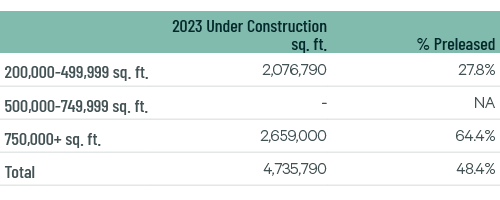
Figure 9: First Year Taking Rents (psf/yr)
Source: CBRE Research.
Explore Big-Box Insights by Market
-

Cincinnati’s central location makes it ideal for big-box occupiers.
-

Over 2.6 million people live within 50 miles of the market’s core, with a 1.9% expected five-year growth rate.
-

Nearly 30 million people—24% aged 18-34—live within 250 miles of downtown Louisville.
Industrial & Logistics Research
James Breeze
Vice President, Global Industrial and Retail Research

John Morris
President, Americas Industrial & Logistics, Advisory Services