Future Cities
Montreal
2024 North America Industrial Big-Box Review & Outlook
April 29, 2024 5 Minute Read

Demographics
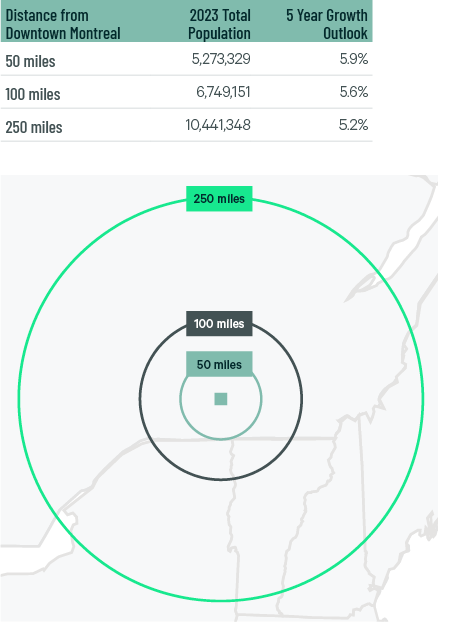
More than 5 million people live within 50 miles of the market’s core, with an expected five-year growth rate of 5.9%. More than 10 million people live within 250 miles, with a projected growth rate of 5.2% by 2028.
Figure 1: Montreal Population Analysis
The local warehouse labor force of over 129,360 is expected to grow by 11.4% by 2034, according to CBRE Labor Analytics. The average wage of a non-supervisory warehouse worker is C$19.00 (USD $14.11), tied with Toronto as the second-lowest of any market in this report.
Figure 2: Montreal Warehouse & Storage Labor Fundamentals
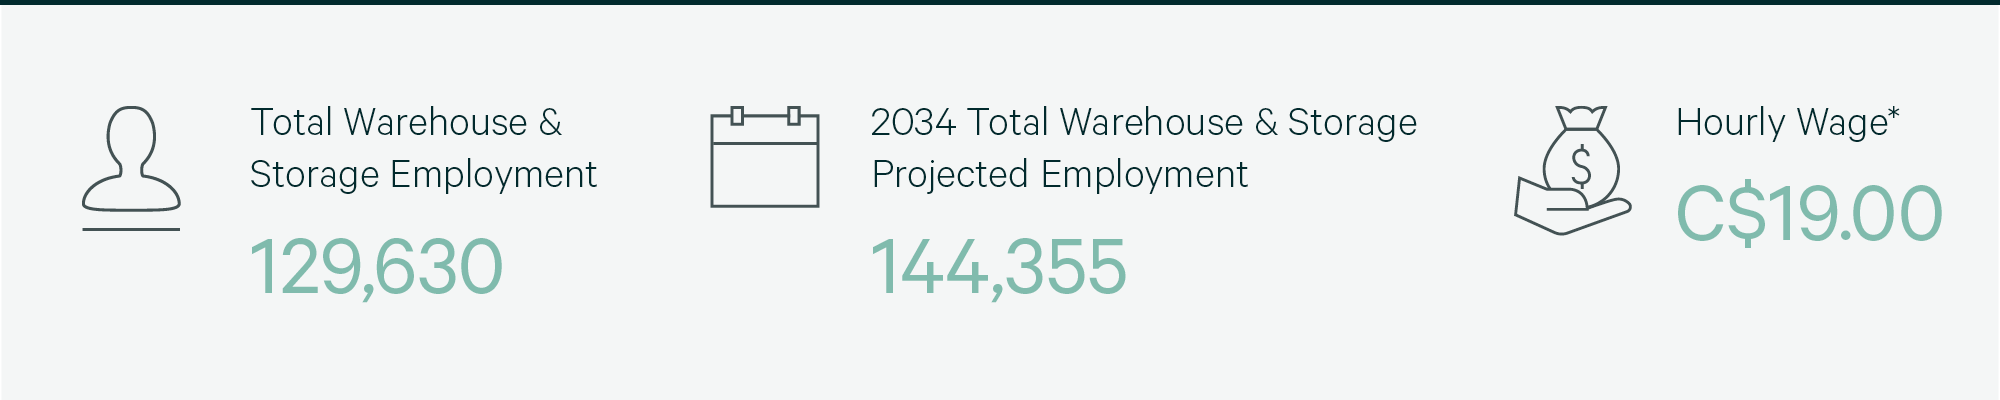
*Median Wage in Canadian Dollars; Warehouseperson occupation (NOC 7452).
Location Incentives
Over the past five years, there have been over 50 economic incentives deals for an average of $97,400 per new job in metro Montreal, according to fDi Intelligence.
CBRE’s Location Incentives Group reports that the extent, if any, of province and local incentives offerings for industrial projects in metro Montreal depends on location and scope of the operation.
Figure 3: Montreal City Top Incentive Programs
Note: The extent, if any, of state and local incentive offerings depends on location and scope of the operation.
Logistics Driver
The Port of Montreal provides the market with a direct route to the Atlantic Ocean via the St. Lawrence River. This international year-round port handles cargo from over 100 markets in Europe, central Canada, and the U.S.’s Midwest and Northeast. The port processes over 18 million metric tons of cargo annually, and provides the shortest route between North America and Europe. With its own rail line connecting to Canada's two largest railroads, Canadian National and Canadian Pacific, the port provides direct logistical access throughout North America.
Originating in Montreal, the St. Lawrence Seaway provides sea-bearing container ships from the Atlantic Ocean access to Lake Ontario and the upper Great Lakes. This series of locks, canals and channels extends from Montreal to Lake Erie. A series of approximately 40 on/off ramps along the way provide ample connectivity to the highways and railways of North America.

The Port of Montreal processes over 18 million metric tons of cargo annually, and provides the shortest route between North America and Europe.
Supply & Demand
With 80.1 million sq. ft. of total inventory, Montreal is Canada’s second-largest big-box market. Like Toronto, the market is land-constrained and has a vacancy rate of 3.9%, the fifth-lowest of any market in this report. Lease transaction volume was light in 2023, as only a few big-box operators signed deals. The decrease in leasing reduced net absorption to just 370,656 sq. ft. The small of product that was leased garnered much higher rents than the previous year at $16.52 CAD per square foot/per year, 16.8% higher than 2022.
Occupiers focused on supply chain resiliency will help bolster demand this year. With only 2.3 million sq. ft. under construction, vacancy rates will stay under 4% this year, further pressuring taking rents in the upcoming quarters.
Figure 4: Share of 2023 Leasing by Occupier Type
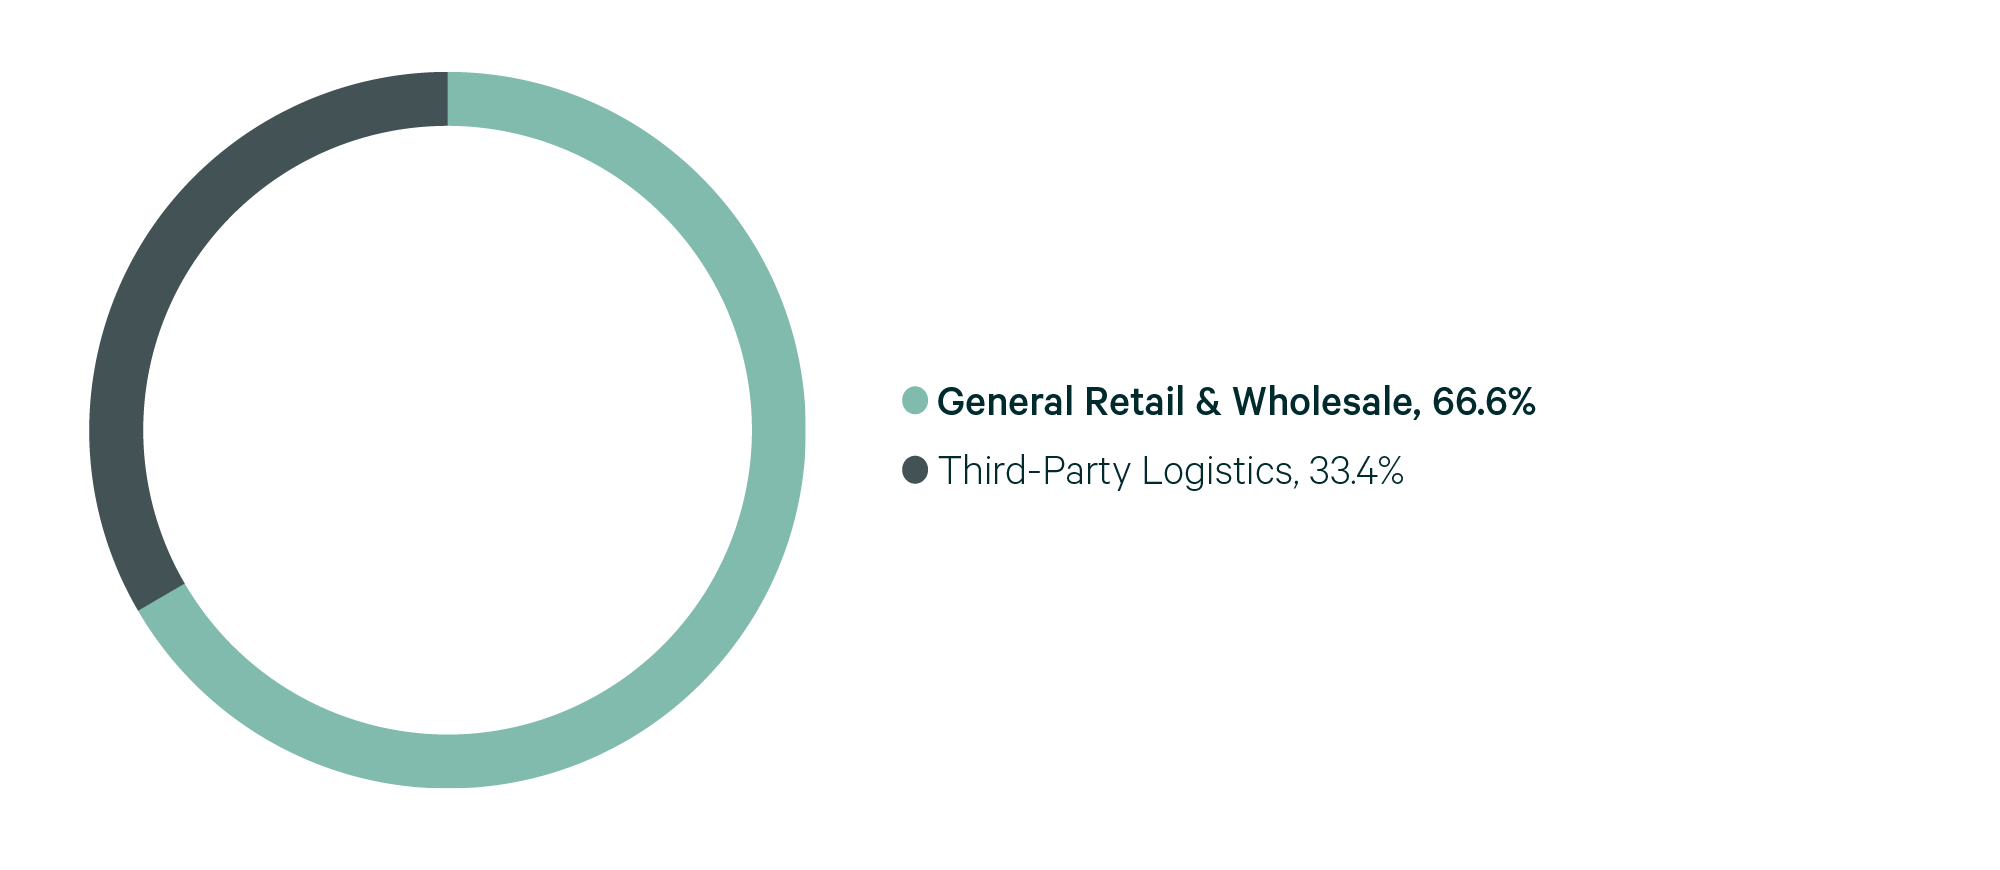
Source: CBRE Research.
Figure 5: Lease Transaction Volume by Size Range
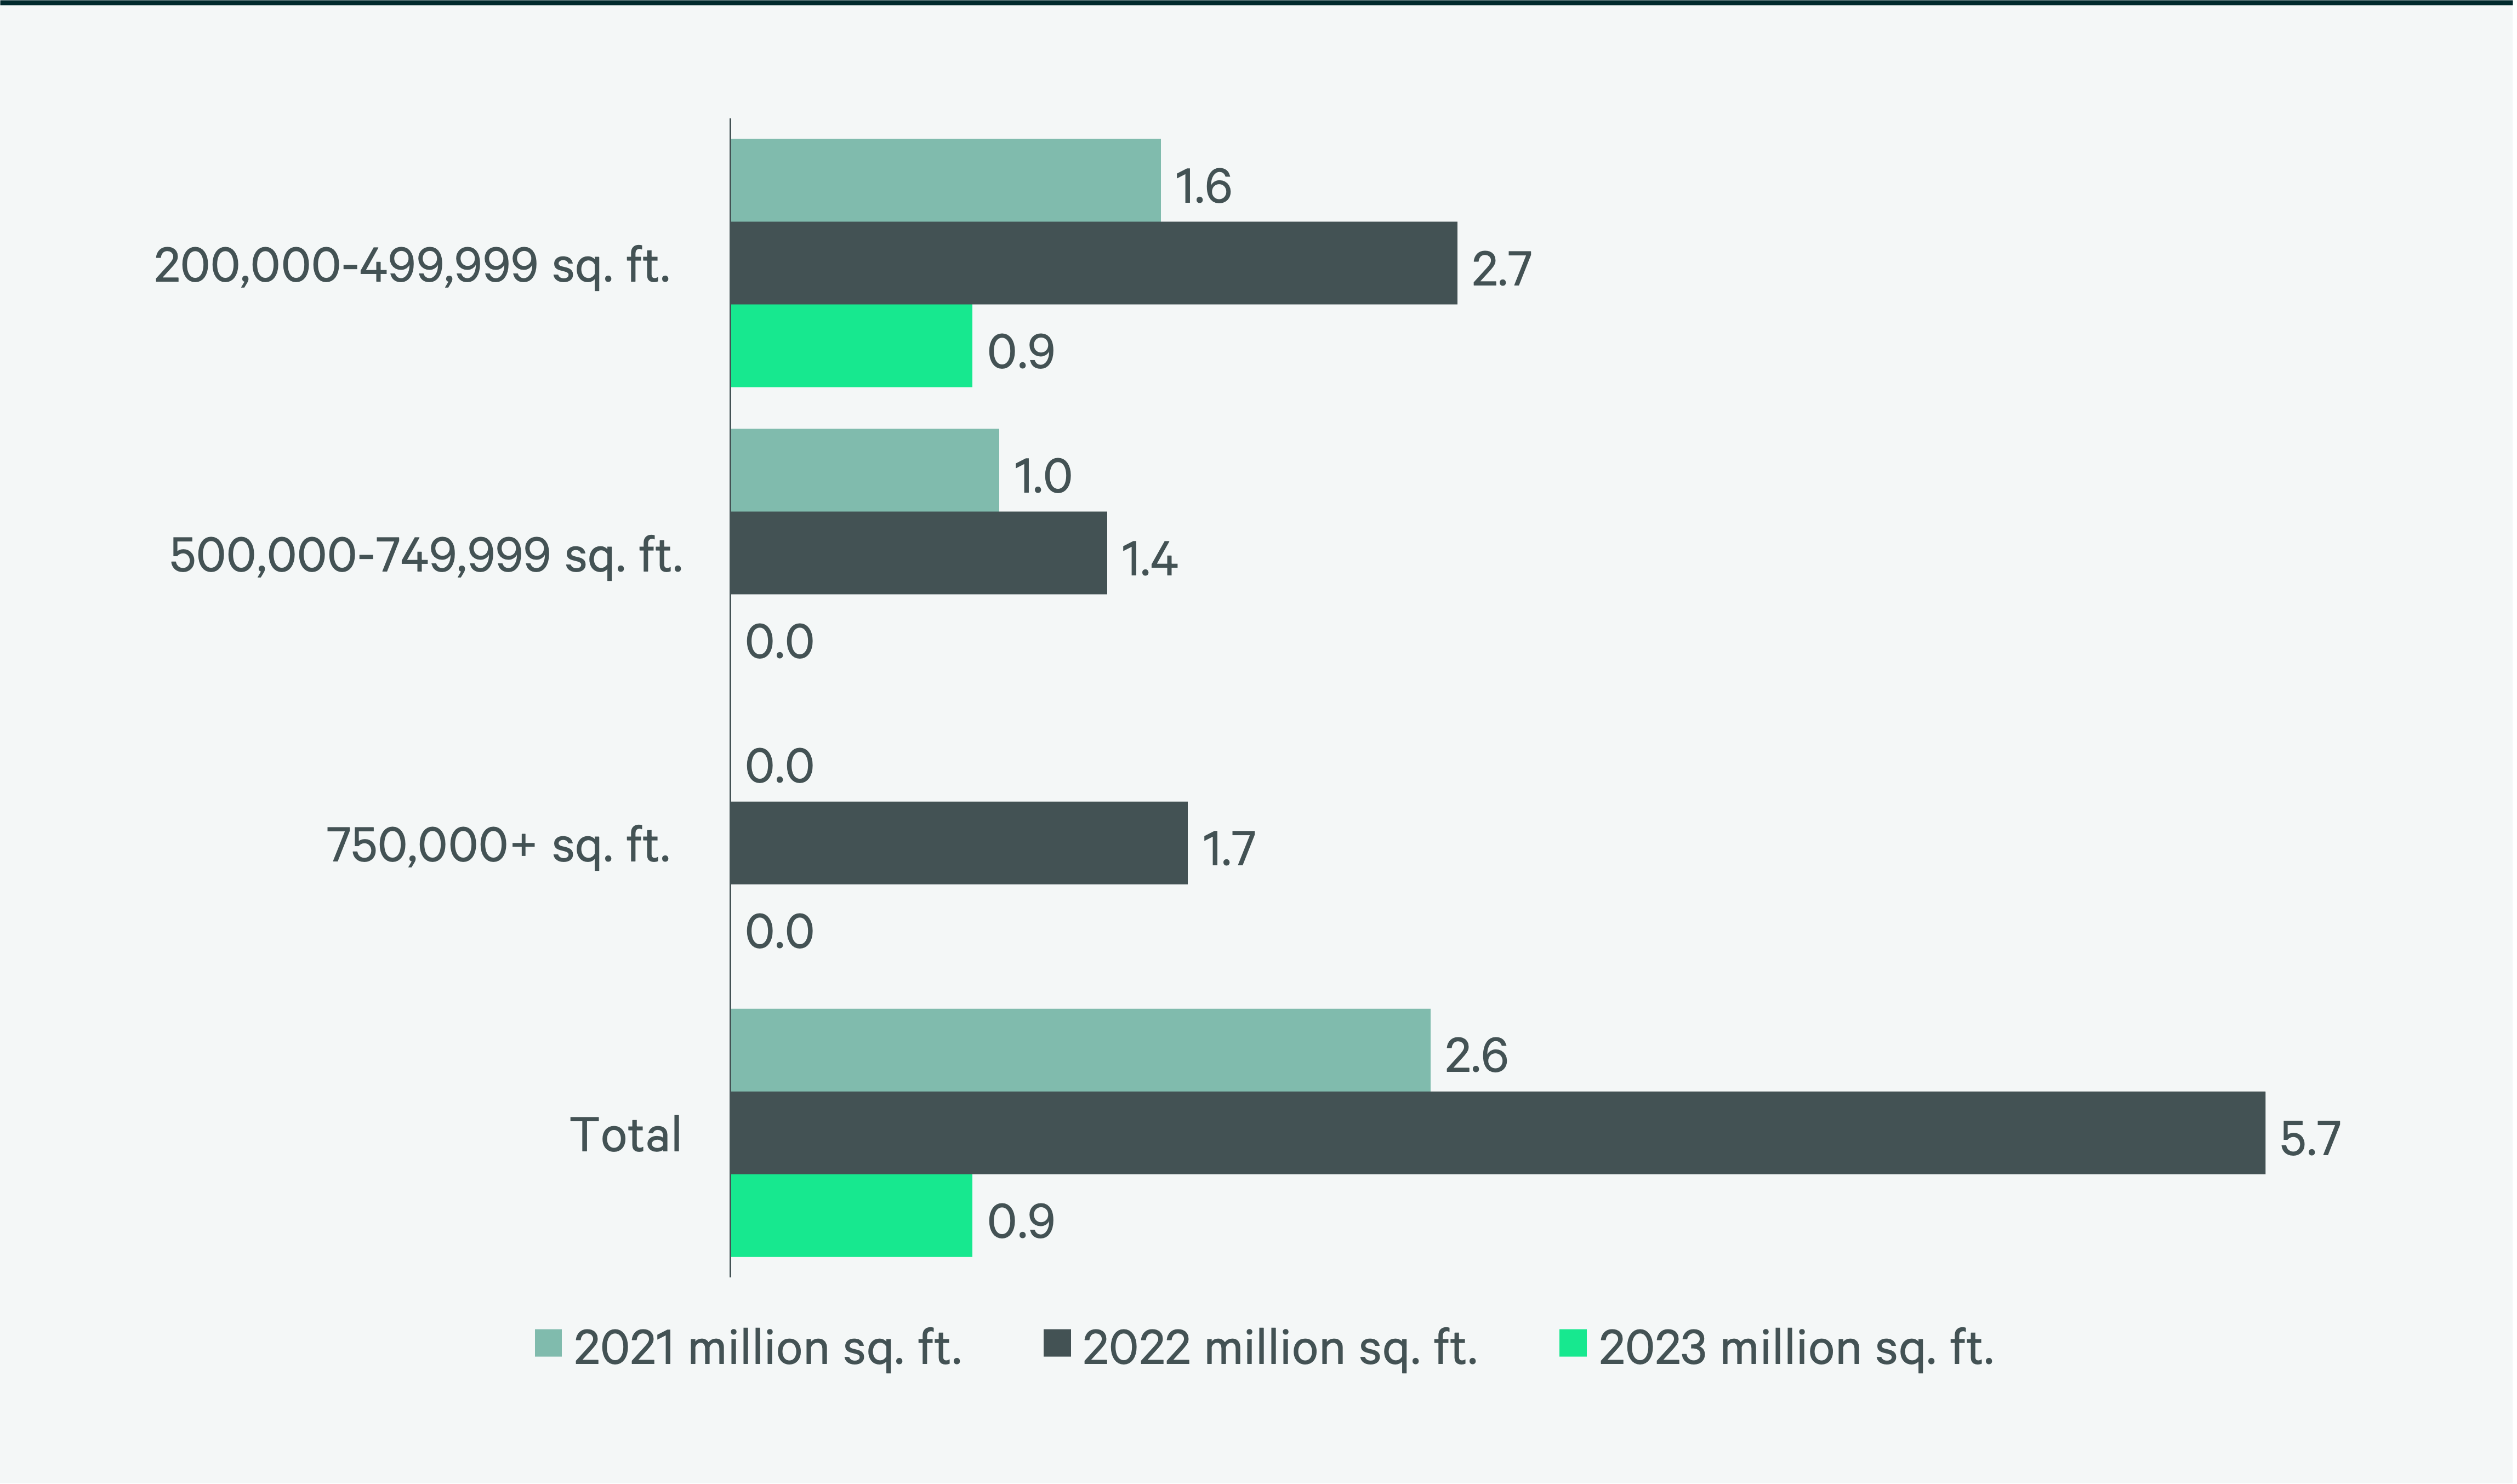
Source: CBRE Research.
Figure 6: 2023 Construction Completions vs. Overall Net Absorption by Size Range
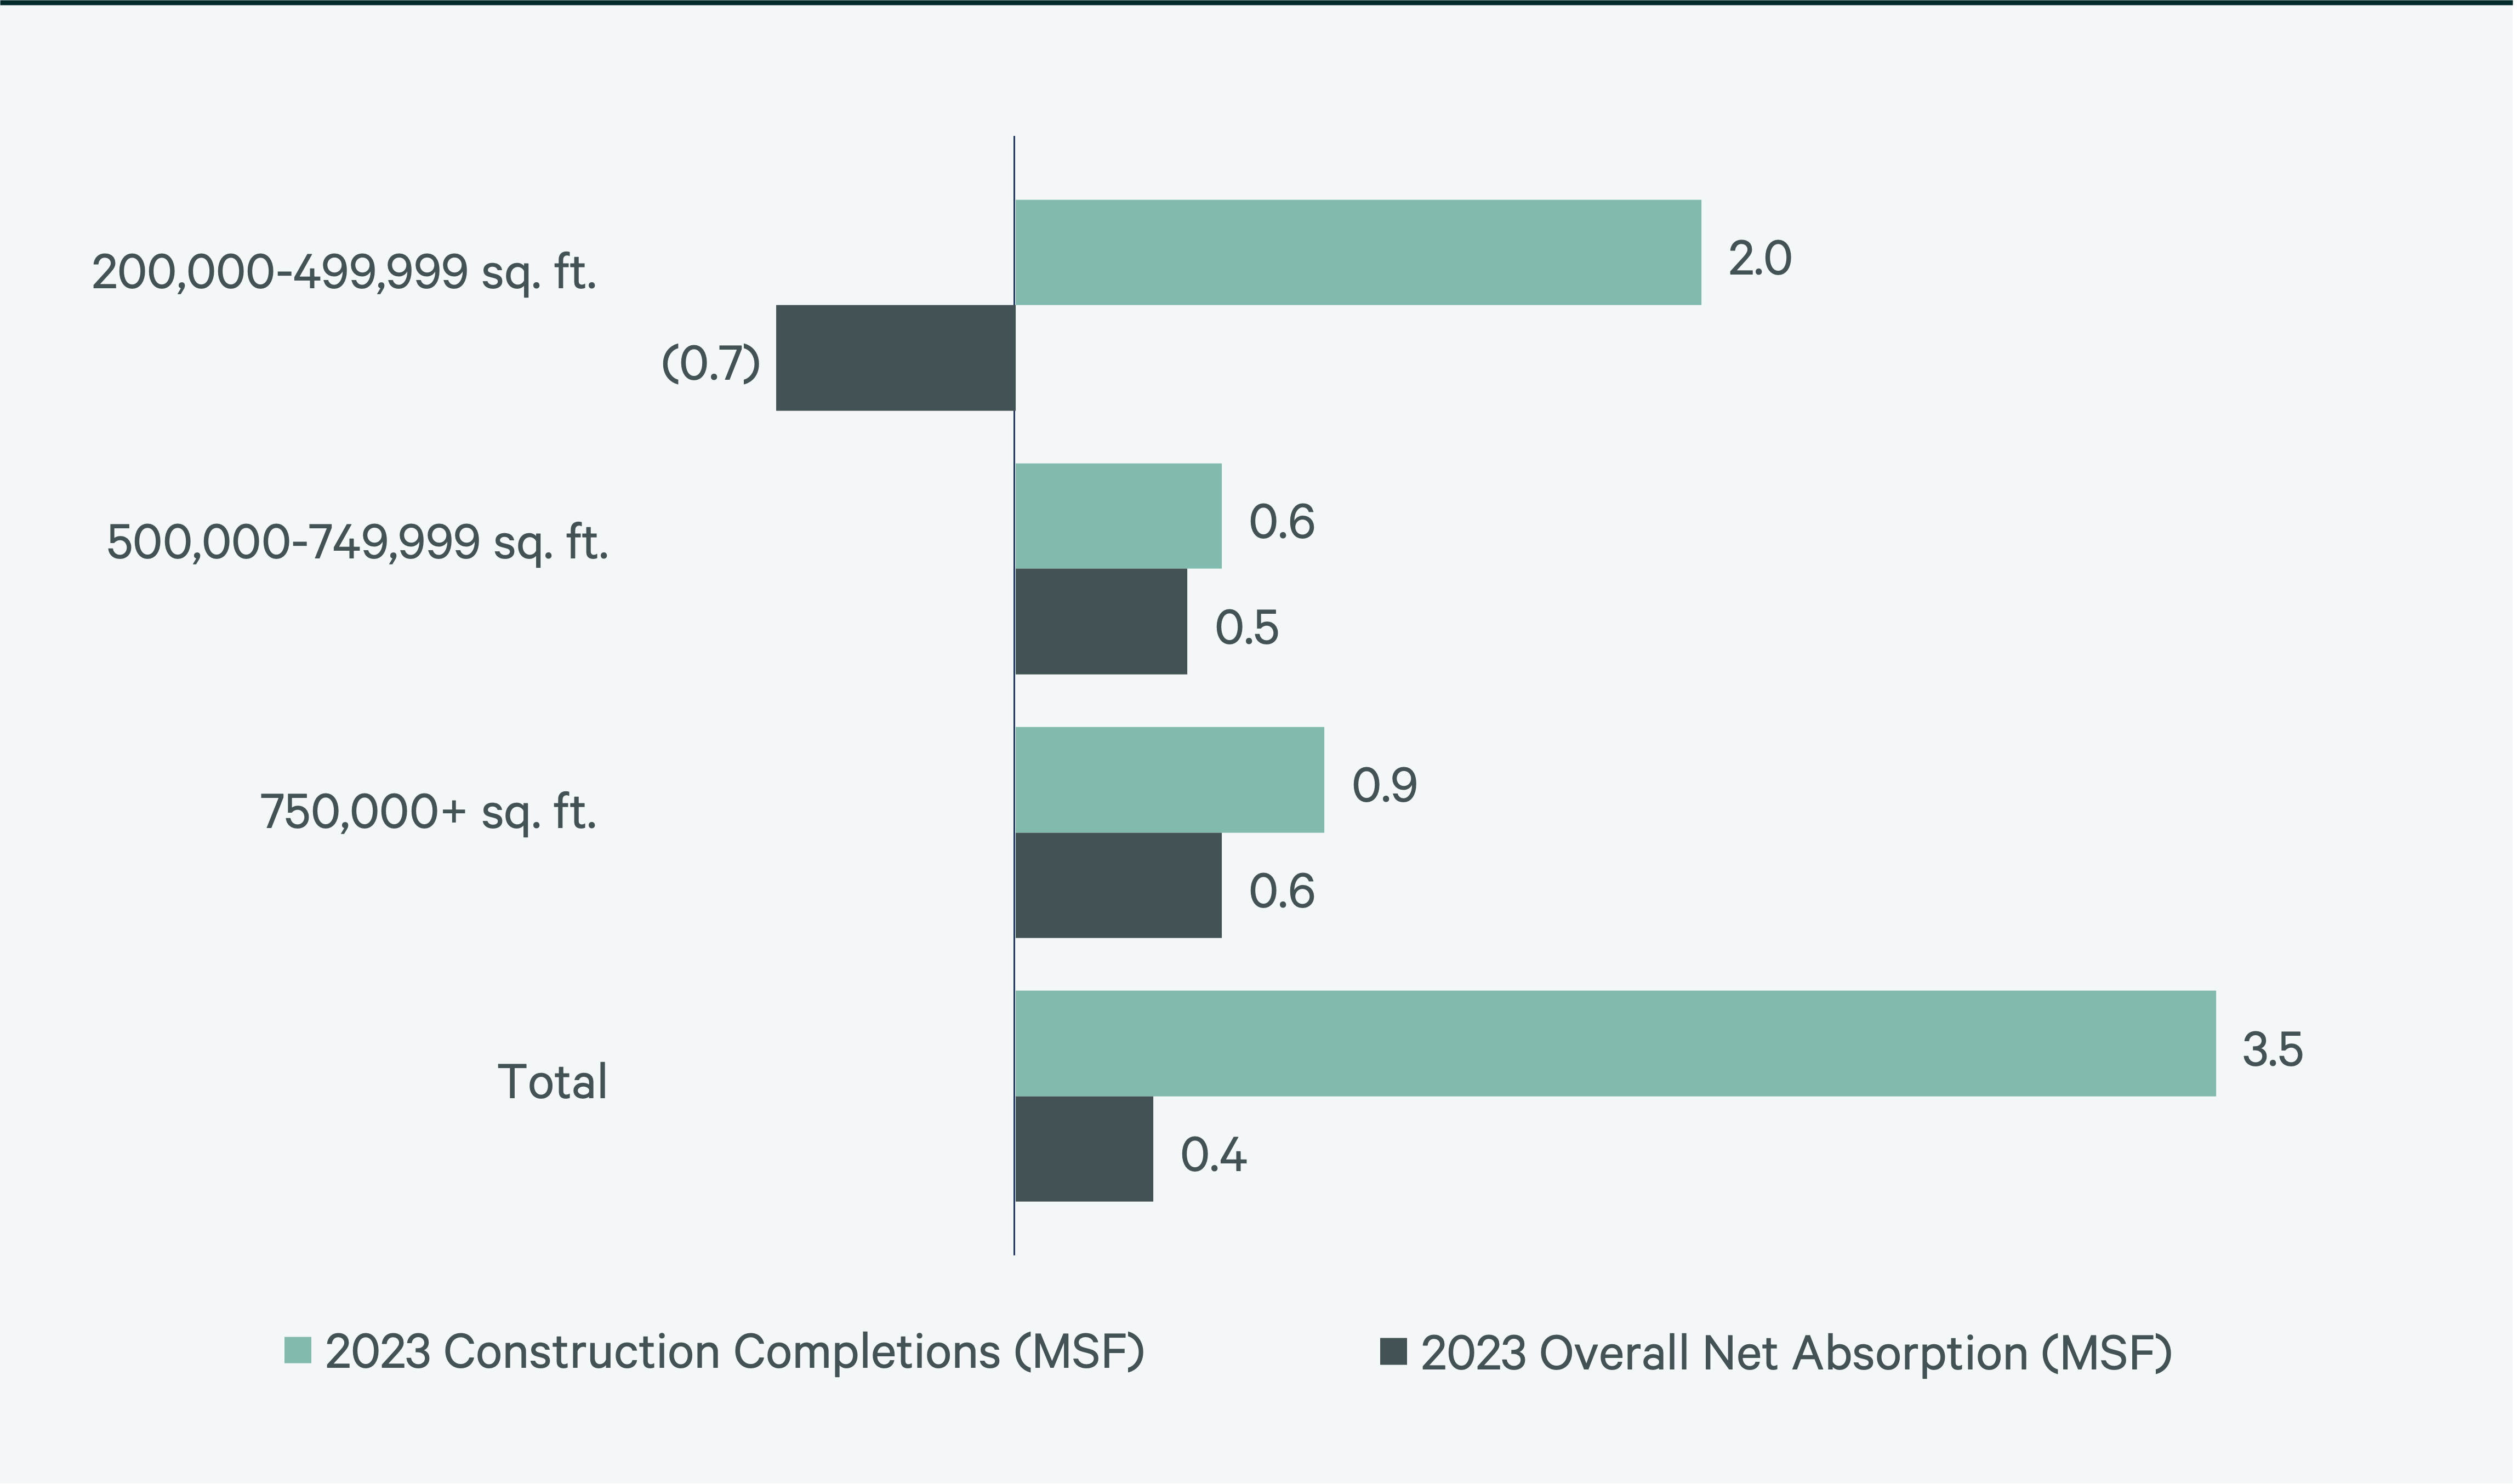
Figure 7: Direct Vacancy Rate by Size Range
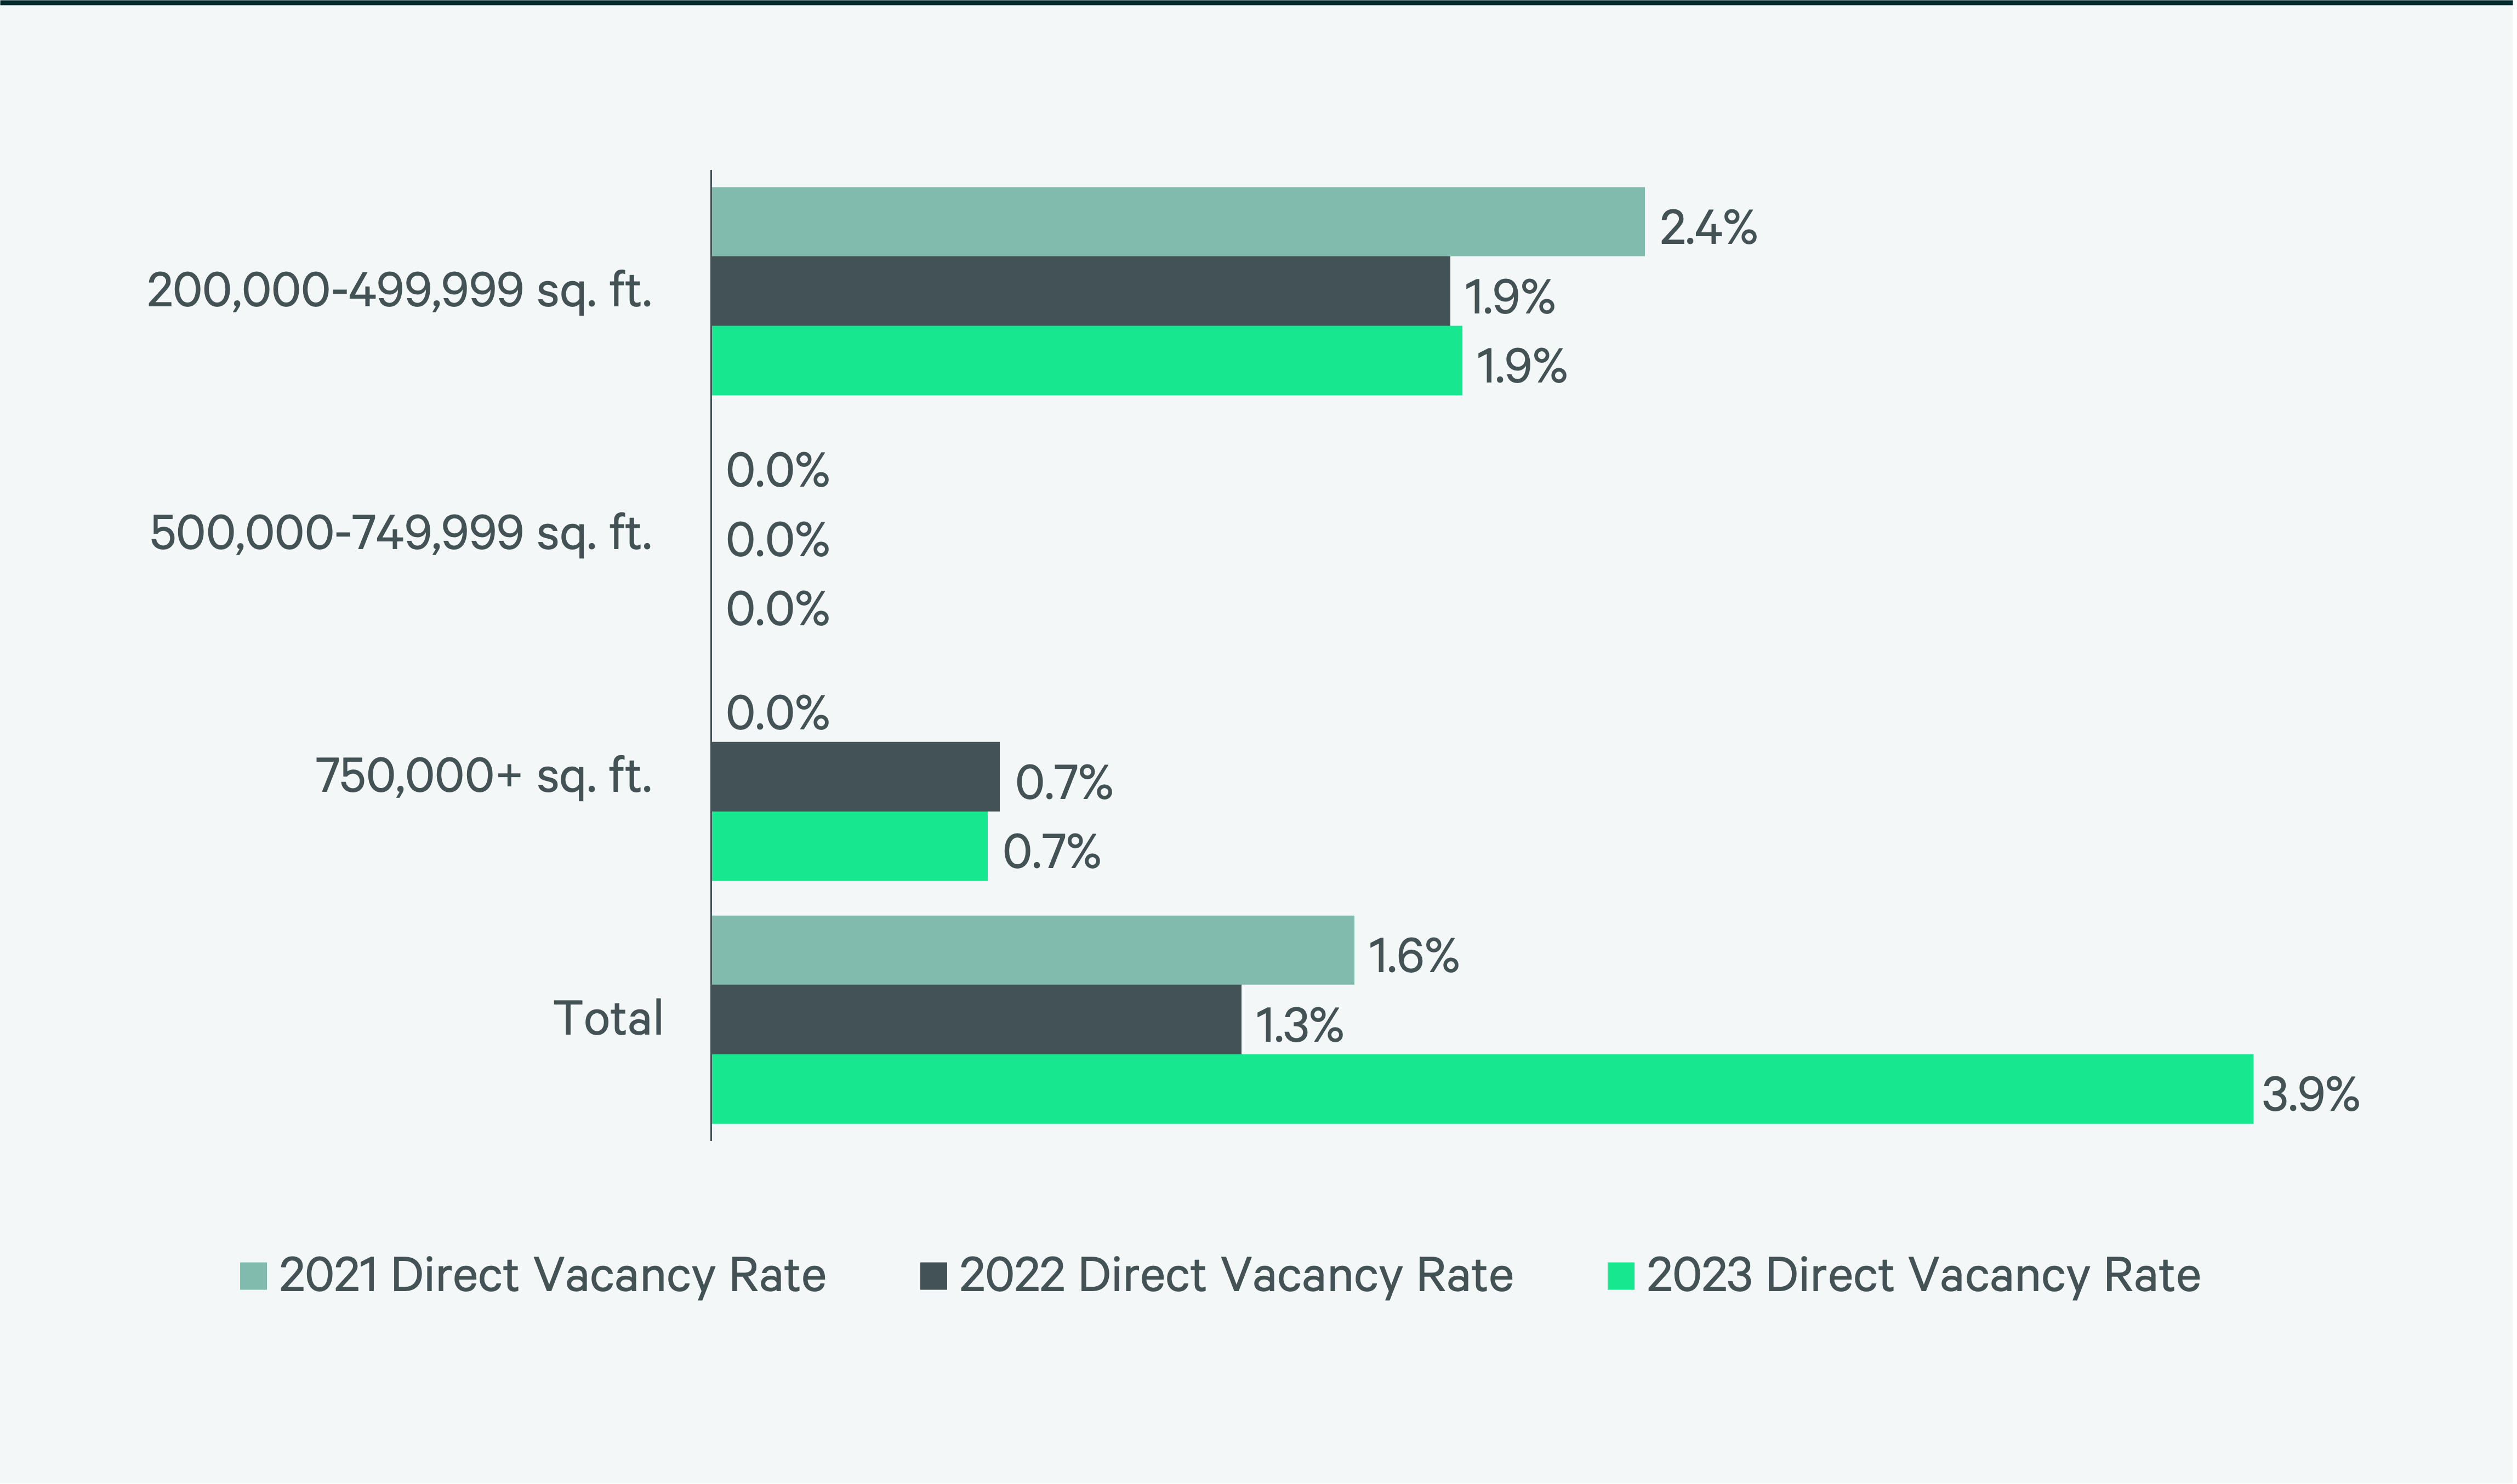
Figure 8: Under Construction & Percentage Preleased
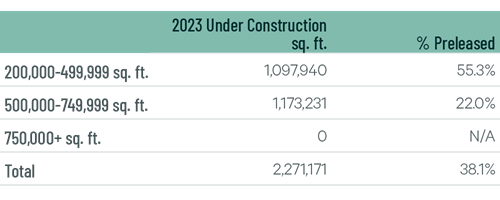
Figure 9: First Year Taking Rents (psf/yr)
Source: CBRE Research.
Explore Big-Box Insights by Market
-

The Northern/Central New Jersey market serves the U.S.’s largest population within a 50-, 100- and 250-mile radius.
-

Over 8 million people live within 50 miles of the market’s core, and 60 million are within 250 miles.
-

Around 9 million people live within 50 miles of the market’s core, the highest population concentration in Canada.
Industrial & Logistics Research
James Breeze
Vice President, Global Industrial and Retail Research

John Morris
President, Americas Industrial & Logistics, Advisory Services