Future Cities
St. Louis
2024 North America Industrial Big-Box Review & Outlook
April 29, 2024 5 Minute Read

Demographics
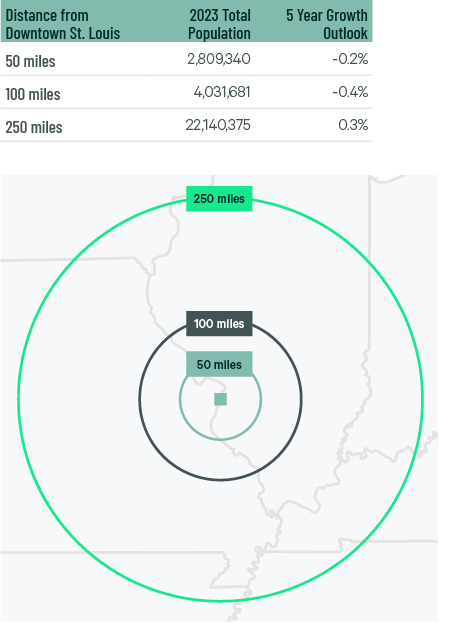
Nearly 3 million people live within 50 miles of the market’s core but, like many Midwest markets, this is expected to decline by 0.2% over the next five years. St. Louis’ strength as a big-box market comes from its central location. There are 22 million people or 9 million households within 250 miles of St. Louis.
Figure 1: St. Louis Population Analysis
The local warehouse labor force of 38,000 is expected to grow by 4% by 2034, according to CBRE Labor Analytics. The average wage for a non-supervisory warehouse worker is $17.76 per hour, in-line with the national average.
Figure 2: St. Louis Warehouse & Storage Labor Fundamentals
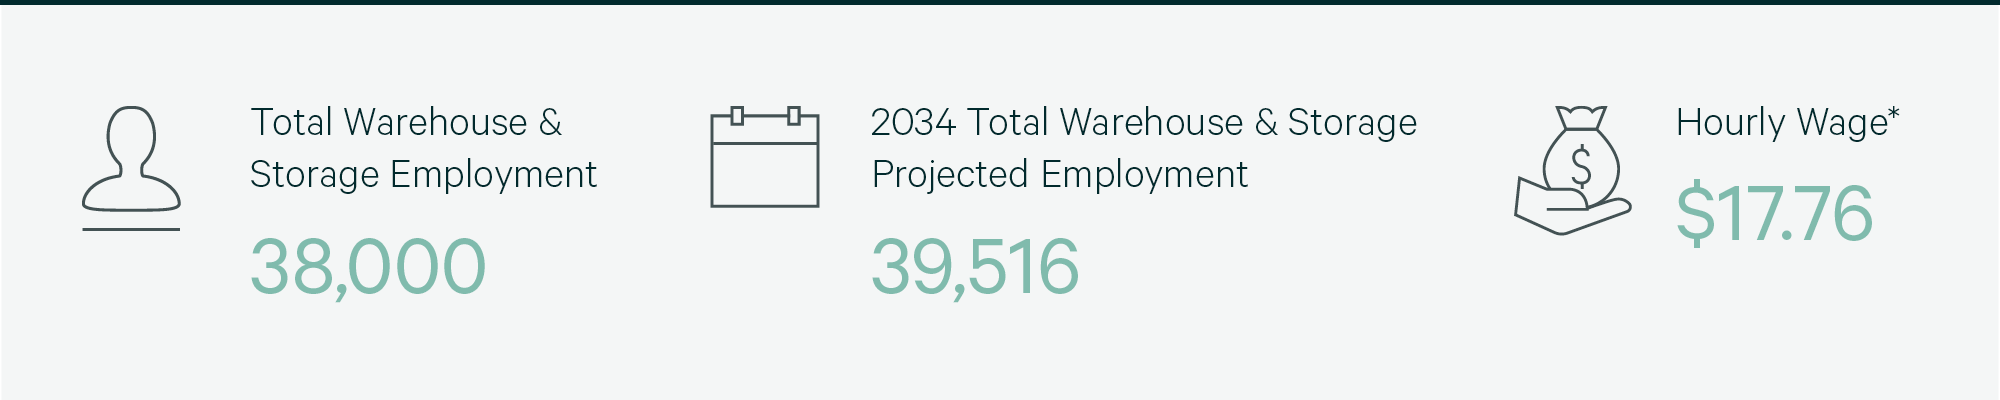
* Median wage (1 year experience); non-supervisory warehouse material handlers.
Location Incentives
Over the past five years, there have been over 130 economic incentives deals for an average of $26,000 per new job in metro St. Louis, according to fDi Intelligence.
CBRE’s Location Incentives Group reports that the top incentive program in Missouri is the Missouri Works Program, offering payroll rebates and discretionary income tax credits to business that create new jobs. For rural counties to qualify, at least two full-time jobs must be created with wages exceeding 80% of the average county wage. For non-rural counties to qualify, at least 10 full-time jobs must be created with wages exceeding 90% of the average county wage.
Another program is the Business Use Incentives for Large Scale Development (BUILD) program. BUILD provides refundable tax credits to companies for manufacturing and R&D projects that create a minimum of 100 new jobs and invest at least $15 million in capital.
A top incentive program offered in neighboring Illinois is the Economic Development for a Growing Economy Program (EDGE), offering non-refundable, discretionary tax credits for corporate income taxes for up to 10 years. These credits equal up to 50% of new income tax withholdings generated by a project’s new job creation. To qualify, companies with more than 100 employees worldwide must invest a minimum of $2.5 million and create new jobs equal to 10% of the company’s total employment. Companies with less than 100 employees worldwide must create new jobs equal to 5% of the company’s total employment.
Figure 3: St. Louis Top Incentive Programs
Note: The extent, if any, of state and local incentive offerings depends on location and scope of the operation.
Logistics Driver
The Port of Metropolitan St. Louis encompasses 70 miles and services both sides of the Mississippi River. It is the northernmost ice- and lock-free port on the Mississippi and is served by six Class 1 railroads, seven interstate highways and two international airports. Nearly one-third of the U.S. population is located within 500 miles of the port. St. Louis Lambert International Airport is a growing cargo hub, with total cargo volumes continuing to increase over the past three years.

Nearly one-third of the U.S. population is located within 500 miles of the Port of Metropolitan St. Louis.
Supply & Demand
Industrial big-box leasing in St. Louis declined to just 2.4 million sq. ft. in 2023, all of which occurred in transactions under 500,000 sq. ft. Less leasing and some move-outs from spaces over 500,000 sq. ft. resulted in negative net absorption and an increased big-box vacancy rate of 6.1%. Despite rise in vacancies, taking rents increased by 15.1% in facilities under 500,000 sq. ft. There is 5 million sq. ft. under construction in the market, nearly all preleased. The lack of new space from development should help stabilize vacancy growth and maintain the upward trend in rents in 2024.
Figure 4: Share of 2023 Leasing by Occupier Type
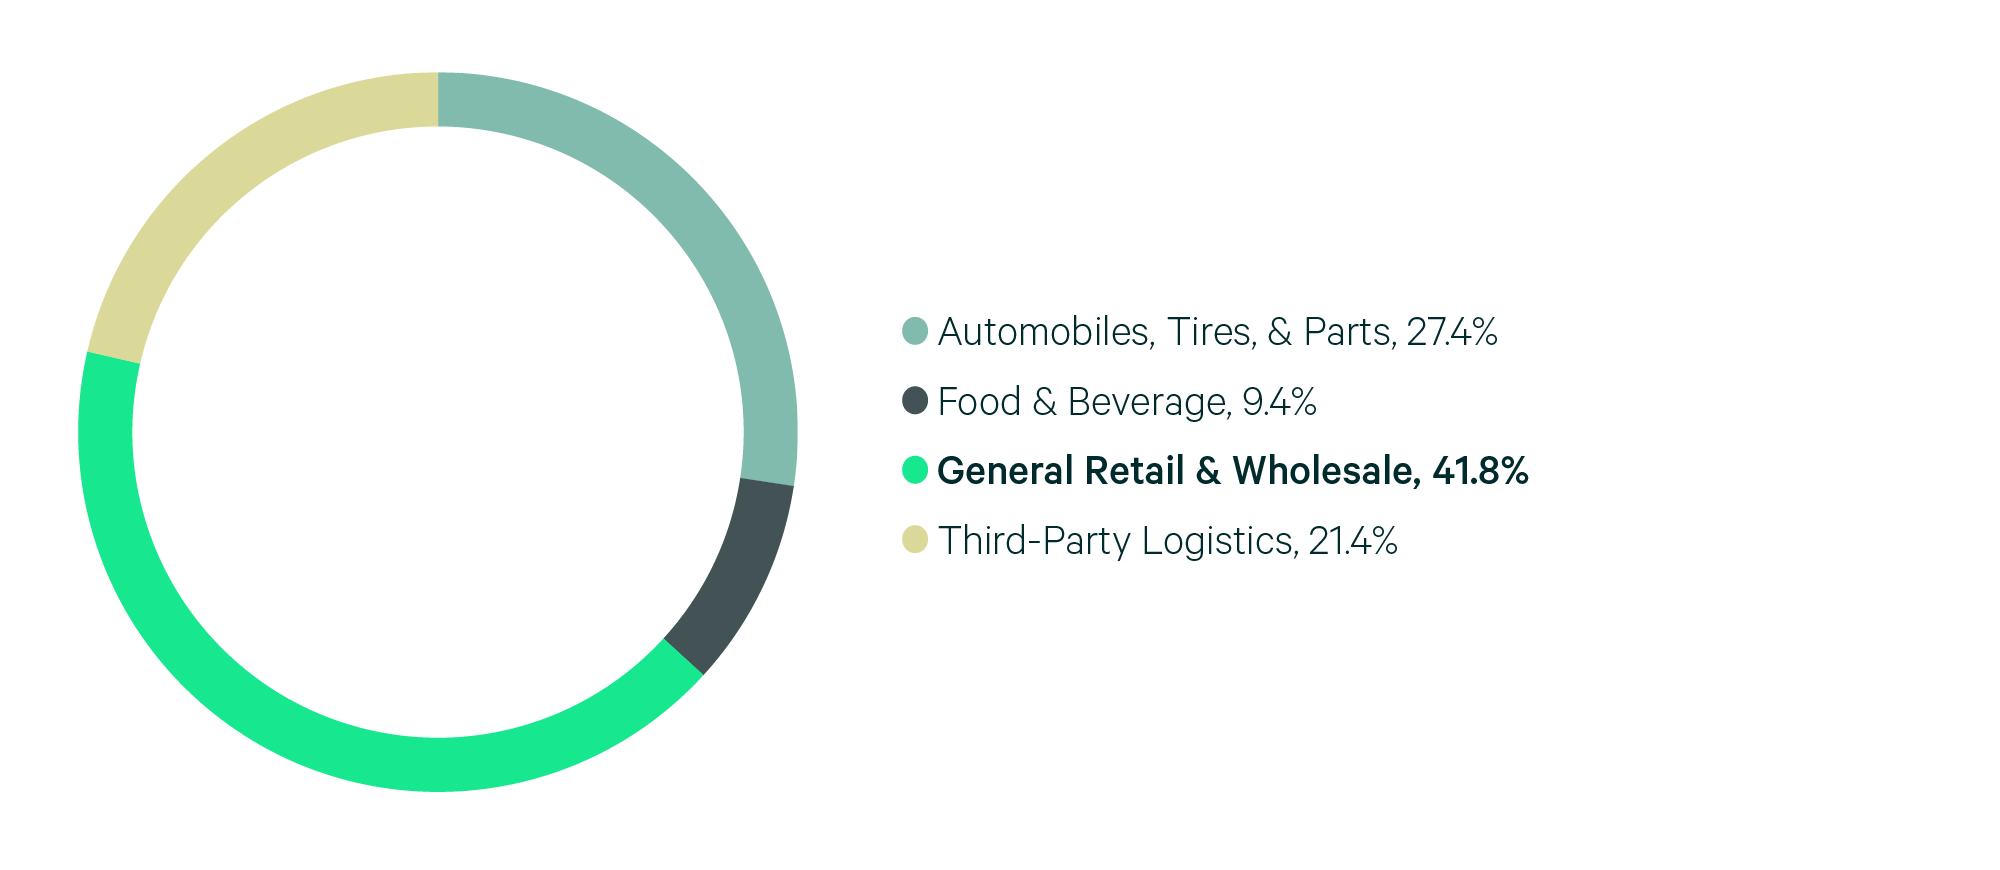
Source: CBRE Research.
Figure 5: Lease Transaction Volume by Size Range
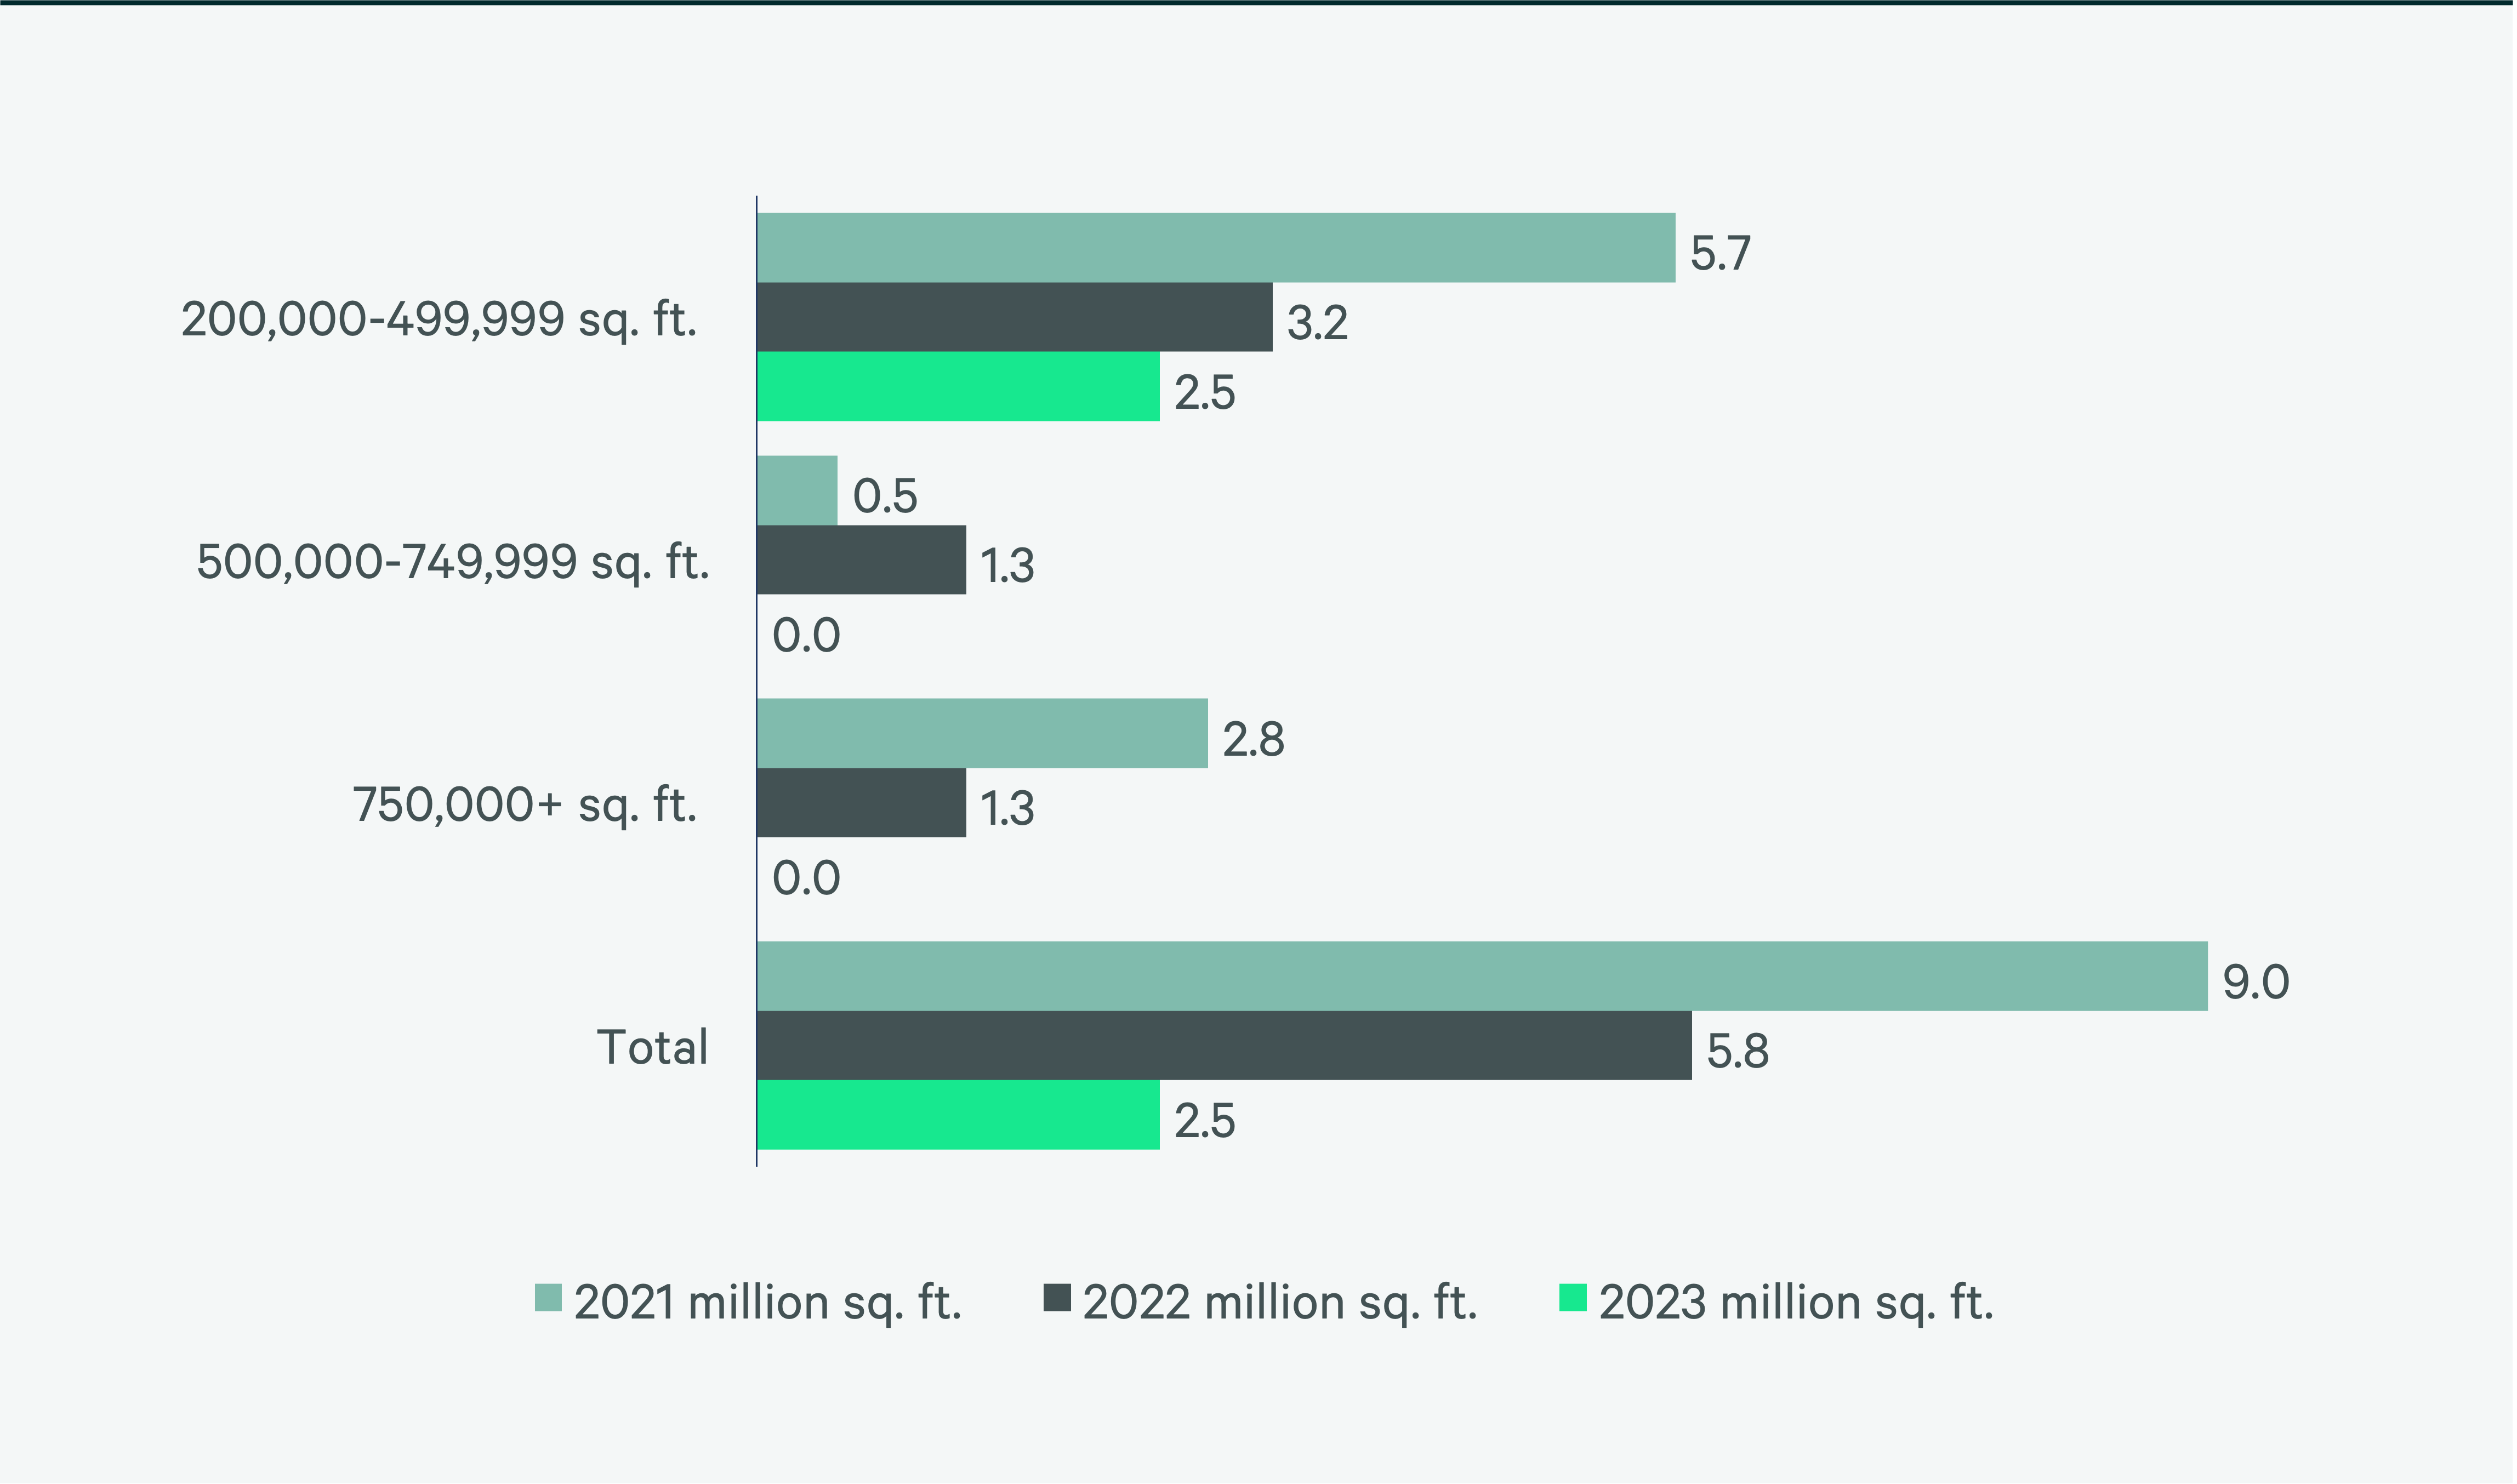
Source: CBRE Research.
Figure 6: 2023 Construction Completions vs. Overall Net Absorption by Size Range
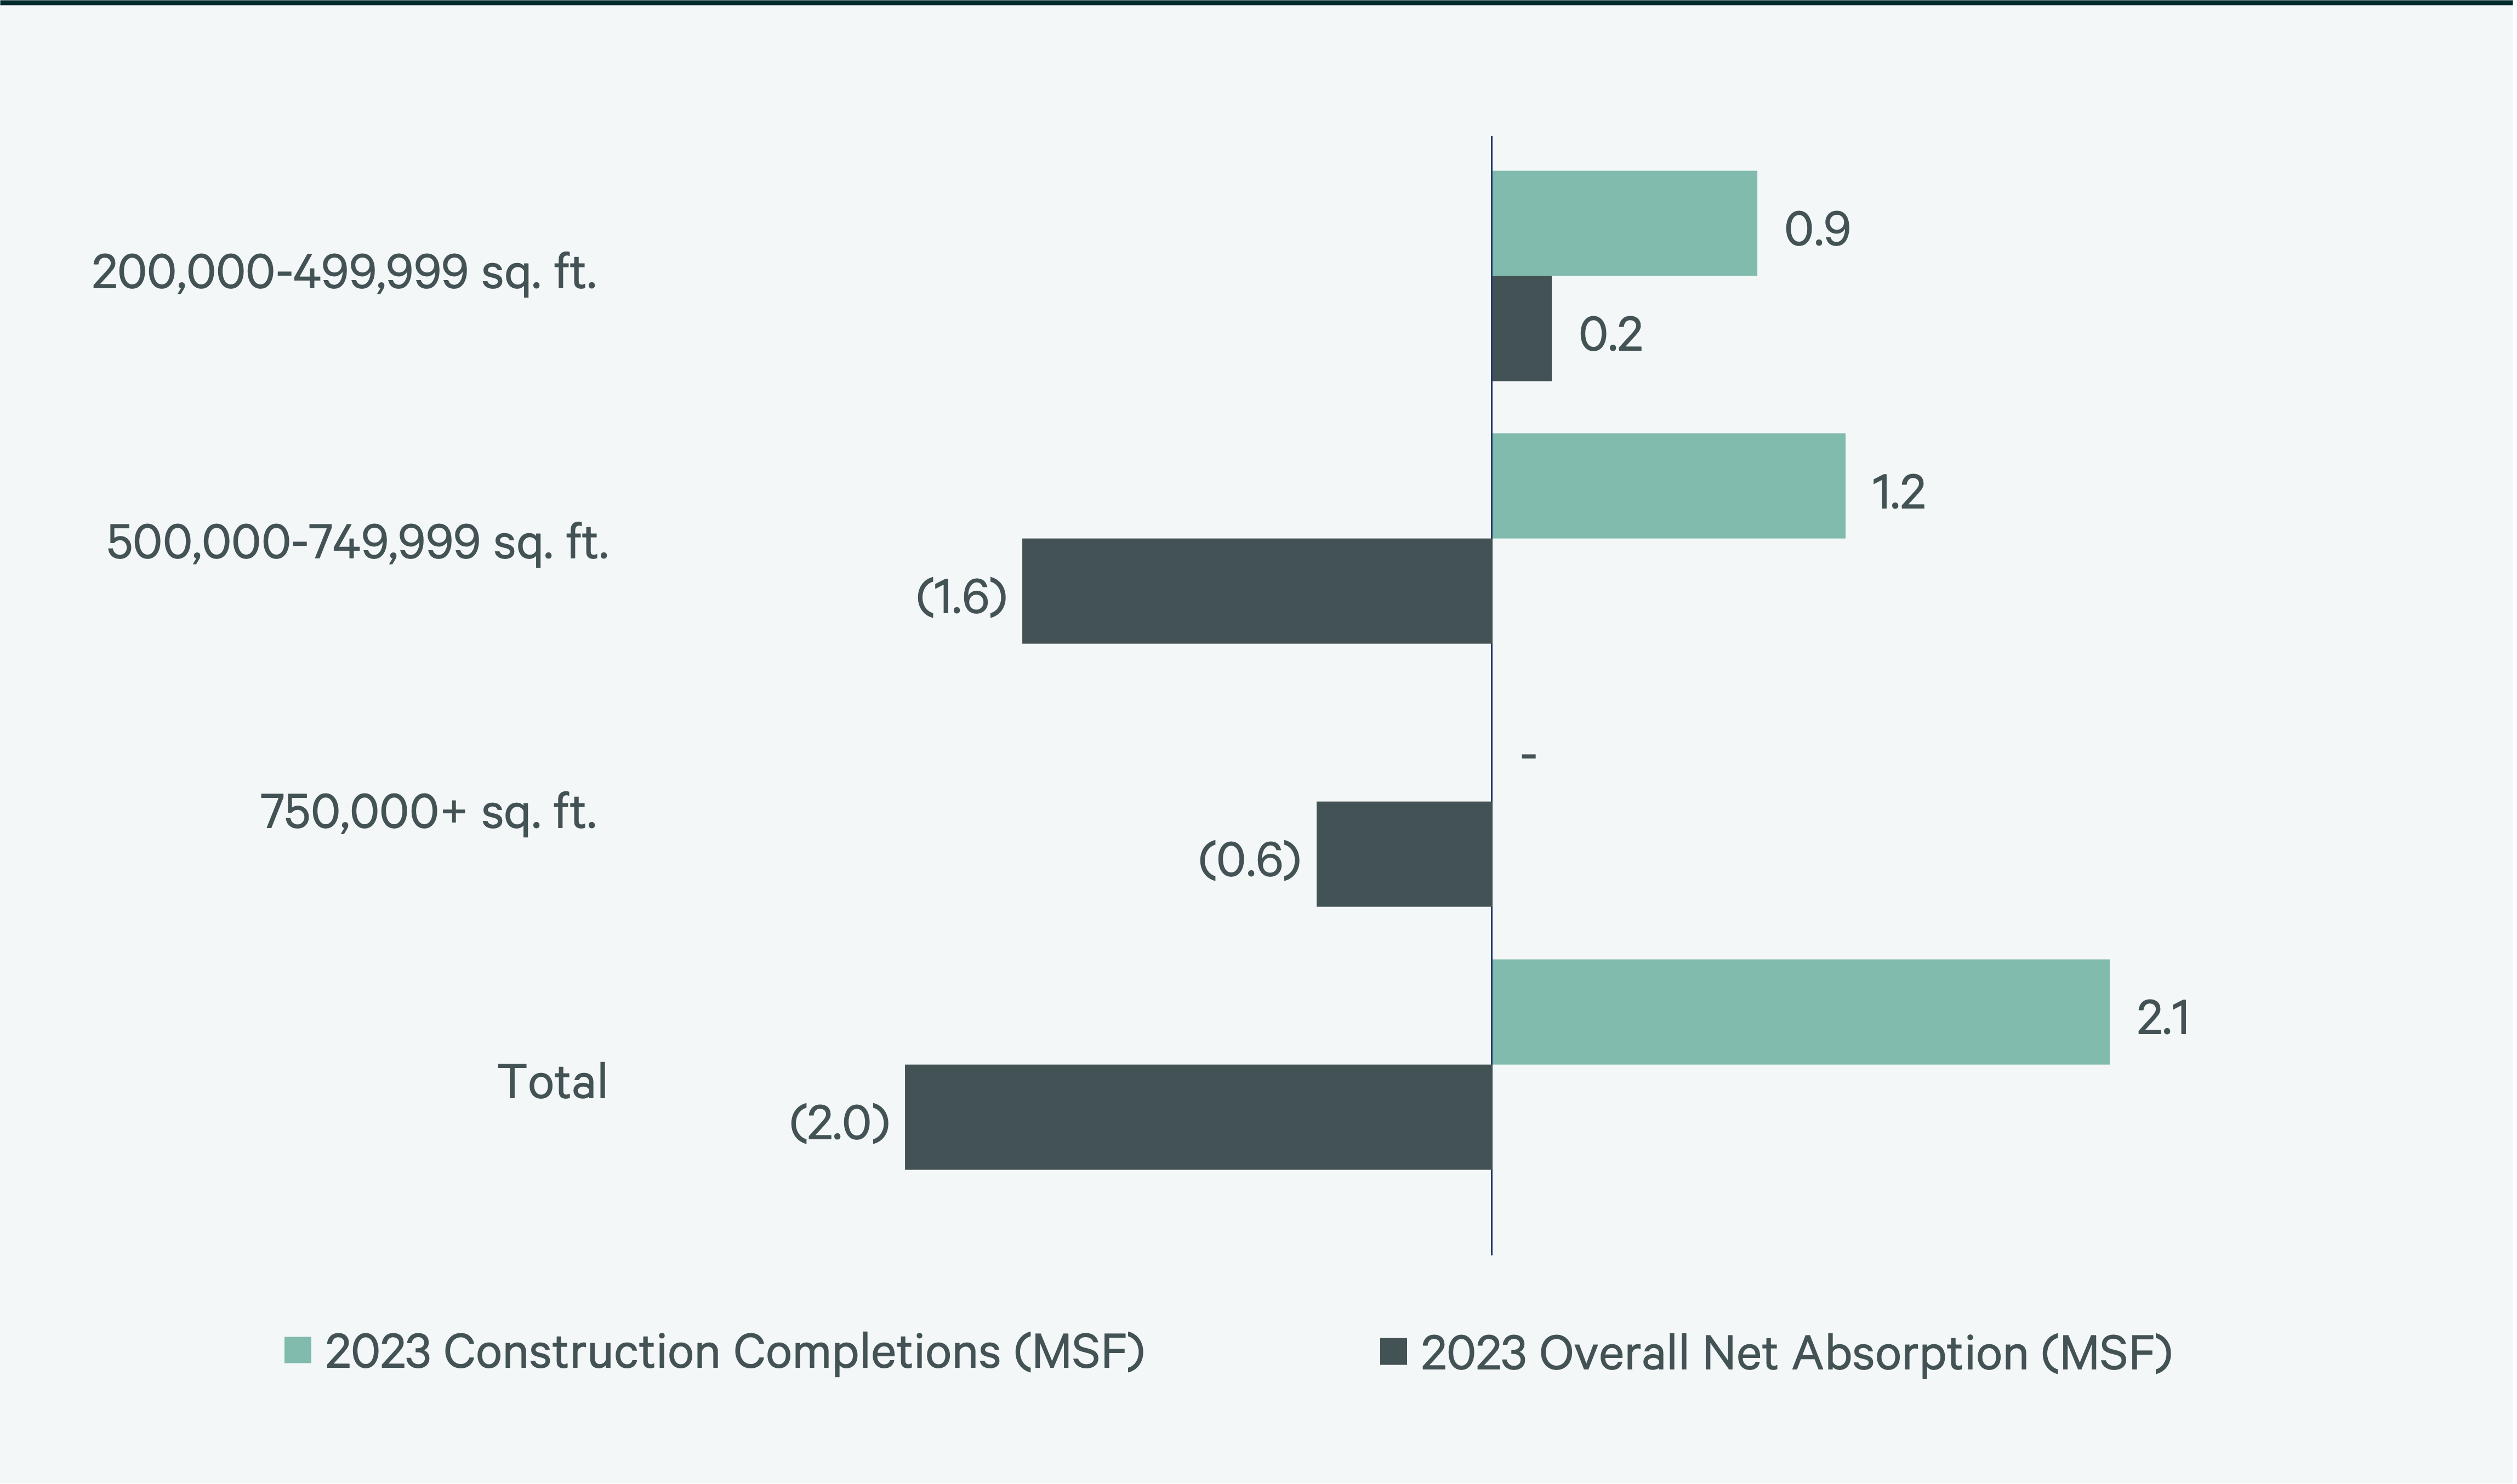
Figure 7: Direct Vacancy Rate by Size Range
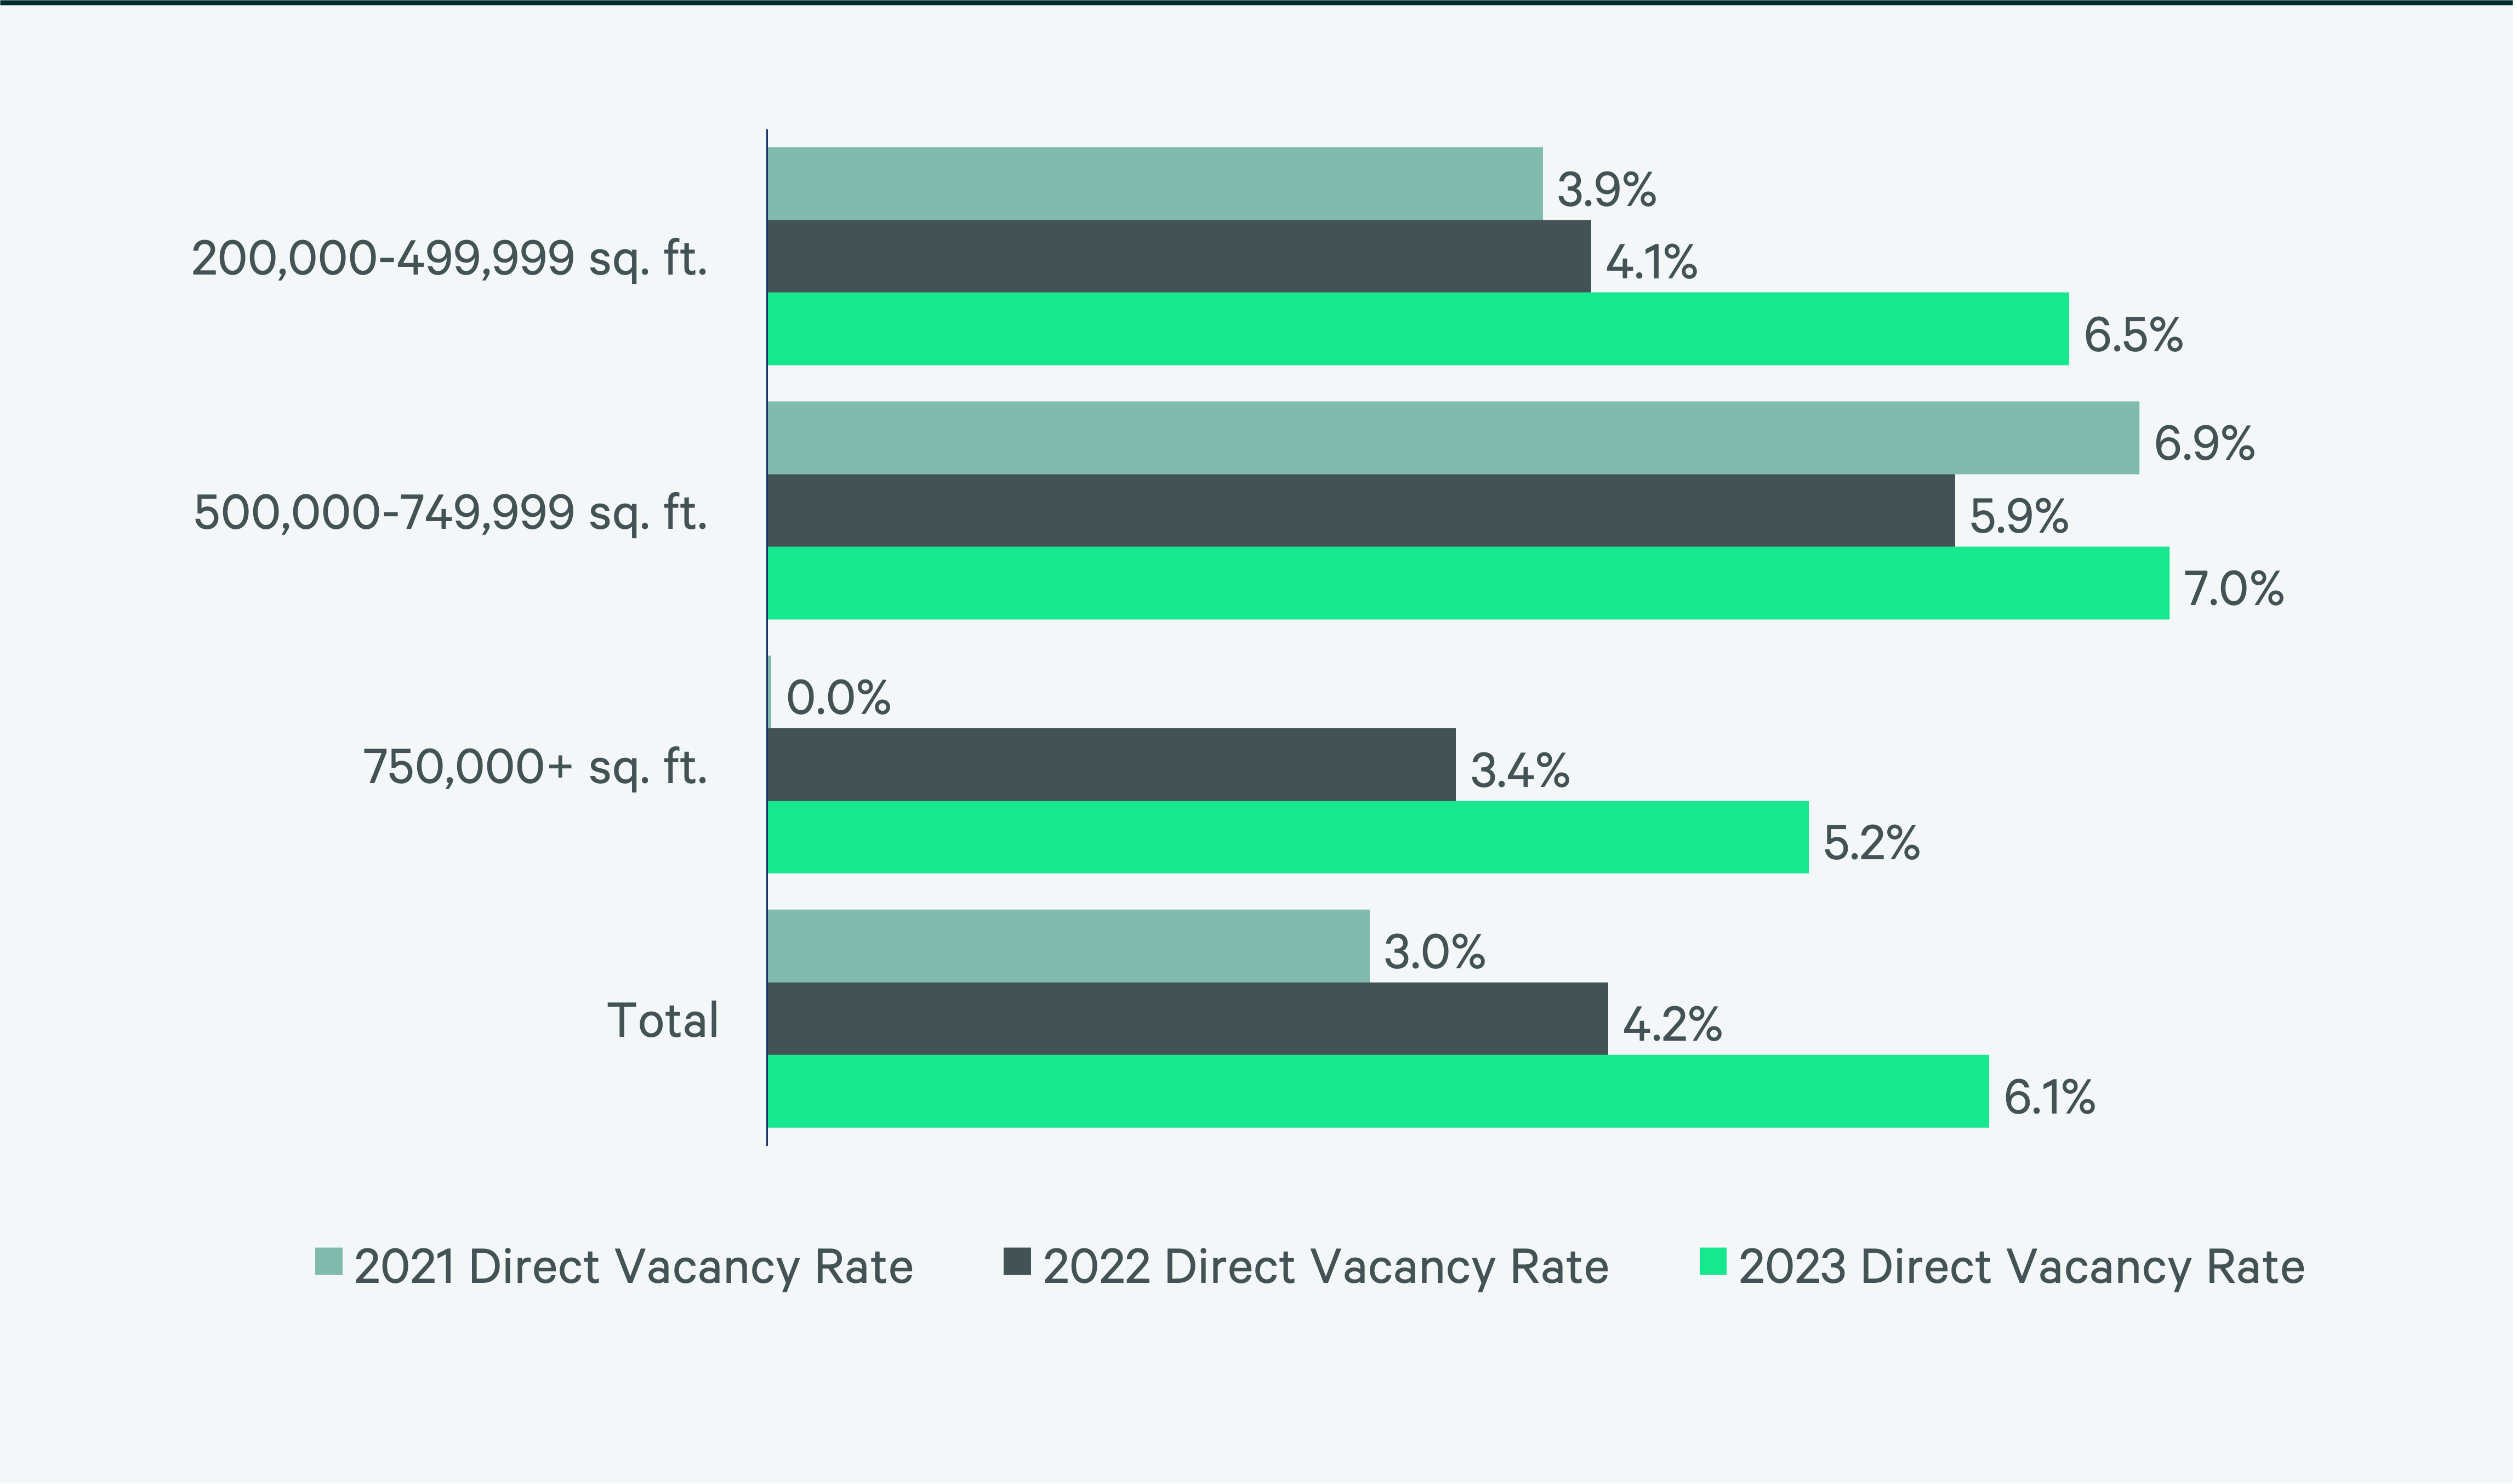
Figure 8: Under Construction & Percentage Preleased
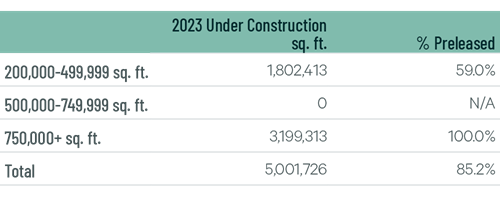
Figure 9: First Year Taking Rents (psf/yr)
Source: CBRE Research.
Explore Big-Box Insights by Market
-

Over 9 million people live within 50 miles of the market’s core, which is expected to decline by 0.7% by 2028.
-

Kansas City’s biggest draw is its easy reach to a large portion of the country.
-

Over 1.4 million people–23% aged 18-34–live within 50 miles of downtown Memphis.
Industrial & Logistics Research
James Breeze
Vice President, Global Industrial and Retail Research

John Morris
President, Americas Industrial & Logistics, Advisory Services