Future Cities
Memphis
2024 North America Industrial Big-Box Review & Outlook
April 29, 2024 5 Minute Read

Demographics
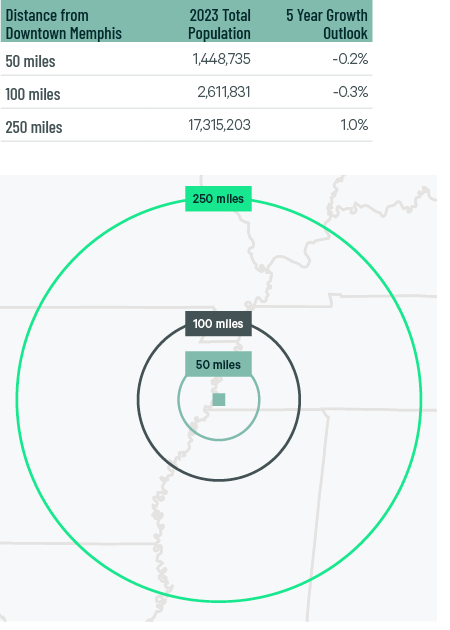
Over 1.4 million people–23% aged 18-34–live within 50 miles of downtown Memphis. There are 17 million sq. ft. and 7 million households within a 250 miles, with a 1% projected five-year growth rate.
Figure 1: Memphis Population Analysis
The local warehouse labor force of just under 53,000 is expected to grow by 6% by 2034, according to CBRE Labor Analytics. The average wage for non-supervisory warehouse worker is $17.61 per hour, slightly below the U.S. average.
Figure 2: Memphis Warehouse & Storage Labor Fundamentals
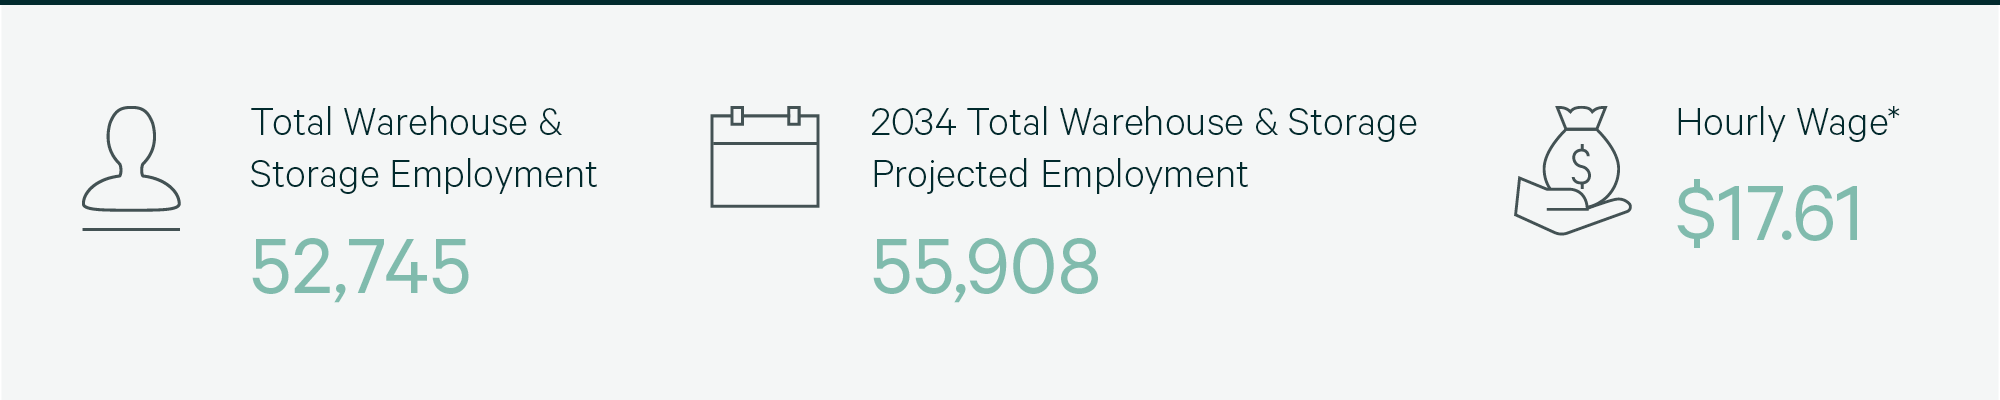
*Median wage (1 year experience); non-supervisory warehouse material handlers.
Location Incentives
Over the past five years, there have been more than 130 economic incentives deals totaling over $525 million for an average of $30,500 per new job in metro Memphis, according to fDi Intelligence.
CBRE’s Location Incentives Group reports that top incentive programs in Tennessee include the Job Tax Credit, offering a one-time corporate income tax credit to businesses that create at least 25 new jobs within three years and make a minimum capital investment of $500,000. The tax credit may offset up to 50% of franchise and excise taxes. Any unused credits may be carried forward for up to 15 years.
A top incentive program in neighboring Mississippi is the Advantage Jobs Incentive Program, offering a rebate for 90% of Mississippi payroll taxes withheld to businesses that create at least 25 new high-quality jobs in the state. To qualify, the new jobs must pay at least 110% of the state or county average wage.
Figure 3: Memphis Top Incentive Programs
Note: The extent, if any, of state and local incentive offerings depends on location and scope of the operation.
Logistics Driver
Memphis is one of North America’s most logistics-friendly markets. The region has an integrated transportation system of highways, rail mainlines, river ports and the world’s second-busiest cargo airport. More than 27,000 companies have operations in Memphis, including over 400 trucking companies.
Memphis is one of only four U.S. cities served by five Class I railroads. Single-system shipment is available to all 48 contiguous states, Alaska, Canada and Mexico. Trucks leaving Memphis can reach 35% of the U.S. population overnight and 68% in two days. I-40 runs coast-to-coast, I-55 intersects Memphis and allows direct access from Chicago to Louisiana, and I-69 connects Canada to Mexico.
The Port of Memphis is 400 river miles from St. Louis and 600 from New Orleans, where cargo can be transferred to ocean liners. The region’s top logistics advantage is Memphis International Airport. Home to the world’s largest FedEx hub, it is the world’s second-most-active air hub and by far the top in North America.

Single-system shipment is available to all 48 contiguous states, Alaska, Canada and Mexico. Trucks leaving Memphis can reach 35% of the U.S. population overnight.
Supply & Demand
Memphis demonstrated strong big-box industrial fundamentals in 2023, with an increase in leasing transactions and a decrease in vacancy rates compared to 2022. Over 11.6 million sq ft. were leased in 2023, more than half of these leases for spaces of 750,000 sq. ft. or larger. Robust leasing lowered the vacancy rate to 5.2% despite 9.6 million sq. ft. of new construction. 3PLs and general retail & wholesale occupiers dominated the leasing, accounting for 45.7% and 32.1% of lease volume, respectively. Despite this, Memphis remains one of the most economical big- box markets in the U.S. with rents actually decreasing 4.1% compared to 2022.
The decline in construction starts has significantly impacted Memphis, with no projects over 200,000 sq. ft. under construction as of year-end 2023. The lack of new supply is expected to continue pushing vacancy rates downward for the foreseeable future and should enable landlords to charge higher rents this year.
Figure 4: Share of 2023 Leasing by Occupier Type
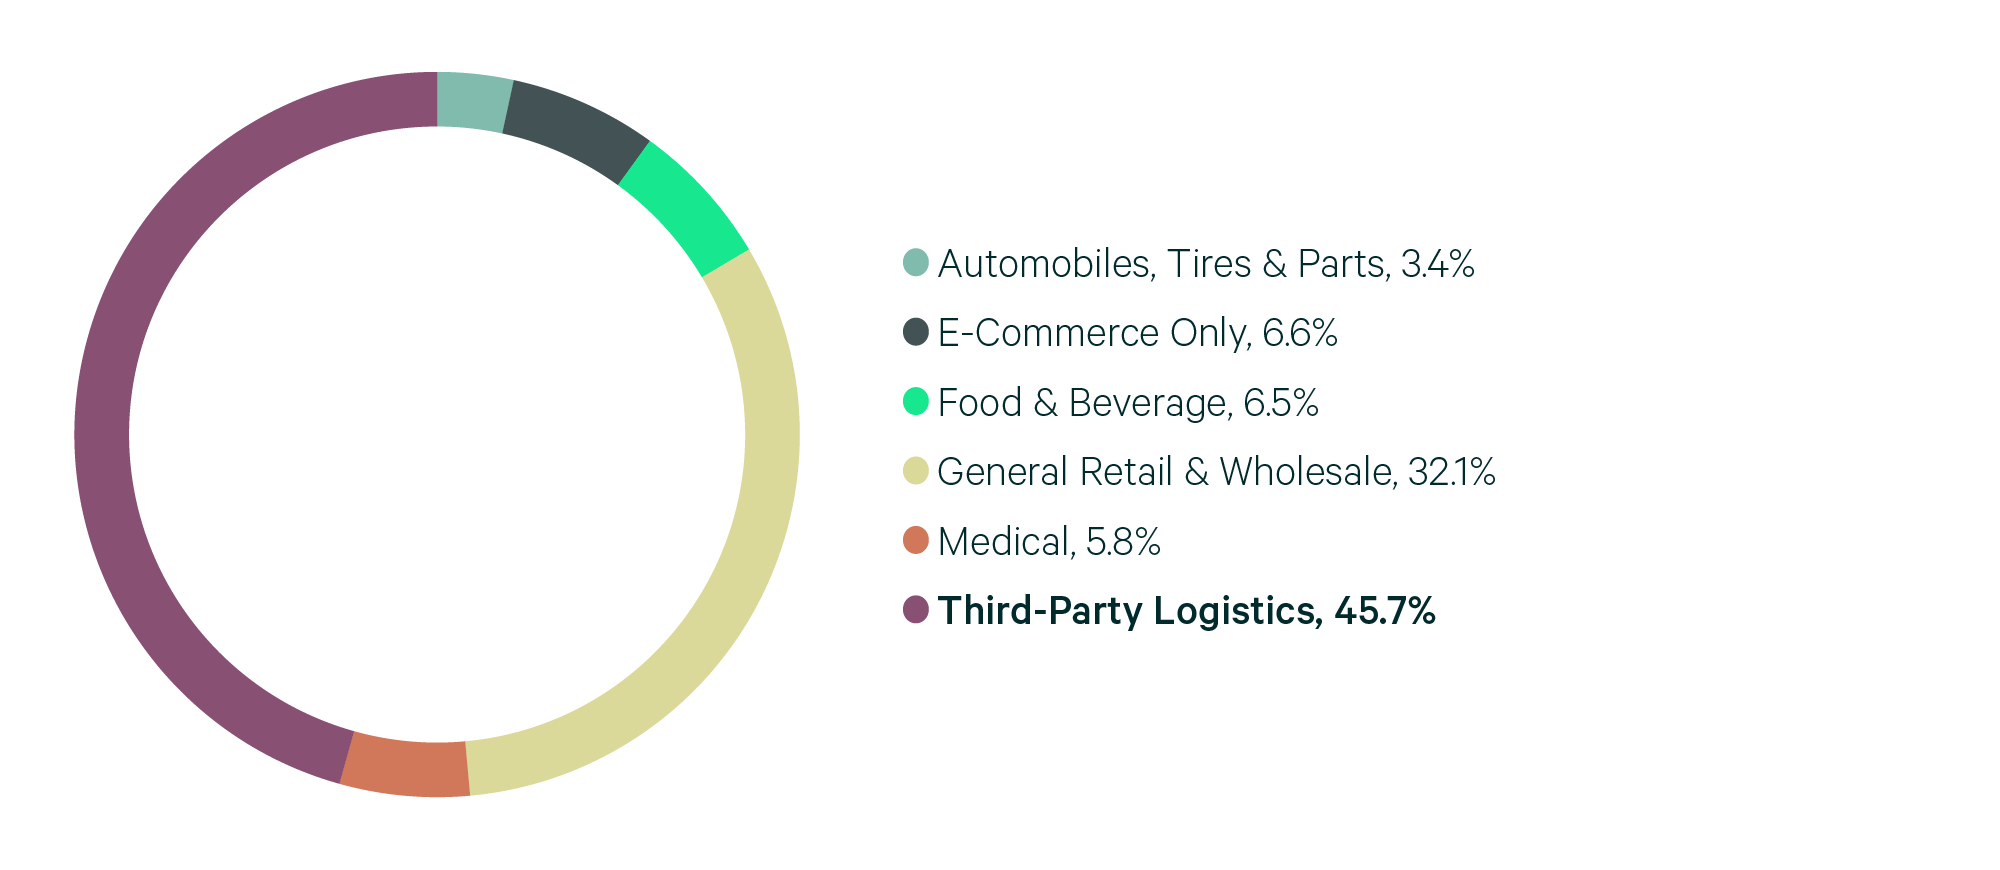
Source: CBRE Research.
Figure 5: Lease Transaction Volume by Size Range
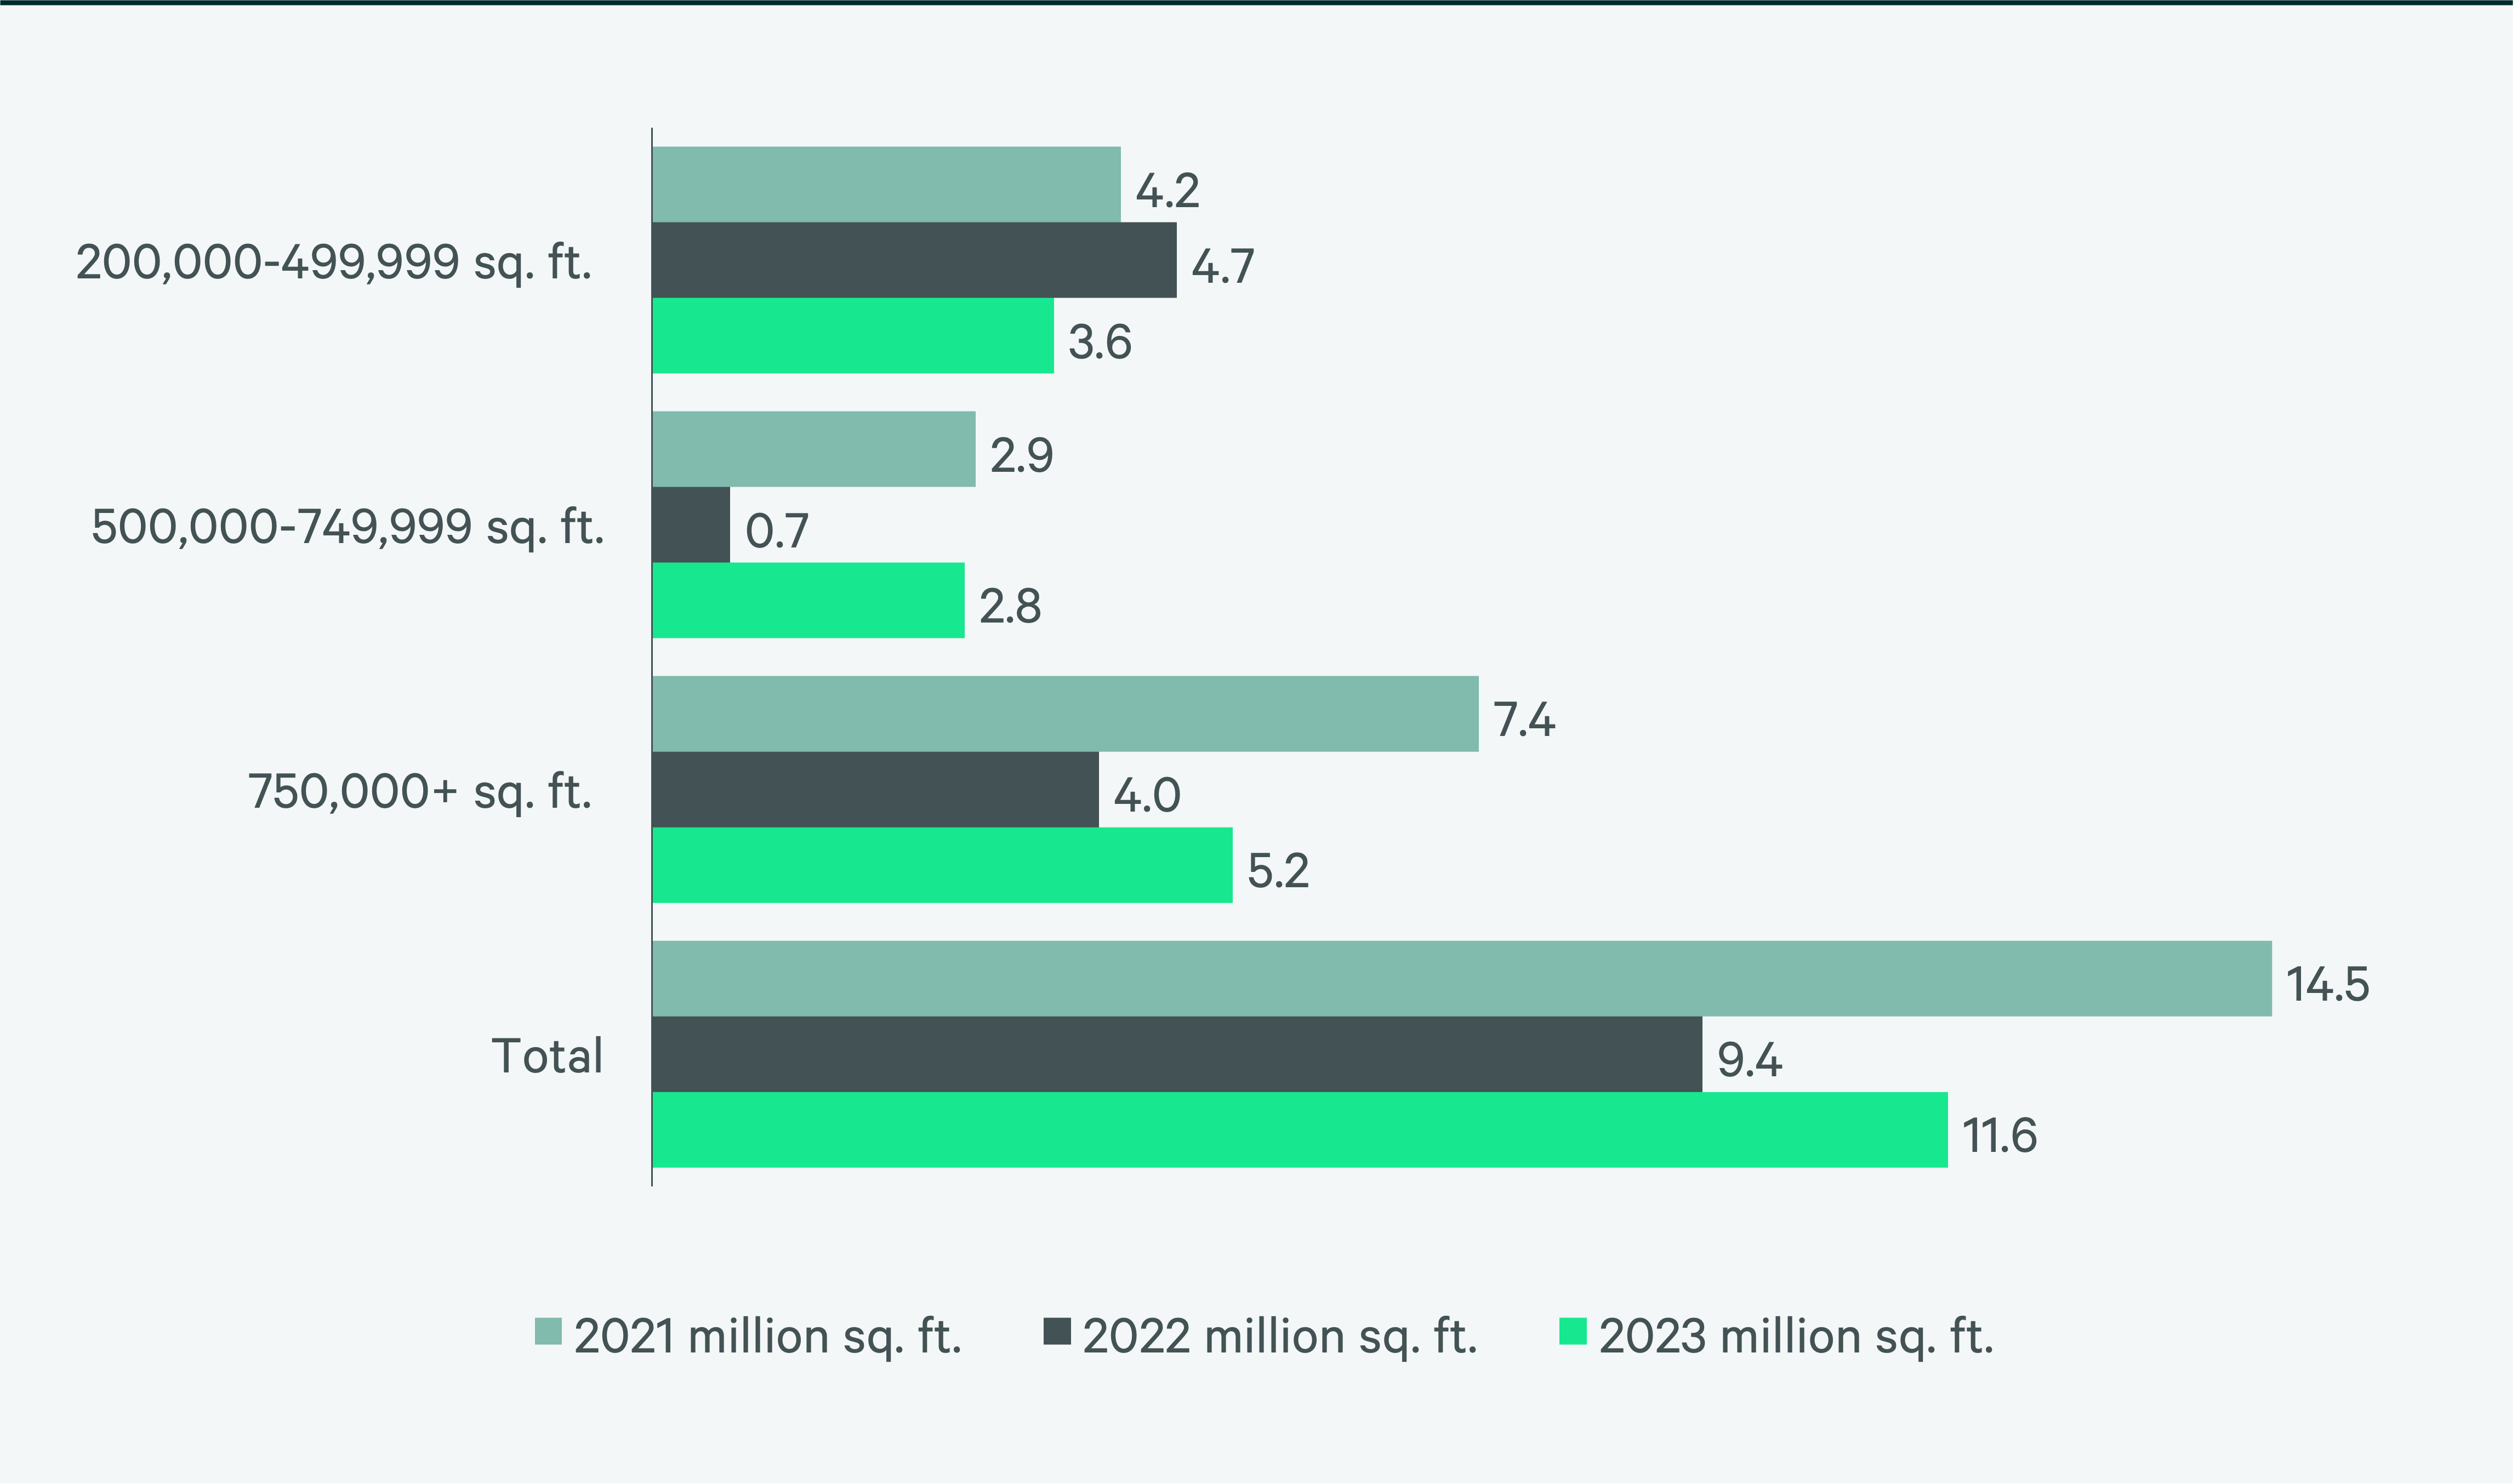
Source: CBRE Research.
Figure 6: 2023 Construction Completions vs. Overall Net Absorption by Size Range
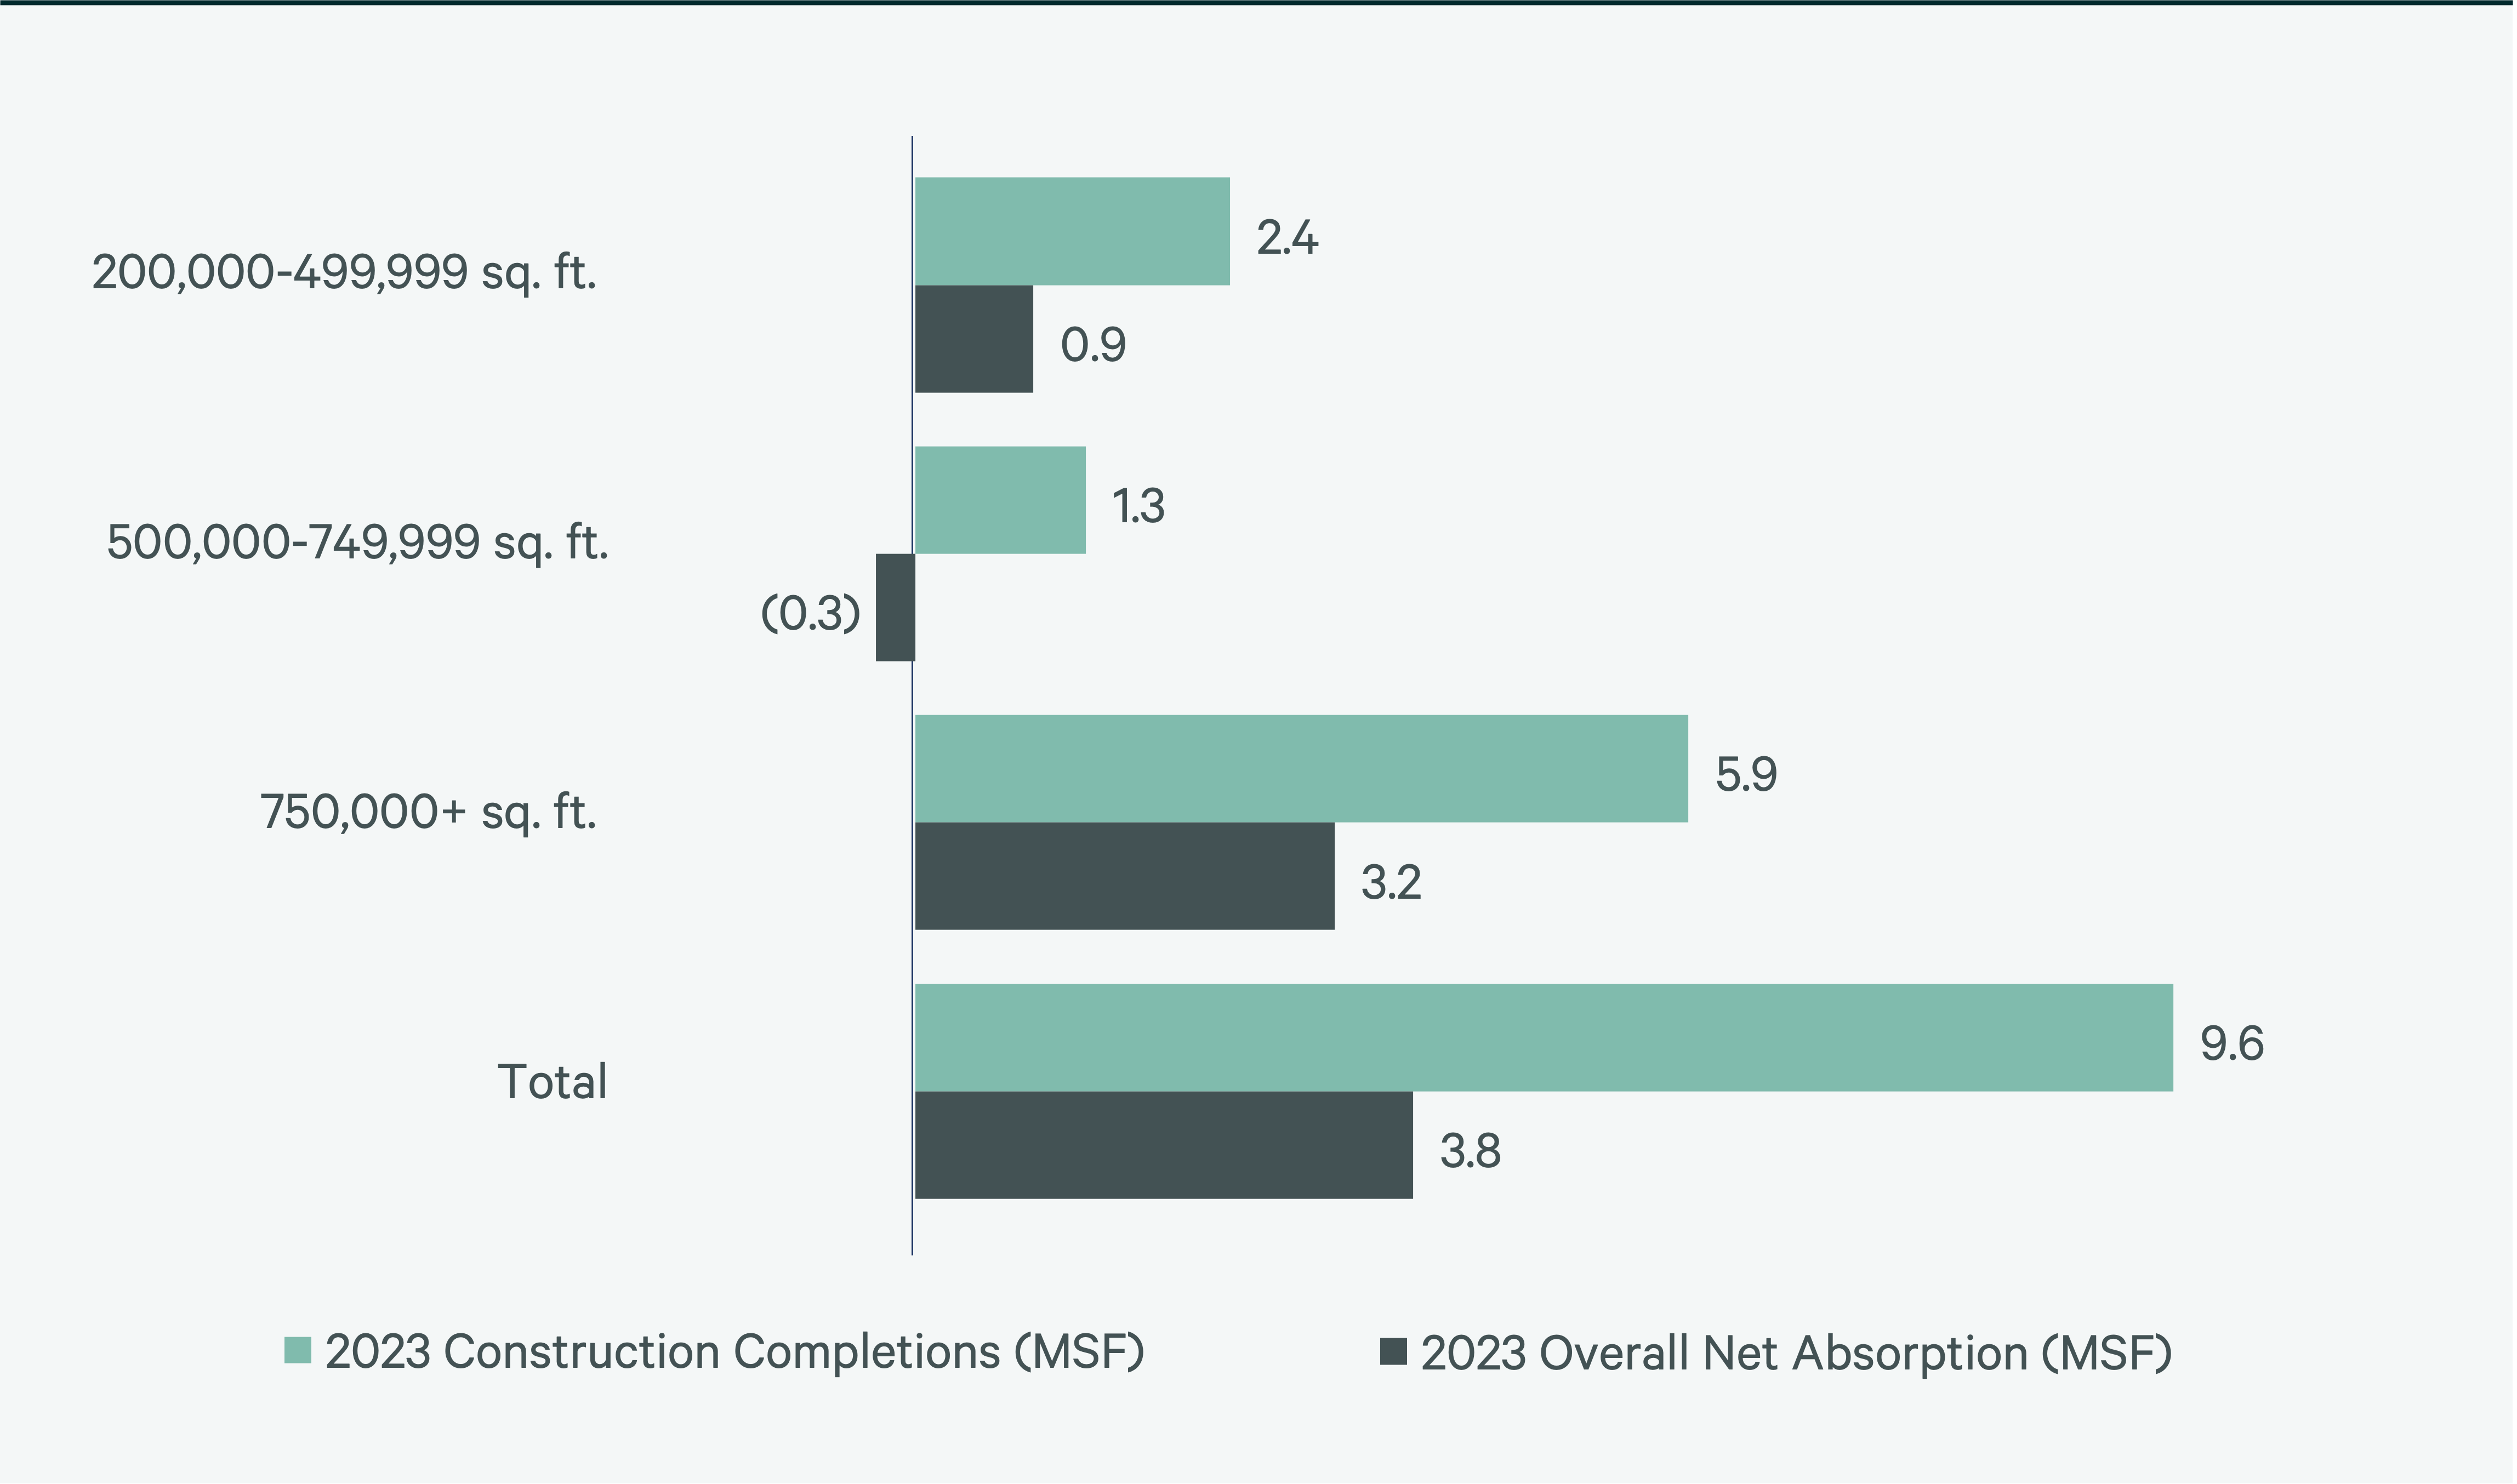
Figure 7: Direct Vacancy Rate by Size Range
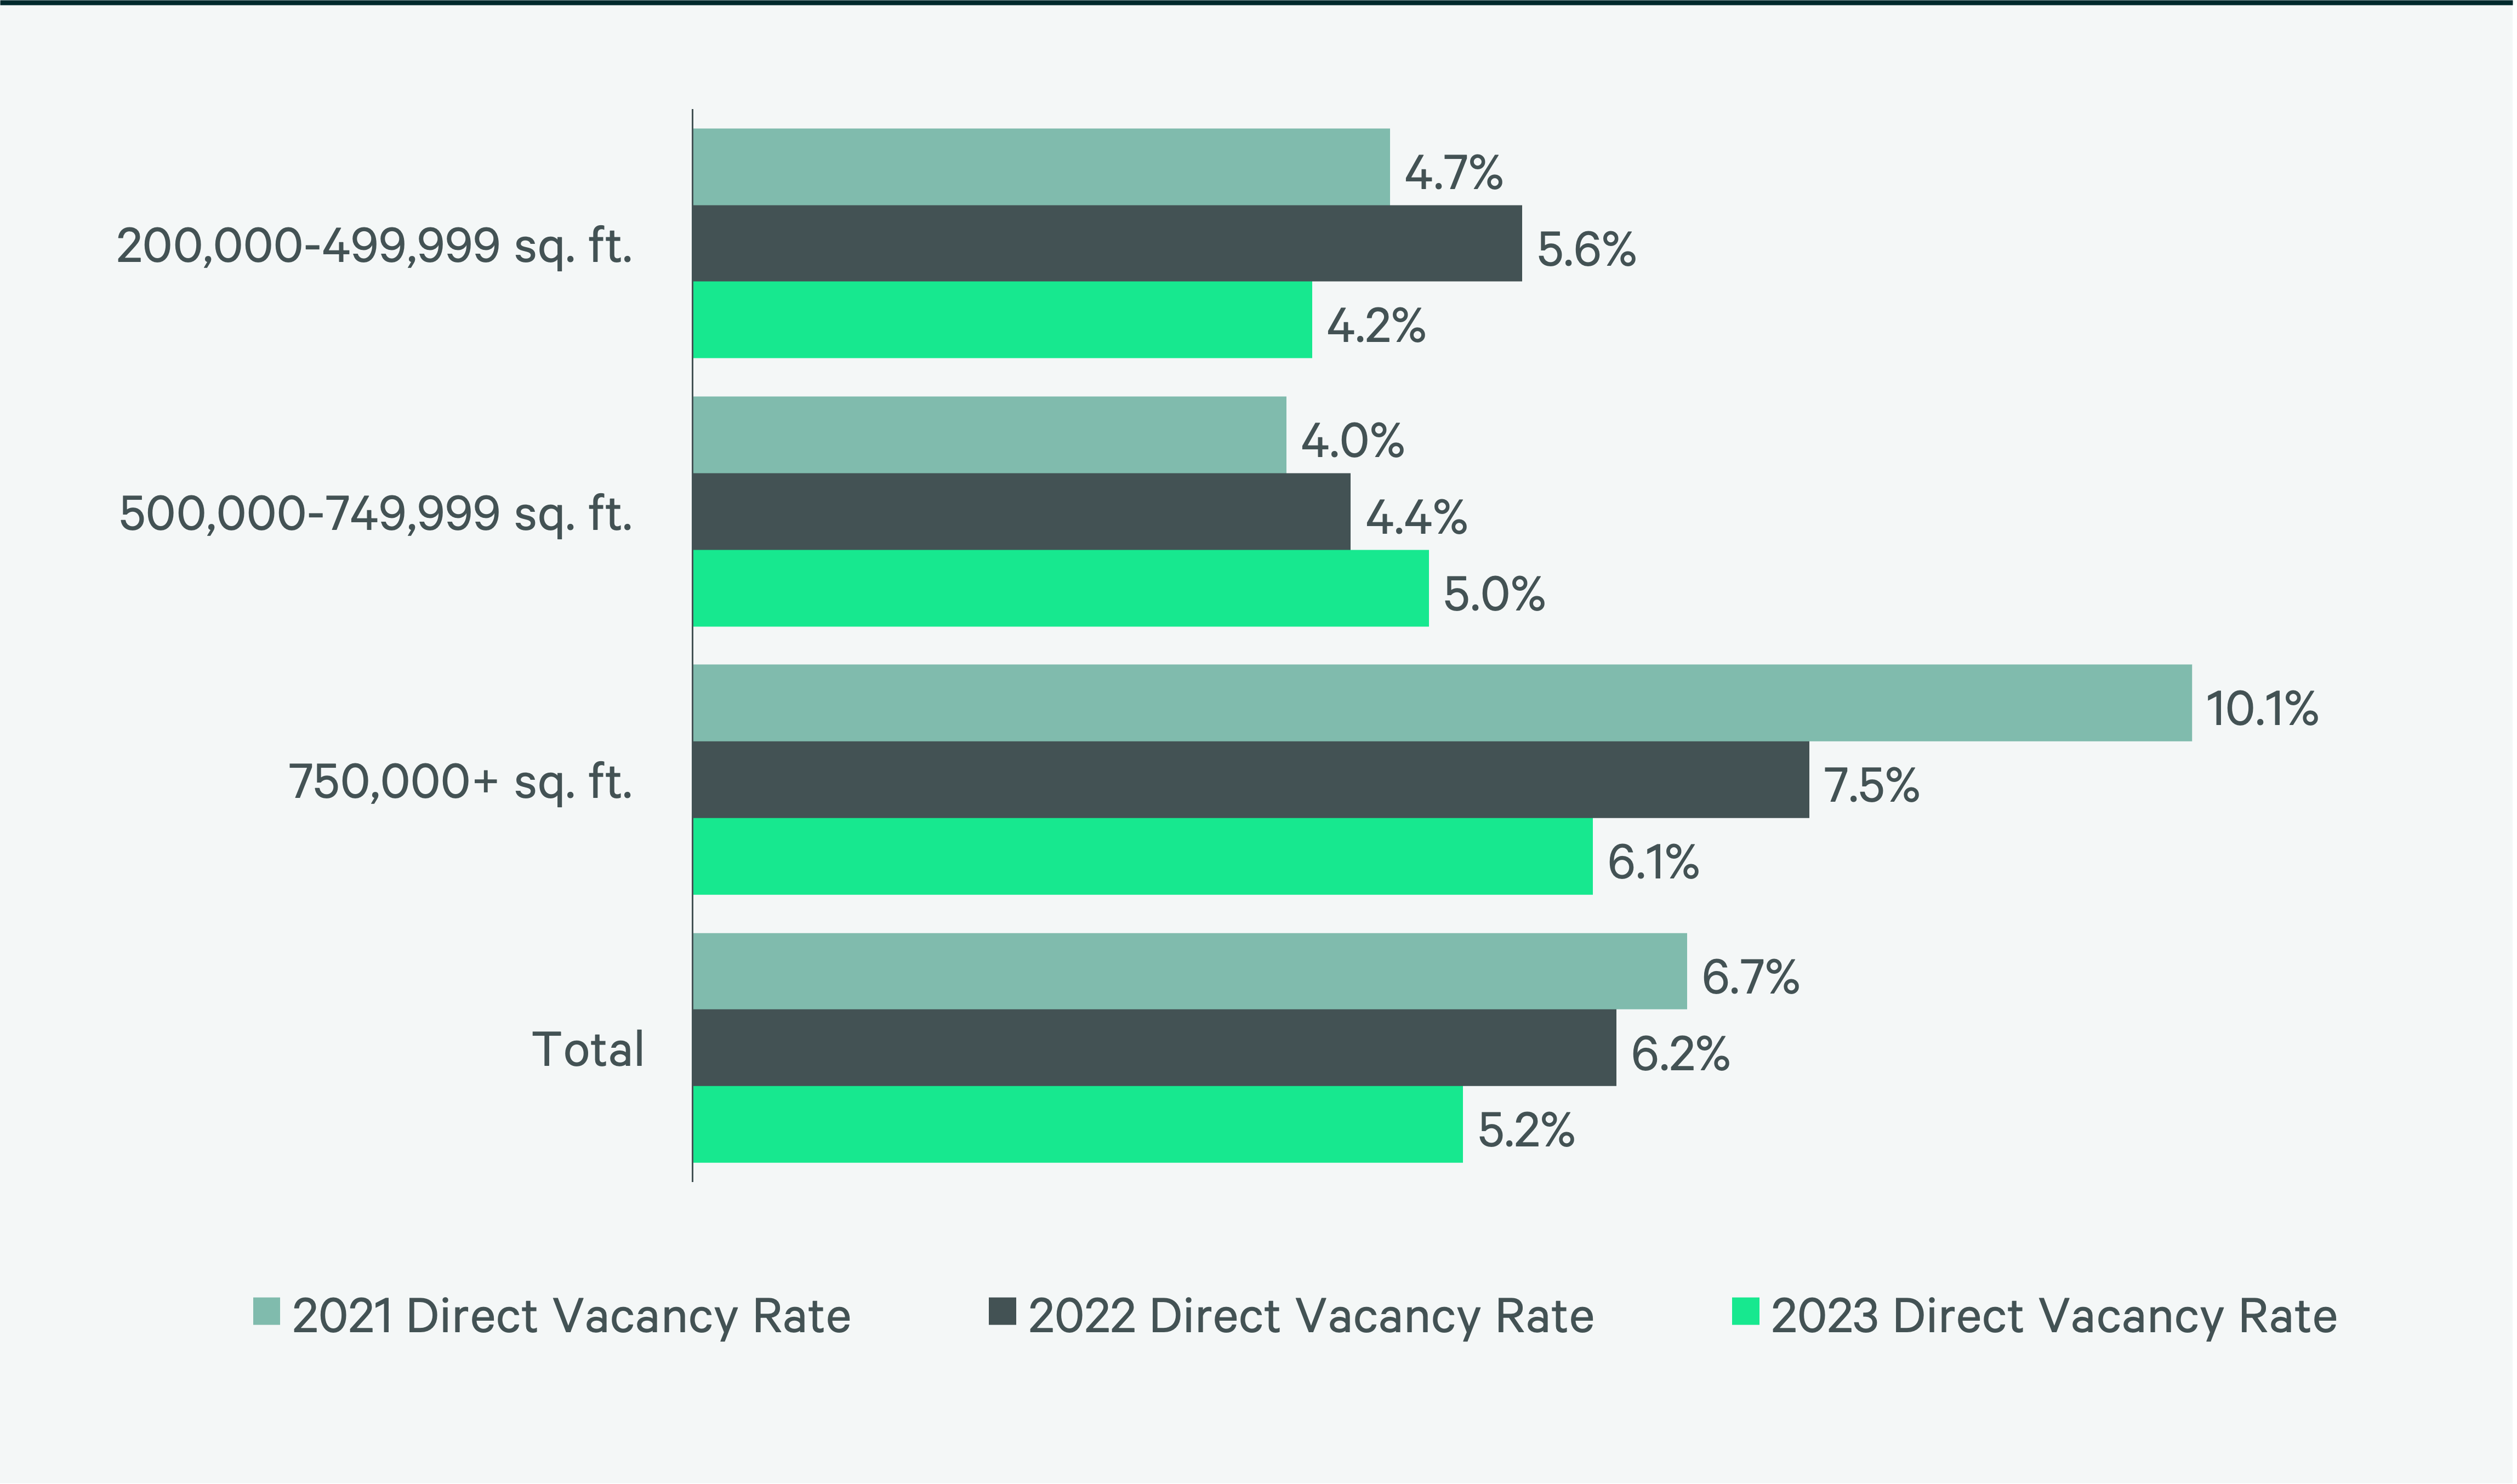
Figure 8: Under Construction & Percentage Preleased
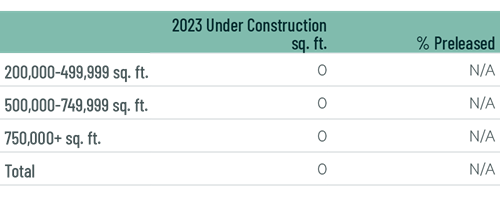
Figure 9: First Year Taking Rents (psf/yr)
Source: CBRE Research.
Explore Big-Box Insights by Market
-

Kansas City’s biggest draw is its easy reach to a large portion of the country.
-

Nearly 30 million people—24% aged 18-34—live within 250 miles of downtown Louisville.
-

Nearly 3 million people live within 50 miles of the market’s core but, like many Midwest markets, this is expected to decline by 0.2% over the next five years.
Industrial & Logistics Research
James Breeze
Vice President, Global Industrial and Retail Research

John Morris
President, Americas Industrial & Logistics, Advisory Services