Future Cities
Southern New Jersey/Eastern Pennsylvania
2024 North America Industrial Big-Box Review & Outlook
April 29, 2024 5 Minute Read

Demographics
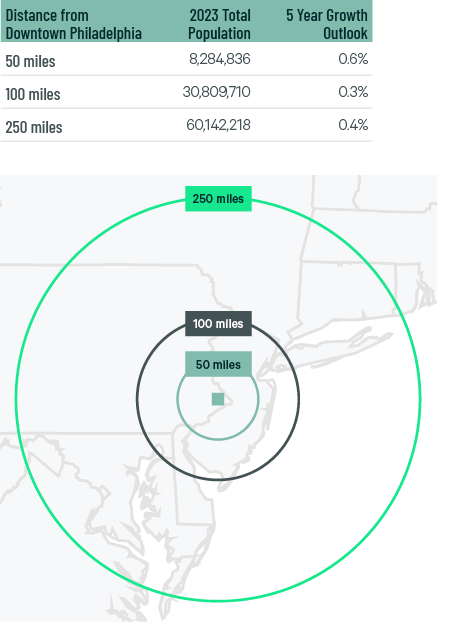
Over 8 million people live within 50 miles of the market’s core, and 60 million are within 250 miles—the second-most in the U.S. The region’s population is expected to grow by less than 1% over the next five years.
Figure 1: Southern New Jersey/Eastern Pennsylvania Population Analysis
The local warehouse labor force of 221,627 is expected to grow by 5.6% by 2034, according to CBRE Labor Analytics. The average wage for a non-supervisory warehouse worker is $18.11 per hour, 2.1% above the national average but 14% below Northern-Central New Jersey.
Figure 2: Southern New Jersey/Eastern Pennsylvania Warehouse & Storage Labor Fundamentals
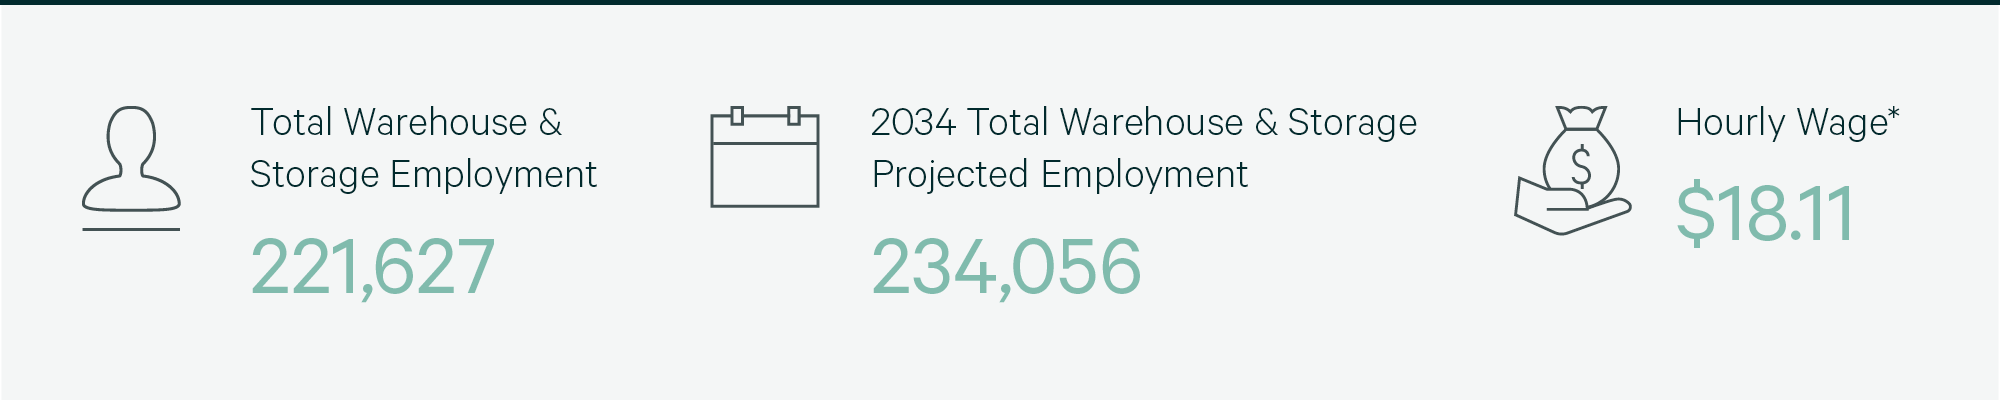
* Median wage (1 year experience); non-supervisory warehouse material handlers.
Location Incentives
Over the past five years, there have been over 300 economic incentives deals totaling more than $320 million for an average of $13,700 per new job in metro Philadelphia, according to fDi Intelligence.
CBRE’s Location Incentives Group reports that top incentive programs offered in Pennsylvania include the Job Creation Tax Credit (JCTC), offering corporate income tax credits to companies that create at least 25 new jobs or expand existing employment by 25%. The tax credit ranges up to $5,000 per employee for each new job created.
Another program available in New Jersey is the Emerge Program. Enacted under the Economic Recovery Act of 2020, this replaces the Grow NJ program that sunsets March 1, 2027. This program provides state corporate income tax credits for new and retained jobs for up to seven years. Target industries must create at least 25 net new full-time jobs. Non-targeted industries must create at least 35 net new full-time jobs.
Figure 3: Southern New Jersey/Eastern Pennsylvania Top Incentive Programs
Note: The extent, if any, of state and local incentive offerings depends on location and scope of the operation.
Logistics Driver
The region is centrally located along the East Coast, with access to three major ports: the Port of New York and New Jersey, the Port of Baltimore and the Port of Philadelphia. Two Class 1 railroads serve the region: Norfolk Southern and CSX. Approximately 100 major interstate interchanges are located within the region. The area has direct access to several international airports, making it one of the country’s top air cargo markets. Lehigh Valley International is still ranked as one of the fastest-growing cargo airports in the U.S. by Airports Council International.

Approximately 100 major interstate interchanges are located within the region. The area has direct access to several international airports, making it one of the country’s top air cargo markets.
Supply & Demand
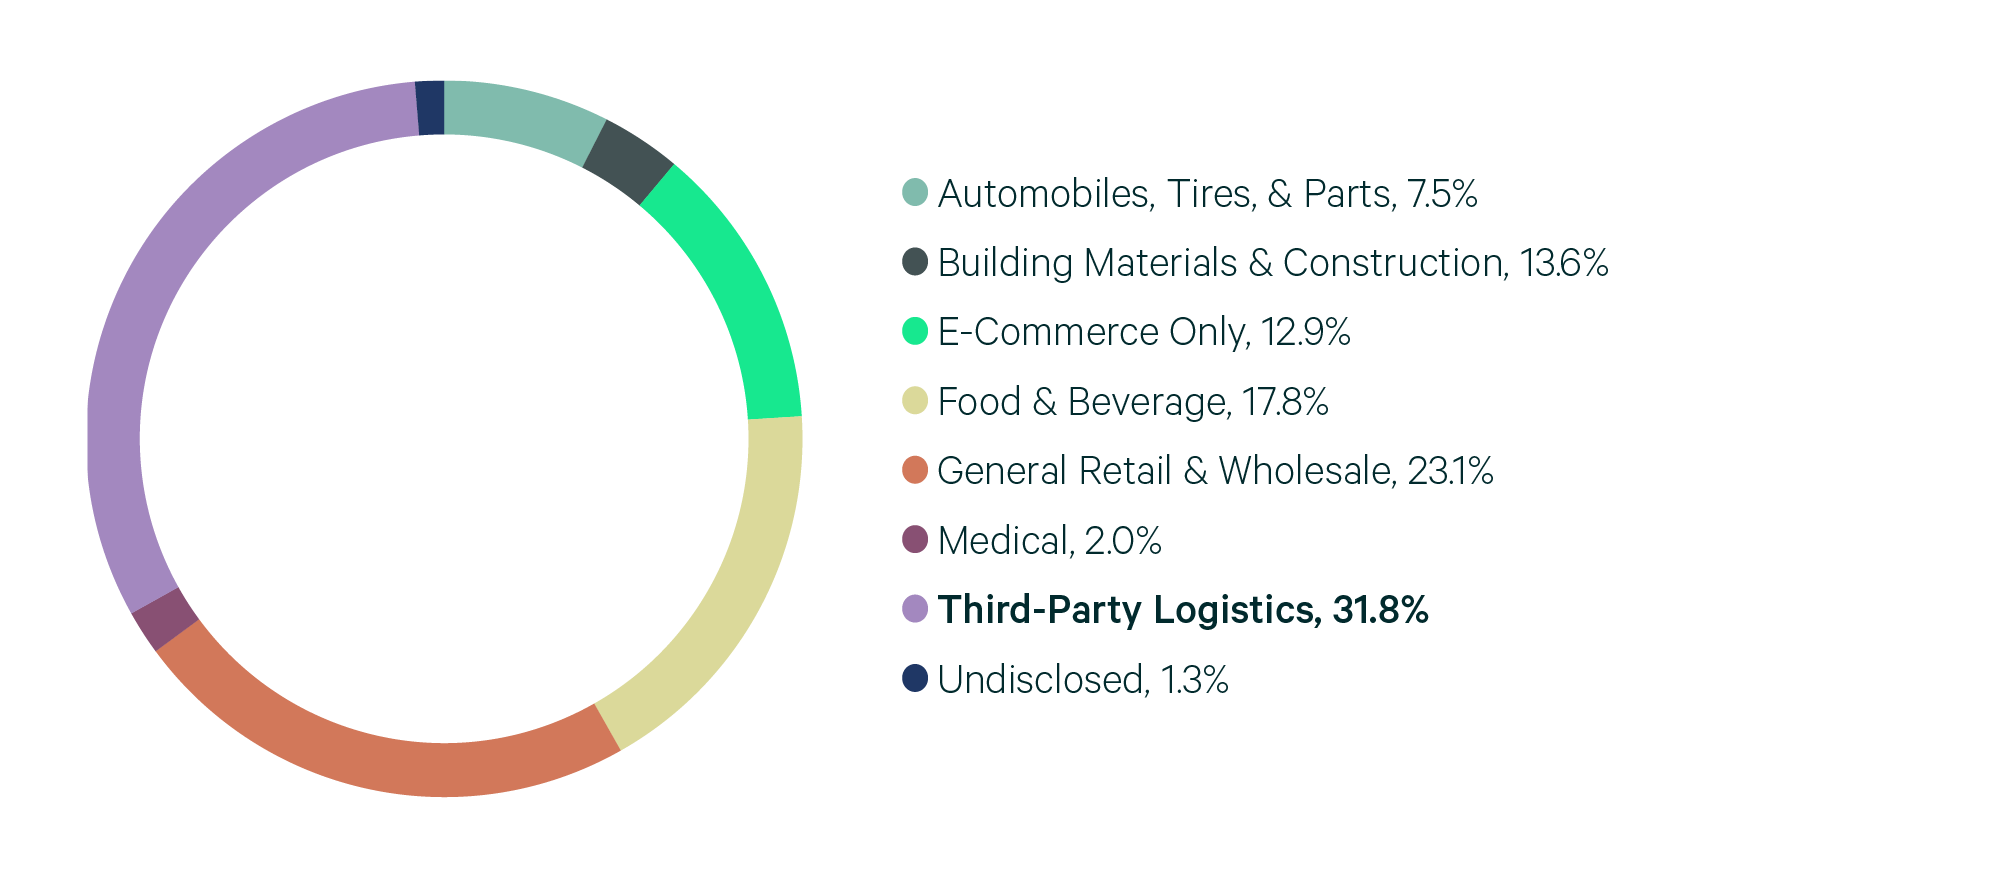
Southern New Jersey/Eastern Pennsylvania is the second-largest big-box market in North America, with 560 million sq. ft. of total inventory. Just over 33.4 million sq. ft. leased in 2023, including more than 13.6 million sq. ft. in transactions over 750,000 sq. ft., the highest in North America. Total big-box leasing increased 2.6% year-over-year, and leasing of spaces 750,000 sq. ft. and larger doubled year-over-year. Despite robust leasing activity, net absorption declined to 18 million sq. ft. This decline, combined with 41.4 million sq. ft. of completed construction, raised the vacancy rate from 4% in 2022 to 7.6%. A diverse set of occupiers leased big-box space in 2023, led by 3PLs transacting 31.8% of space. This market had the highest percentage of e-commerce-only occupiers in this report, accounting for 12.9% of total volume.
The market’s abundant logistics drivers and large surrounding population will continue to make it the most in-demand big-box region in the Northeast. At the end of the year, only 10.1 million sq. ft. of big-box space was under construction. This is expected to lead to reductions in vacancy and continued rent growth for big-box facilities in 2024.
Figure 4: Share of 2023 Leasing by Occupier Type
Source: CBRE Research.
Figure 5: Lease Transaction Volume by Size Range
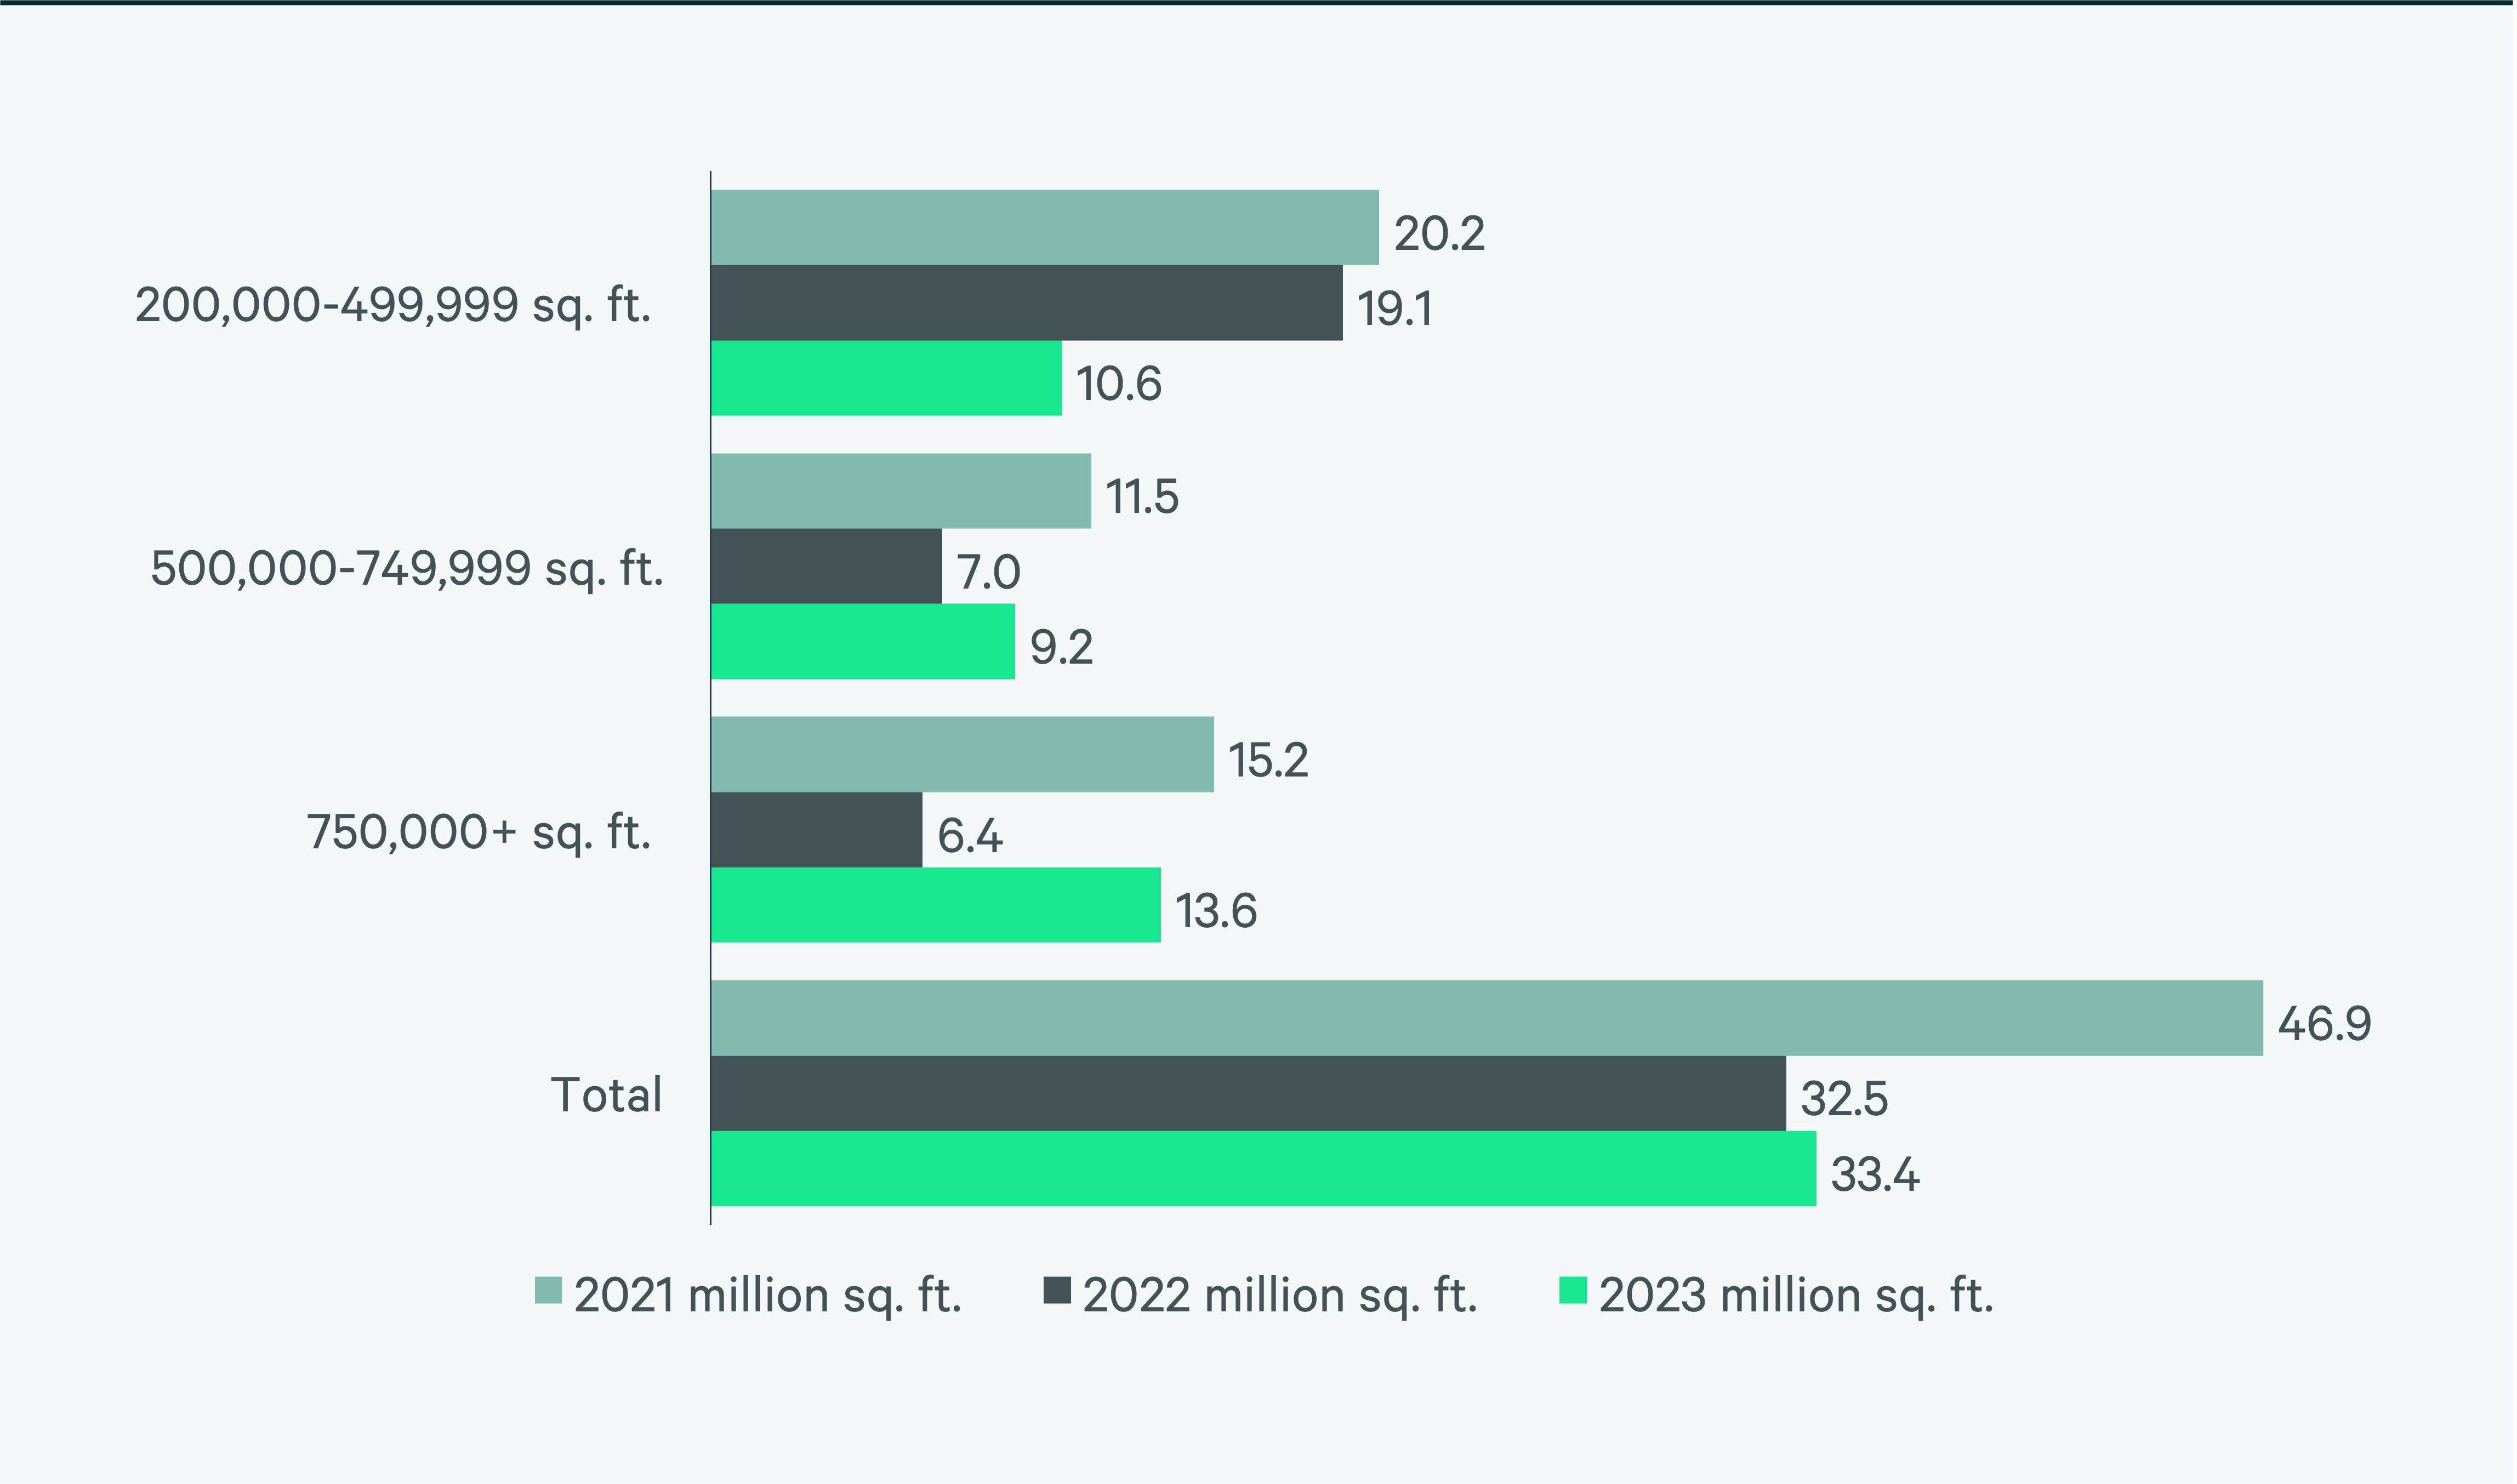
Source: CBRE Research.
Figure 6: 2023 Construction Completions vs. Overall Net Absorption by Size Range
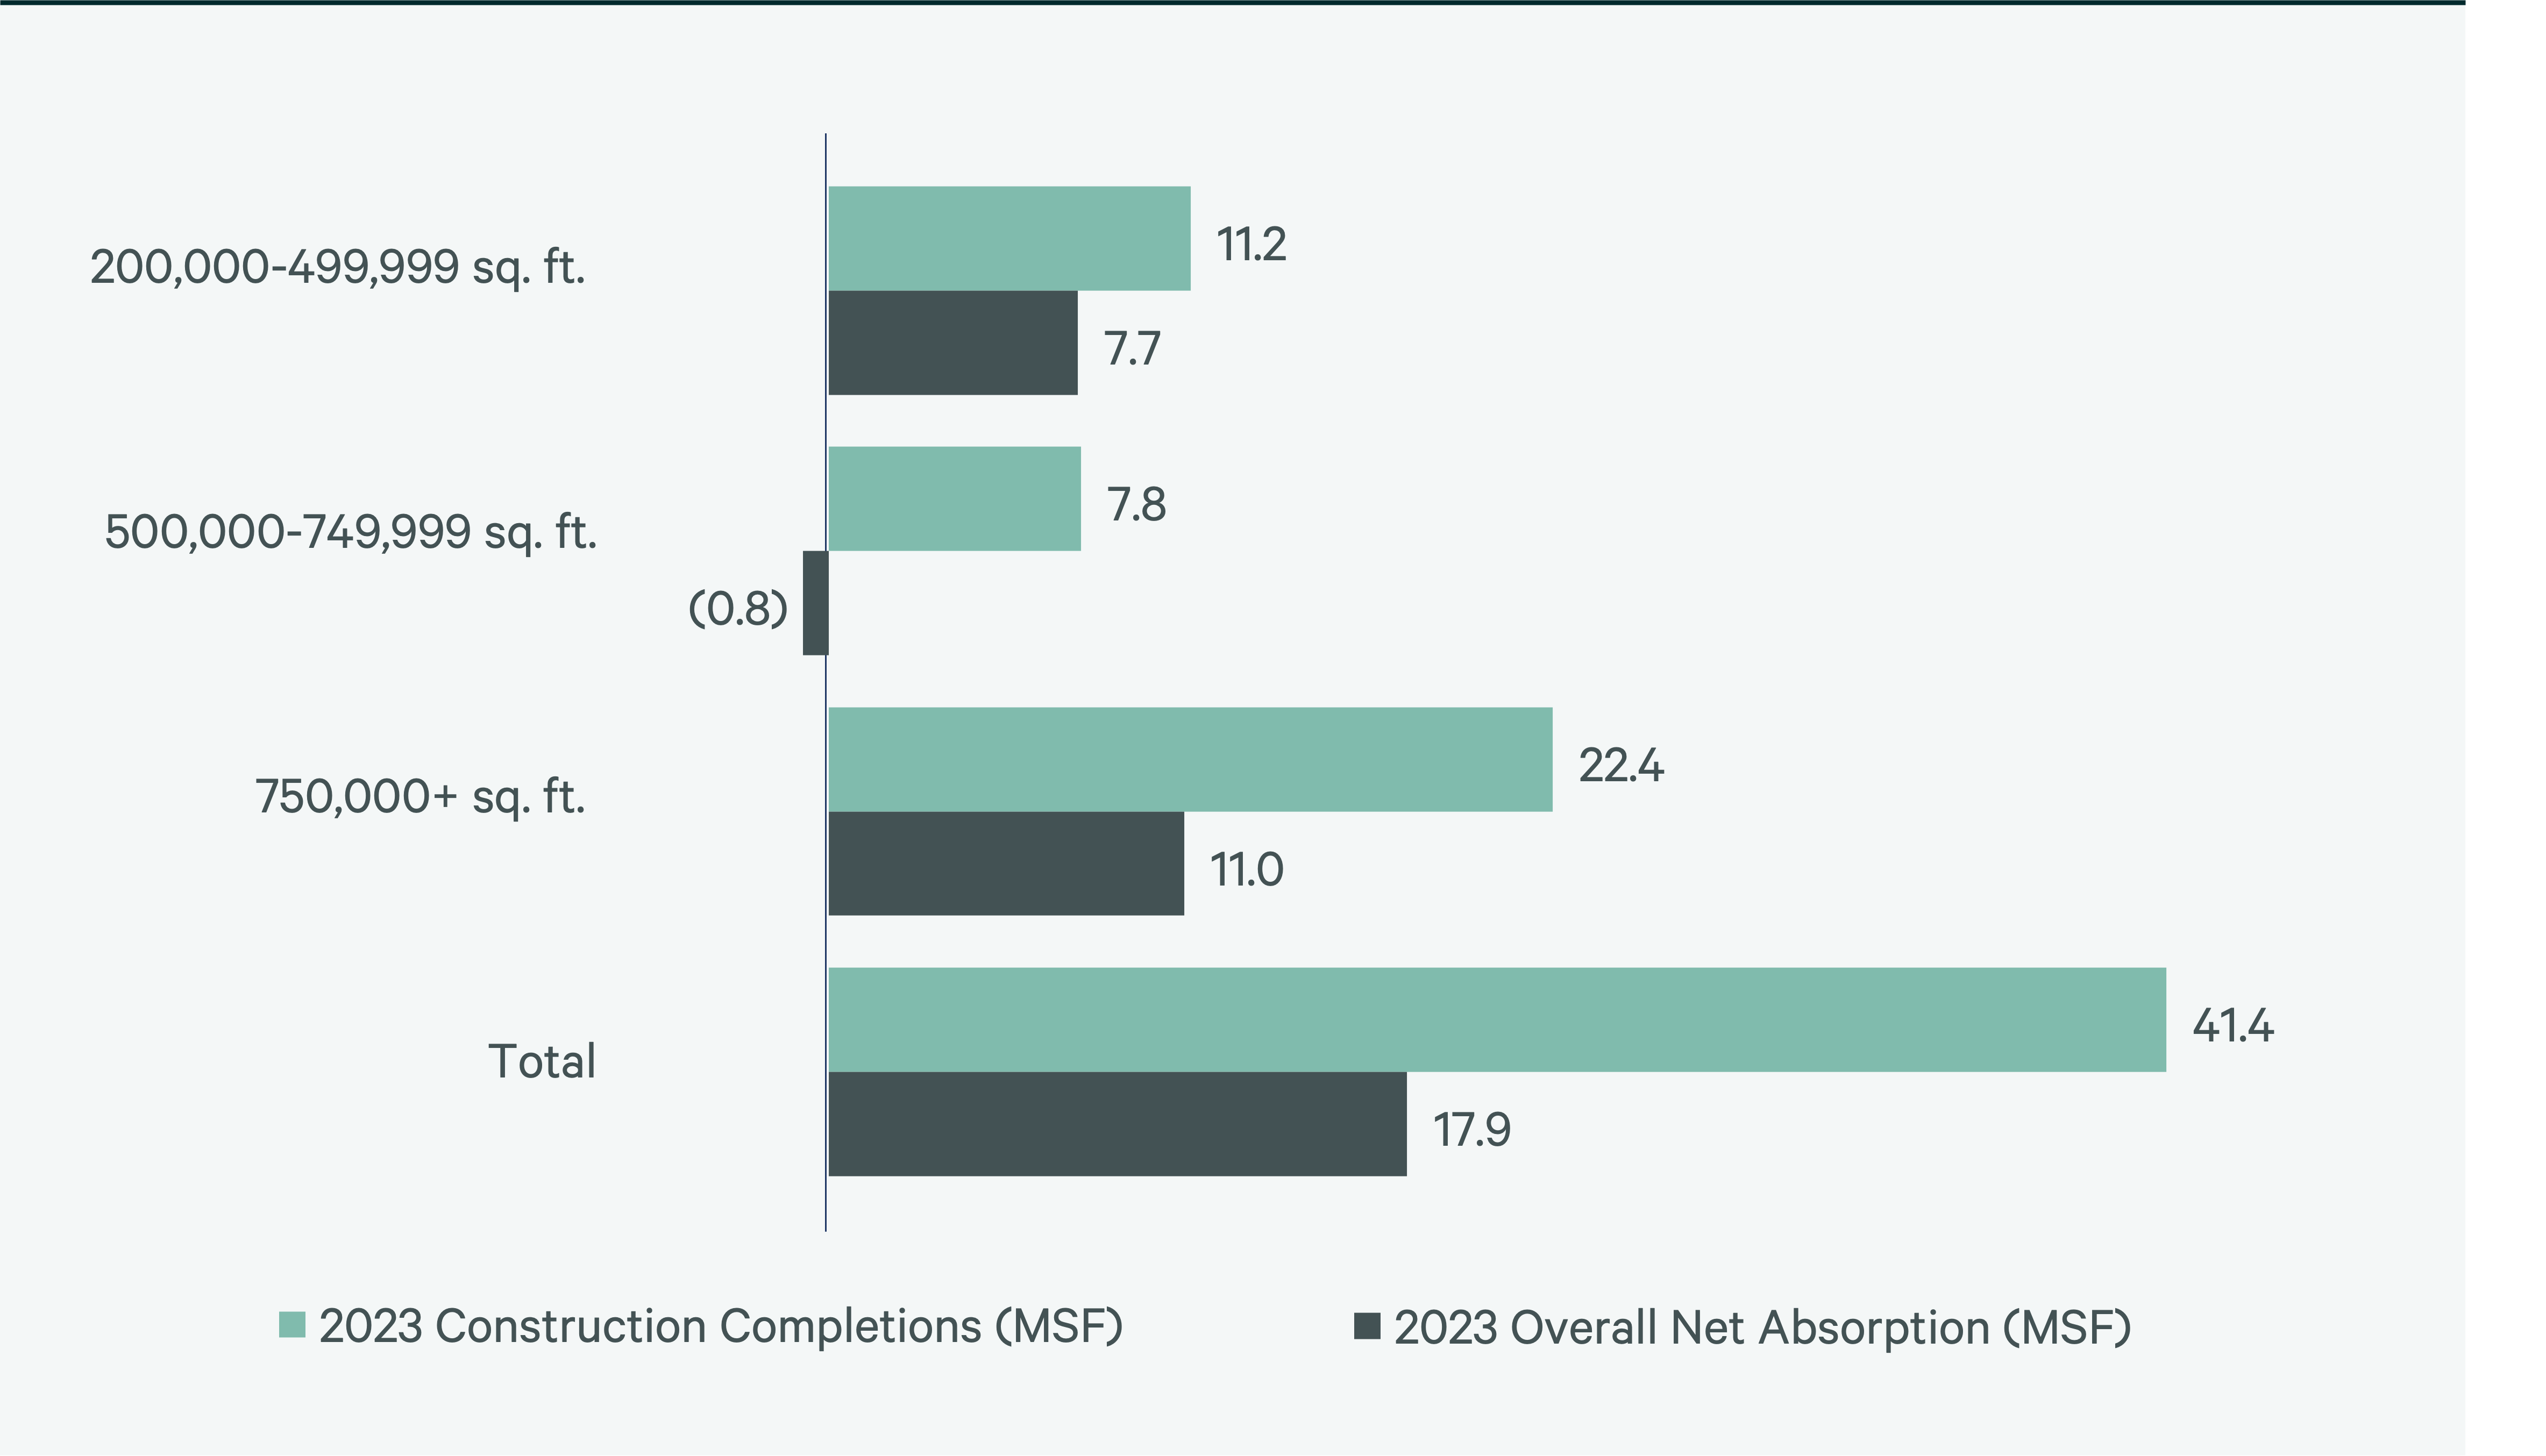
Figure 7: Direct Vacancy Rate by Size Range
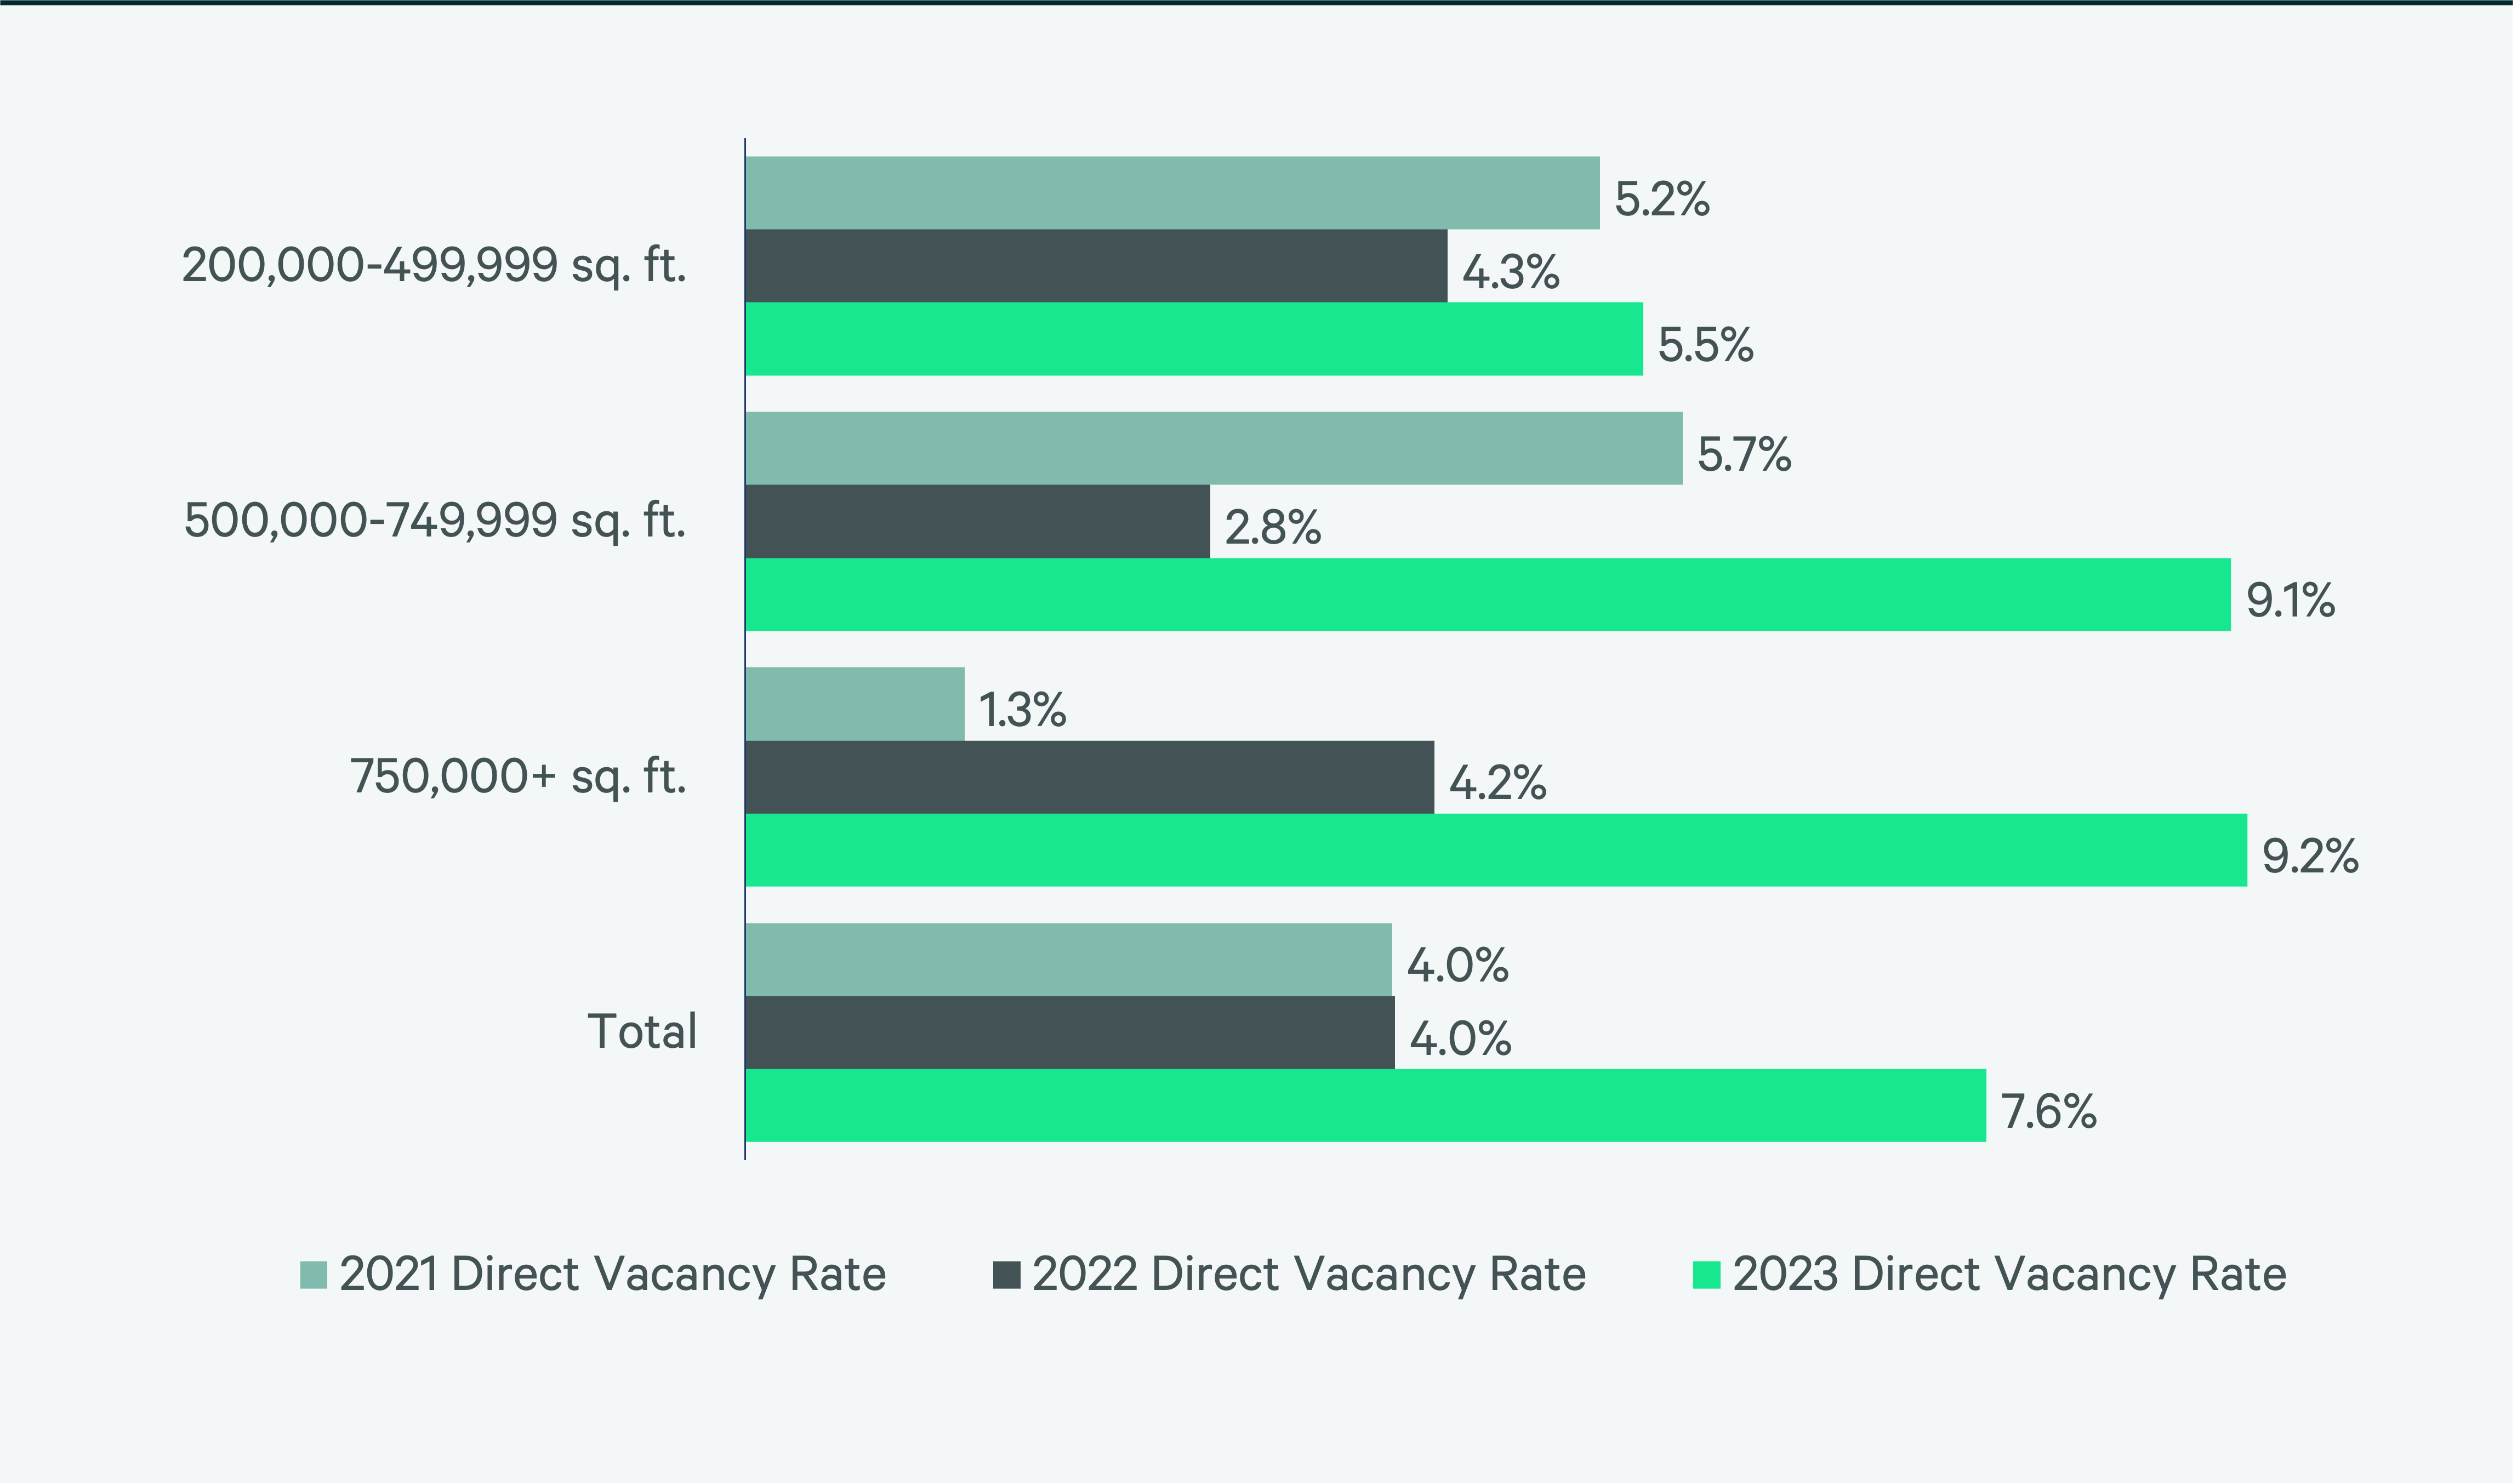
Figure 8: Under Construction & Percentage Preleased

Figure 9: First Year Taking Rents (psf/yr)
Source: CBRE Research.
Explore Big-Box Insights by Market
-

More than 18 million people—23% aged 18-34—live within 100 miles of the market’s core, with a 1.6% projected five-year growth rate.
-

The Northern/Central New Jersey market serves the U.S.’s largest population within a 50-, 100- and 250-mile radius.
-

Around 9 million people live within 50 miles of the market’s core, the highest population concentration in Canada.
Industrial & Logistics Research
James Breeze
Vice President, Global Industrial and Retail Research

John Morris
President, Americas Industrial & Logistics, Advisory Services