Future Cities
Northern/Central New Jersey
2024 North America Industrial Big-Box Review & Outlook
April 29, 2024 5 Minute Read

Demographics
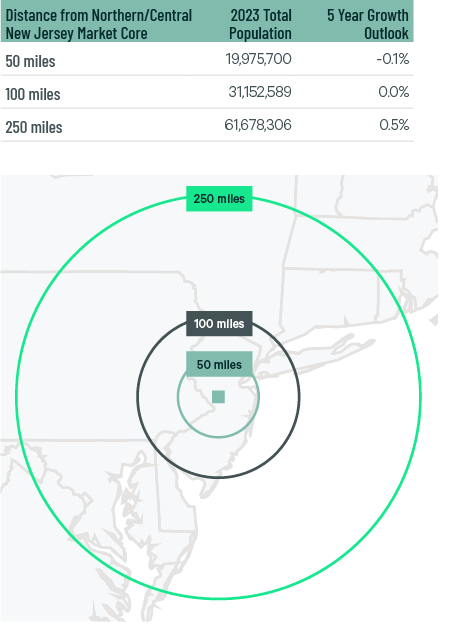
The Northern/Central New Jersey market serves the U.S.’s largest population within a 50-, 100- and 250-mile radius. While the population within 50 miles of the market’s core is projected to decline by 0.1% over five years, it will remain the largest.
Figure 1: Northern/Central New Jersey Population Analysis
The regional warehouse labor force of 358,826—the most in North America, according to CBRE Labor Analytics—is expected to grow by 9.9% by 2034. Due to robust labor demand, the average wage of a non-supervisory warehouse worker is $21.02 per hour, 18.5% above the national average.
Figure 2: Northern/Central New Jersey Warehouse & Storage Labor Fundamentals
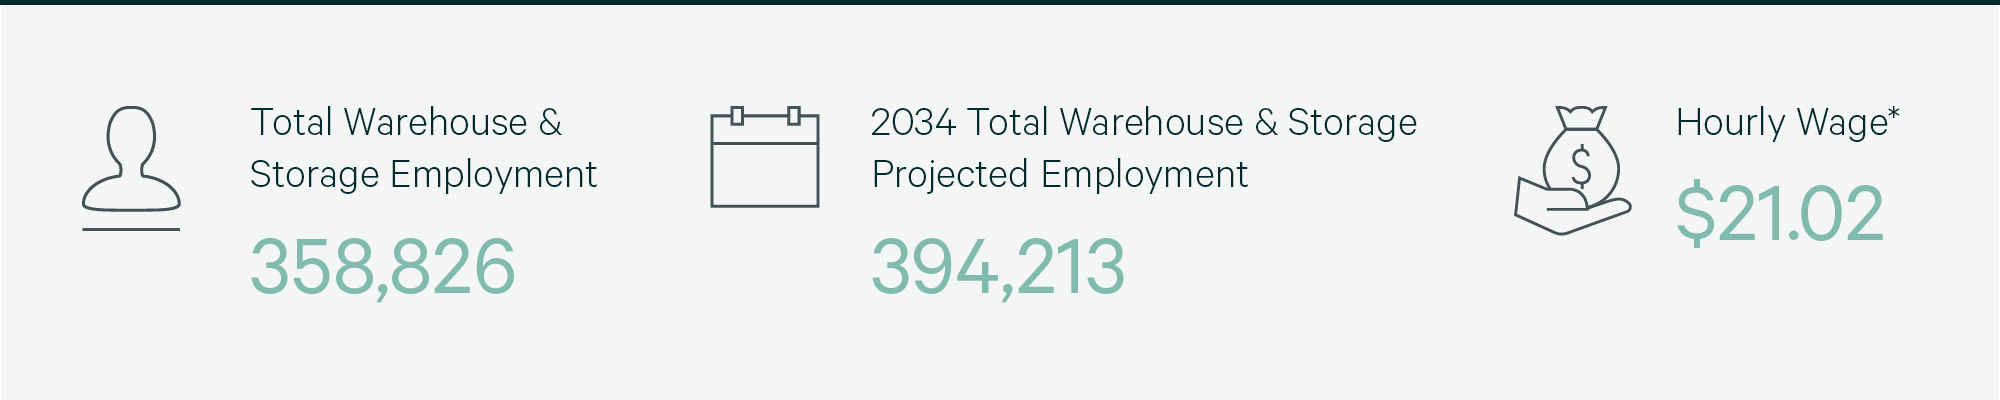
* Median wage (1 year experience); non-supervisory warehouse material handlers.
Location Incentives
CBRE’s Location Incentives Group reports that New Jersey State enacted legislation under the Economic Recovery Act of 2020 that replaces the Grow NJ program. Grow NJ sunsets on March 1, 2027. This program provides state corporate income tax credits for new and retained jobs for up to seven years under the following conditions:
- Tax credits can be used, sold or transferred for at least 85% of value. A business may sell the credits for 90% of value to the New Jersey Treasury, rather than to a third party.
- Legislation now requires a letter of support from the subject municipality and a public hearing for approval.
- Among additional program requirements, target industries must create at least 25 net new full-time jobs, and non-targeted industries must create at least 35 net new full-time jobs. Projects in qualified areas must retain 500+ full-time jobs, and projects in non-qualified areas must retain 1,000+ full-time jobs.
- At least $60 per square foot must be spent on new construction, while at least $20 per square foot must be spent on existing warehousing, logistics, industrial or R&D facilities.
Local municipalities may offer further tax abatement and tax increment financing for selected specialized projects.
Figure 3: Northern/Central New Jersey Top Incentive Programs
Note: The extent, if any, of state and local incentive offerings depends on location and scope of the operation.
Logistics Driver
The Port Authority of New York and New Jersey is the East Coast’s busiest and second most-active seaport in the U.S., with infrastructure to move cargo by air, land, rail and sea. The port has direct access to over 28 million consumers.
Five airports have direct cargo lines to the port, including John F. Kennedy, Newark Liberty, LaGuardia, New York Stewart and Teterboro. Numerous bridges and tunnels near the port provide access to the tri-state area and beyond.

Five airports have direct cargo lines to the Port Authority of New York and New Jersey. Numerous bridges and tunnels near the port provide access to the tri-state area and beyond.
Supply & Demand
Northern/Central New Jersey is the sixth-largest North American industrial market, with 370 million sq. ft. of total inventory. There was 9.2 million sq. ft. of lease transactions in 2023, around half of 2022’s volume. The vacancy rate increased to 5.1% in 2023, more than double 2022’s 2.4% rate, due to a mix of less leasing, more move-outs and 11.6 million sq. ft. of construction completions. Higher vacancies also stabilized taking rents, which finished the year at $15.09 psf/yr, slightly higher than 2022’s $14.99 psf/yr. General retailers & wholesalers seeking to shore up inventories near the largest population concentration in the U.S. were the most active occupiers, accounting for 49.4% of lease volume.
With only 6.8 million sq. ft. of space under construction, big-box completions should return to pre-pandemic levels, leading to vacancy rate stabilization this year. Lease transaction volume should improve as economic clarity and continued solid retail sales lead occupiers to restart expansion plans. They will seek to service the highest population concentration in the U.S.
Figure 4: Share of 2023 Leasing by Occupier Type
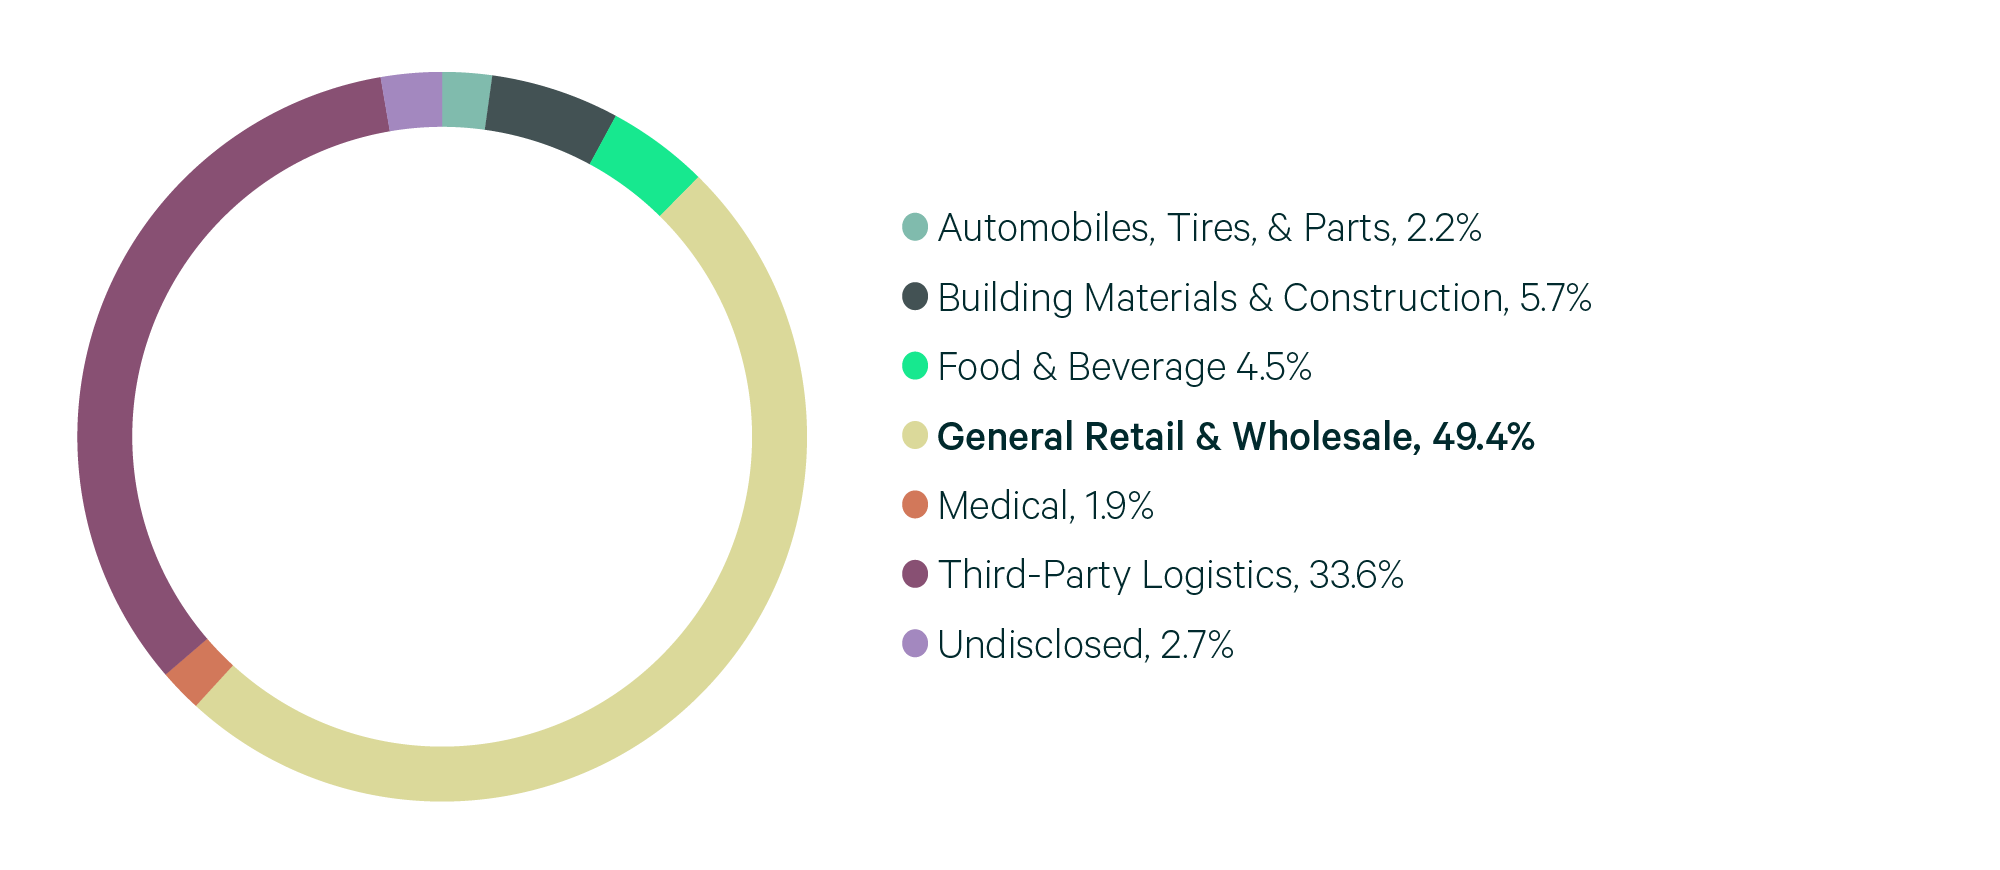
Source: CBRE Research.
Figure 5: Lease Transaction Volume by Size Range
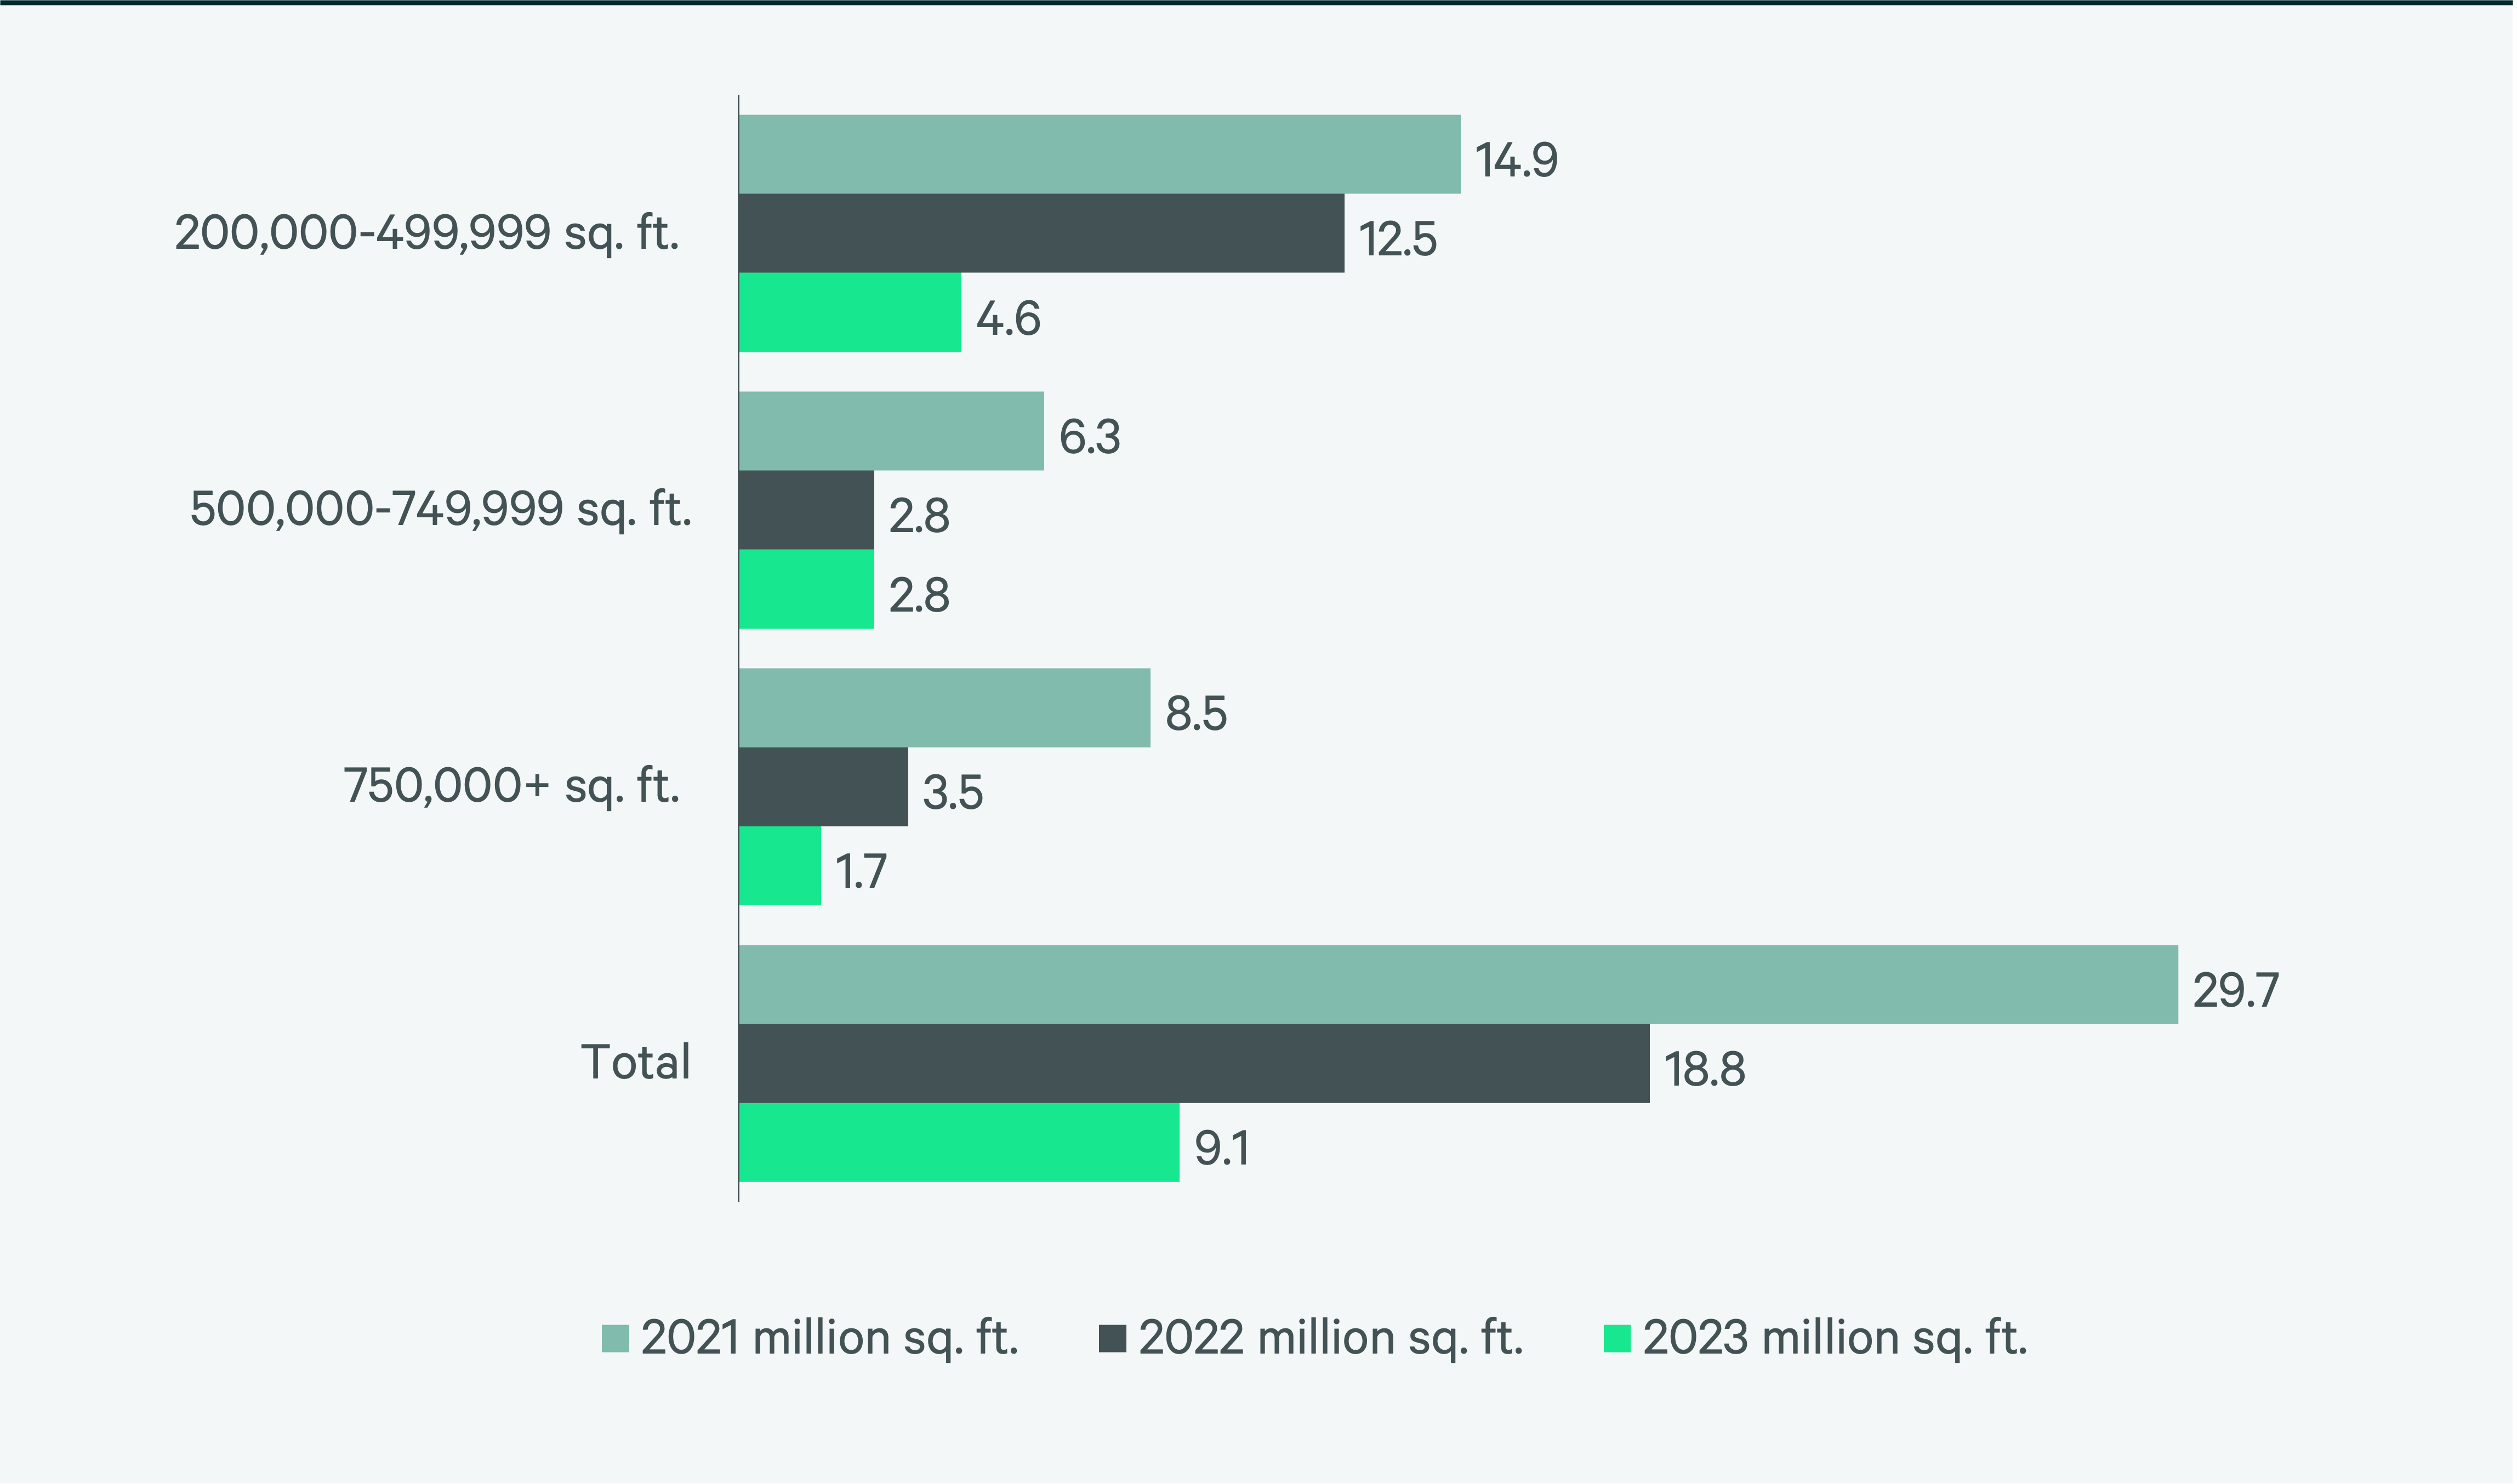
Source: CBRE Research.
Figure 6: 2023 Construction Completions vs. Overall Net Absorption by Size Range
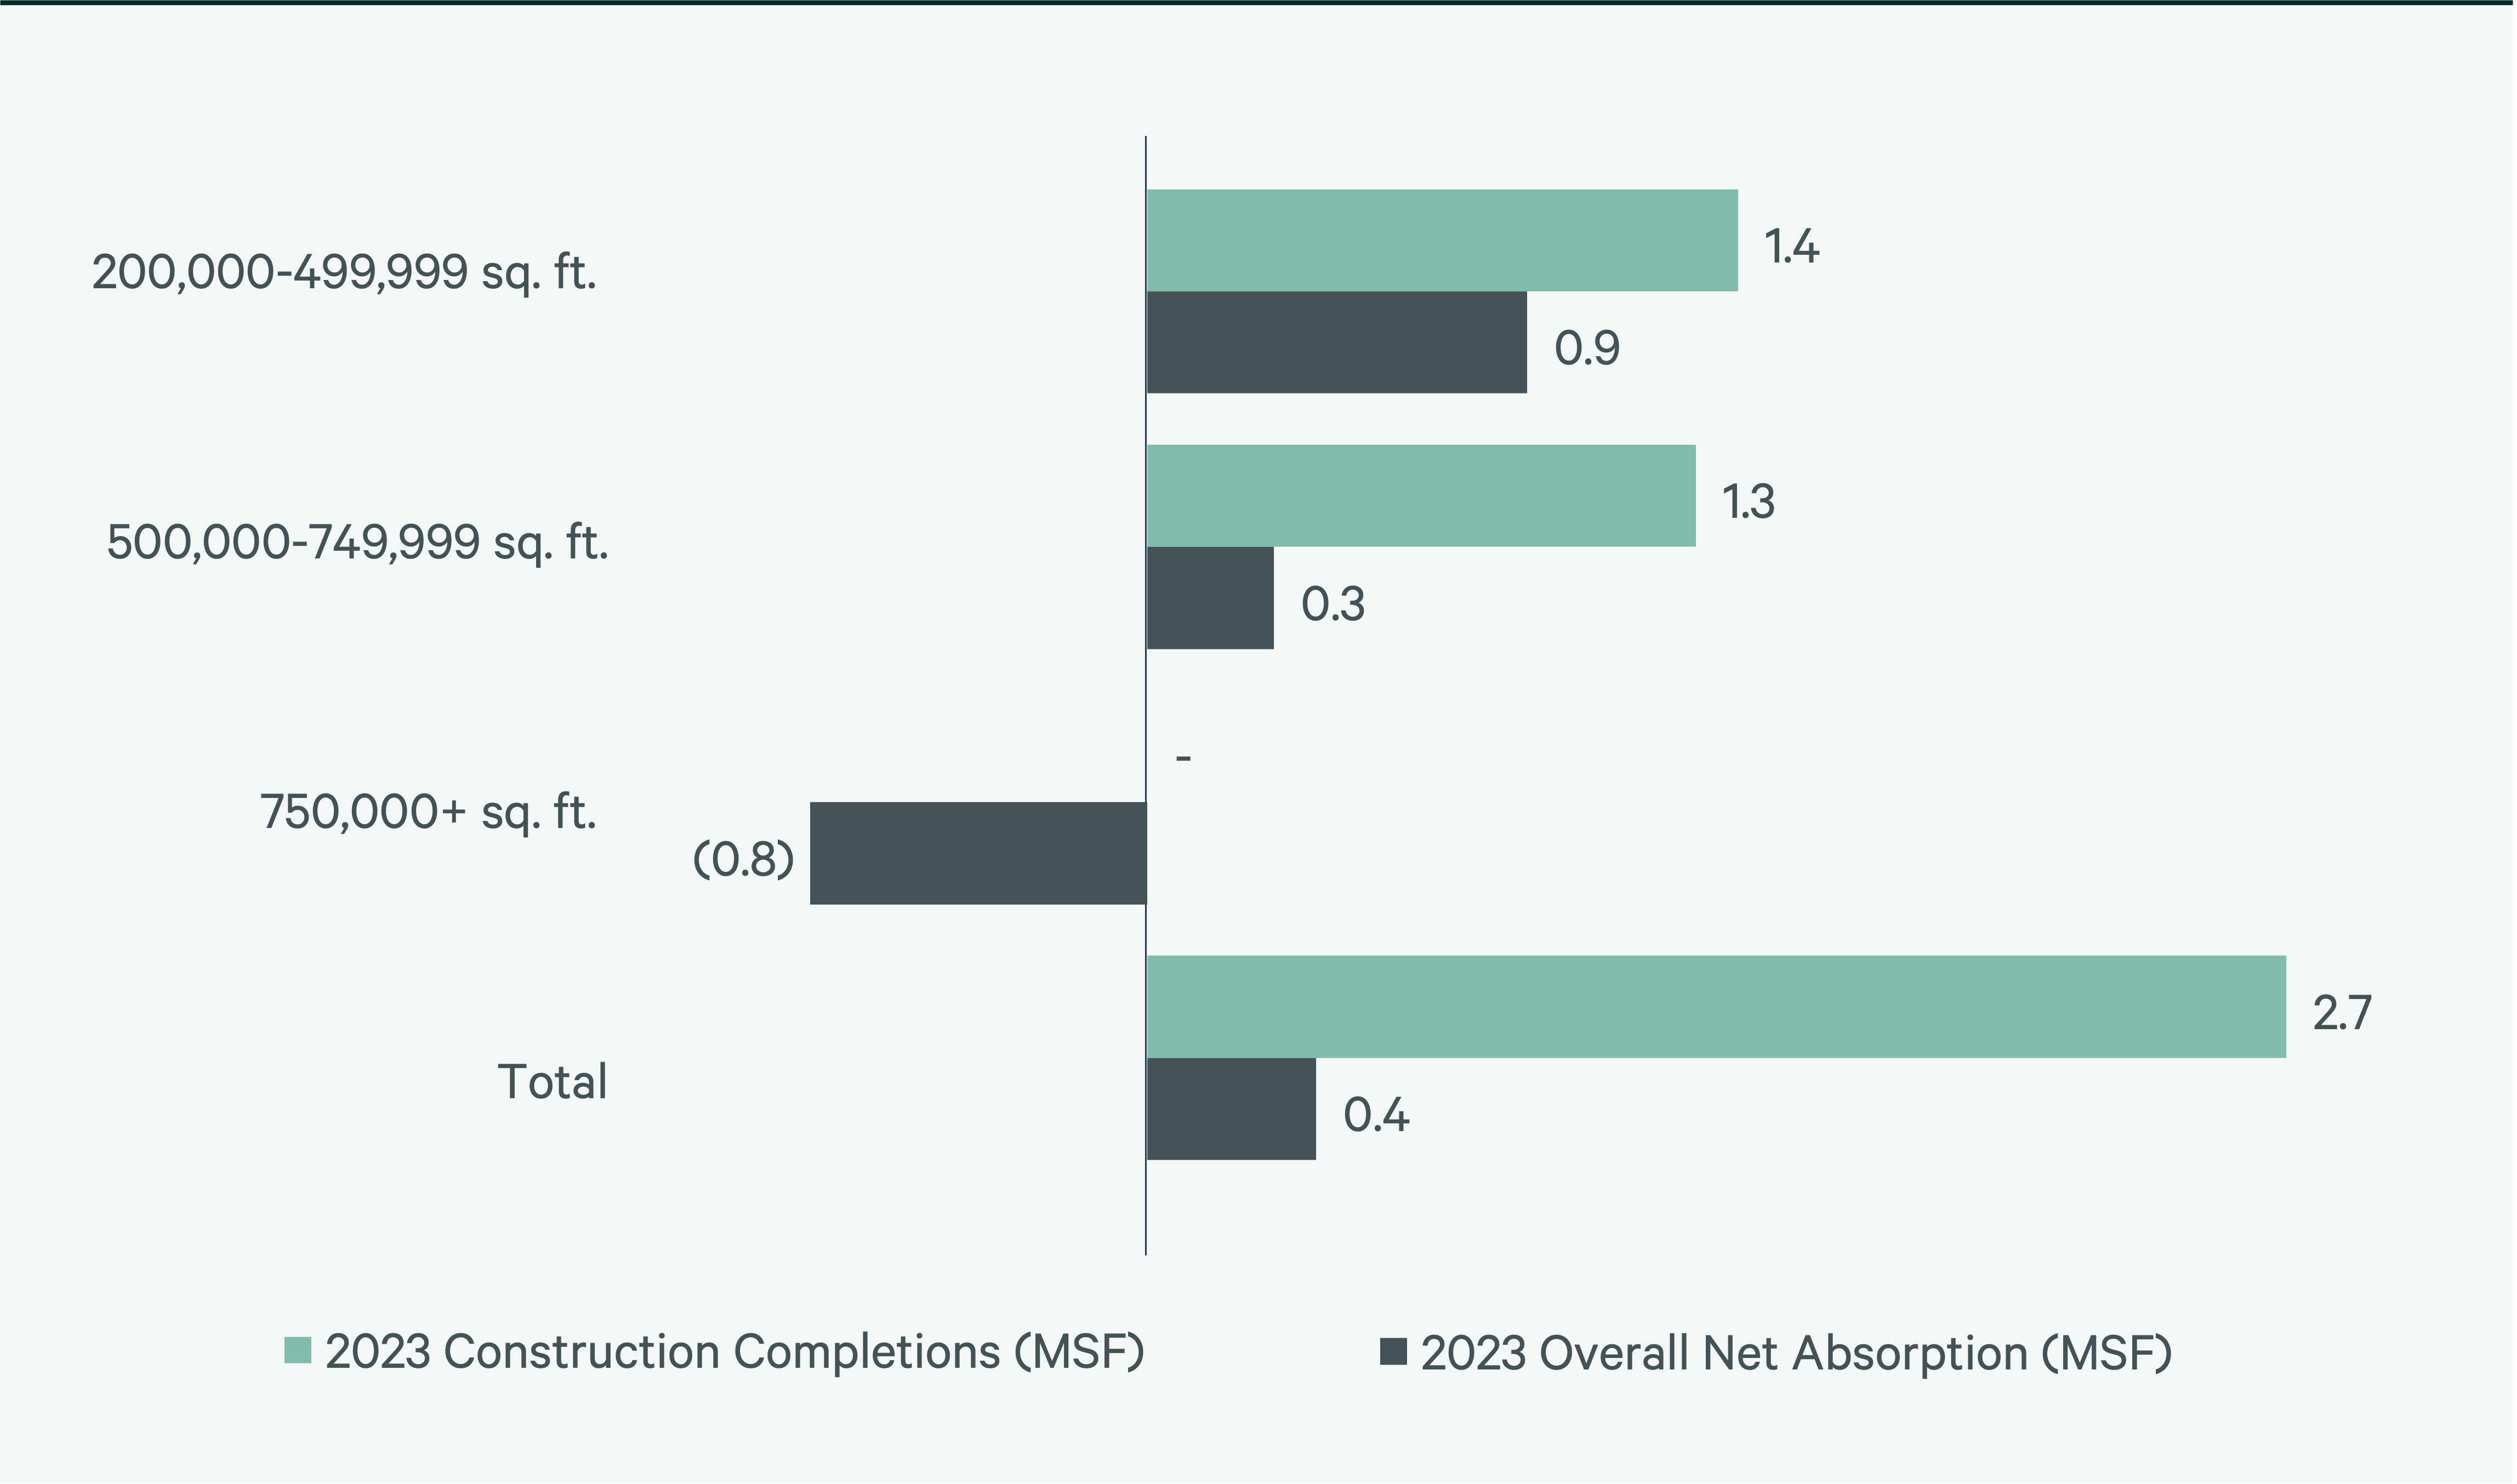
Figure 7: Direct Vacancy Rate by Size Range
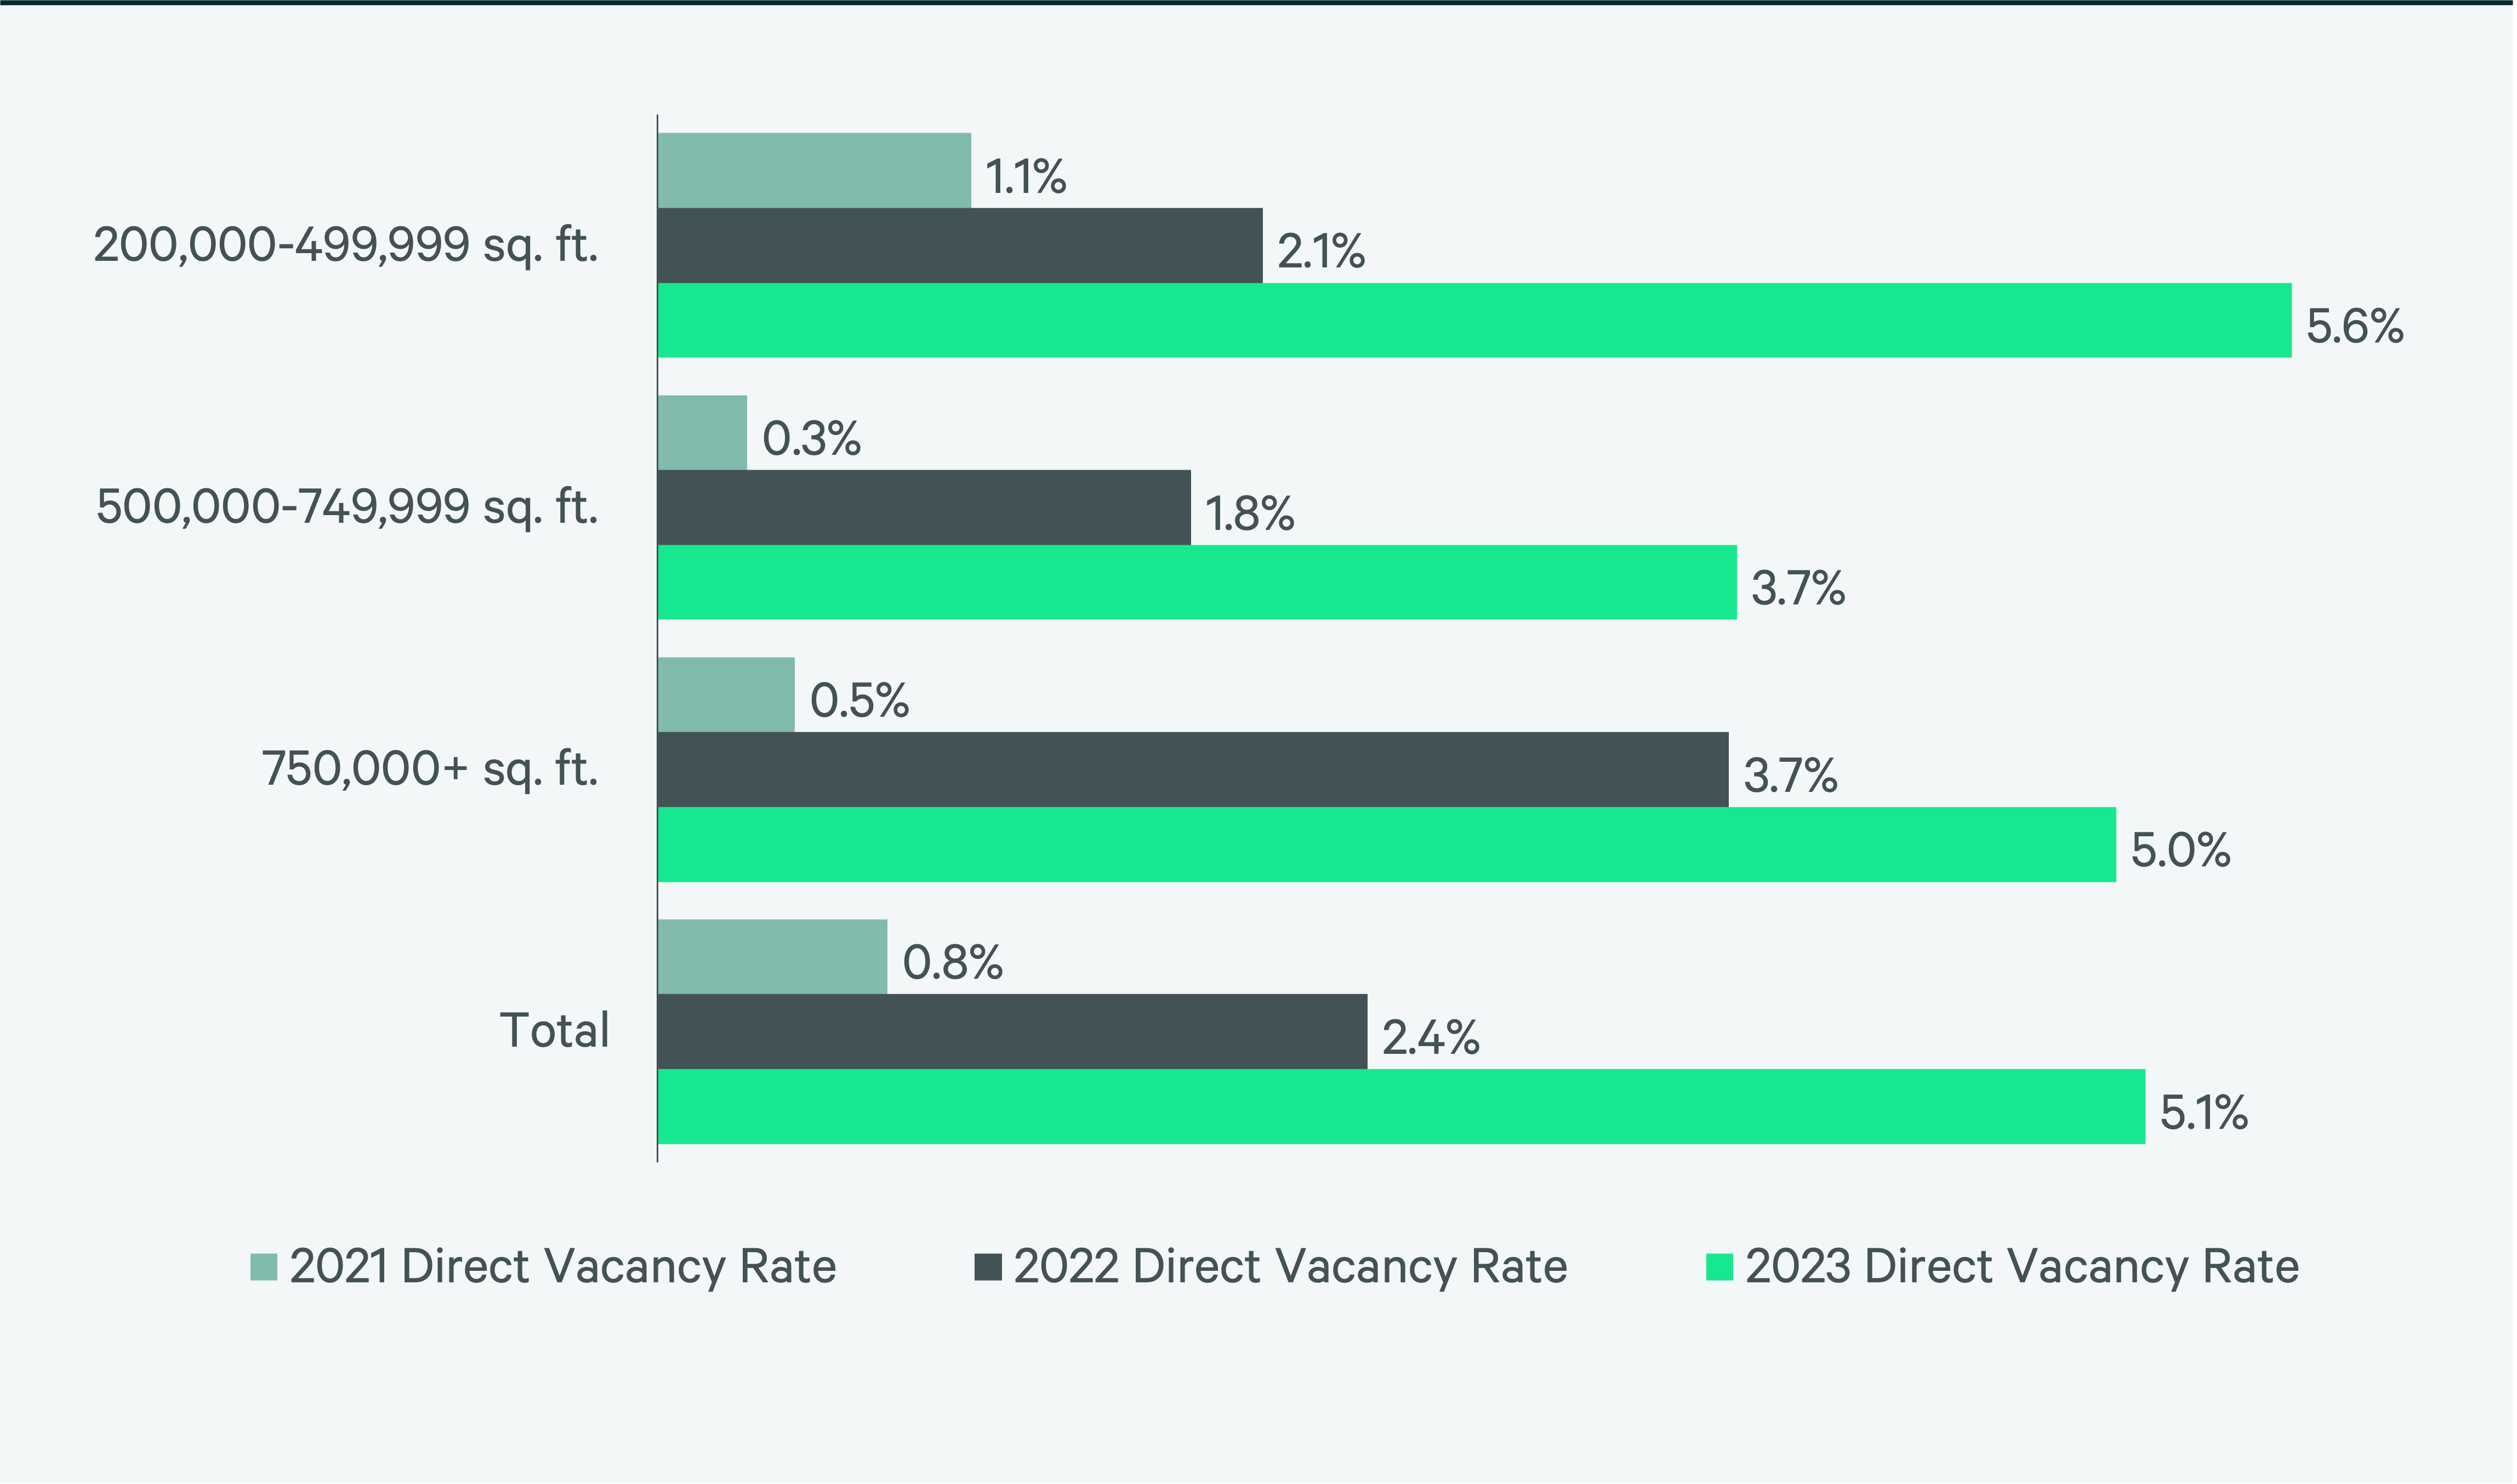
Figure 8: Under Construction & Percentage Preleased
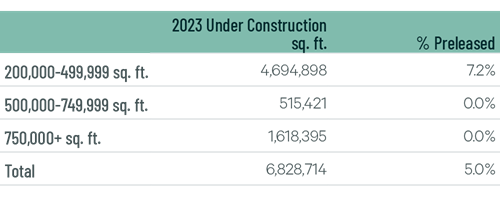
Figure 9: First Year Taking Rents (psf/yr)
Source: CBRE Research.
Explore Big-Box Insights by Market
-

More than 18 million people—23% aged 18-34—live within 100 miles of the market’s core, with a 1.6% projected five-year growth rate.
-

Over 8 million people live within 50 miles of the market’s core, and 60 million are within 250 miles.
-

Around 9 million people live within 50 miles of the market’s core, the highest population concentration in Canada.
Industrial & Logistics Research
James Breeze
Vice President, Global Industrial and Retail Research

John Morris
President, Americas Industrial & Logistics, Advisory Services