Future Cities
Baltimore
2024 North America Industrial Big-Box Review & Outlook
April 29, 2024 5 Minute Read

Demographics
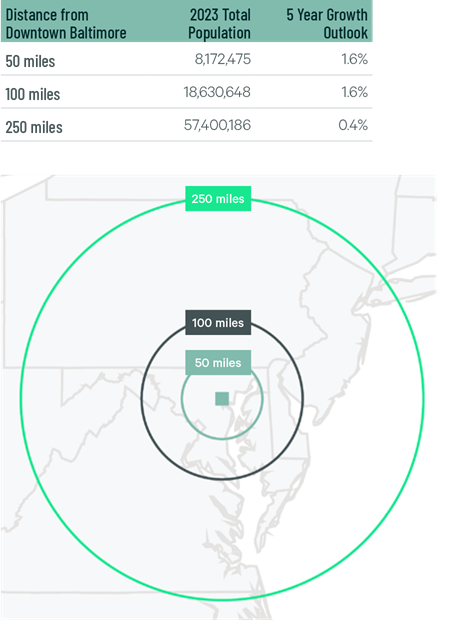
More than 18 million people—23% aged 18-34—live within 100 miles of the market’s core, with a 1.6% projected five-year growth rate. Baltimore has a high population concentration within 100 miles, like Inland Empire, Dallas and Chicago. It is also ideal for distributors serving Washington D.C.’s large population.
Figure 1: Baltimore Population Analysis
The local warehouse labor force of 43,111 is expected to grow by 10.3% by 2034, according to CBRE Labor Analytics. The average wage for a non-supervisory warehouse worker is $19.59 per hour, 10.4% above the national average.
Figure 2: Baltimore Warehouse & Storage Labor Fundamentals
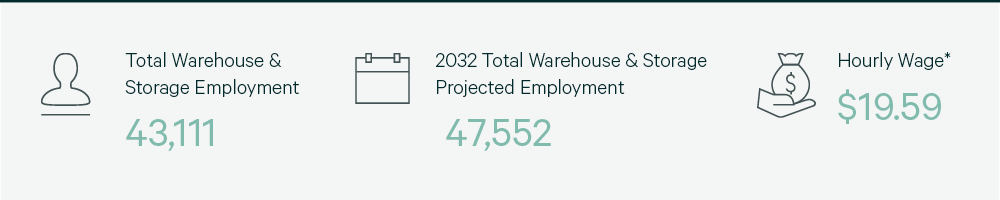
*Median wage (1 year experience); non-supervisory warehouse material handlers.
Location Incentives
Over the past five years, there have been over 160 economic incentives deals totaling more than $80 million for an average of $6,400 per new job in metro Baltimore, according to fDi Intelligence.
CBRE’s Location Incentives Group reports that top incentive programs offered in metro Baltimore include Advantage Maryland, which provides grants and loans to support job creation and capital investment. To qualify, businesses must be in a priority funding area and an eligible industry sector.
Another program available in Baltimore is the Job Creation Tax Credit (JCTC). It provides eligible companies with income tax credits for creating at least 60 new jobs for Maryland residents or 25 new jobs if located in a designated revitalization area.
Figure 3: Baltimore Top Incentive Programs
Note: The extent, if any, of state and local incentive offerings depends on location and scope of the operation.
Logistics Driver
Baltimore’s strategic location on the East Coast has attracted dozens of major e-commerce and bulk goods distributors. The region has access to CSX and Norfolk Southern rail lines, and every terminal at the Port of Baltimore is within one stoplight of an interstate highway. Baltimore has one of a few East Coast ports capable of handling ships carrying 14,000 20-equivalent units (TEUs) or larger. Construction is underway for a second, 50-foot-deep berth at the Seagirt Chesapeake Marine Terminal, which will allow the port to simultaneously handle two supersized ships. Four additional neo-Panamax cranes started operations in 2023.
The I-95 Corridor gives Baltimore direct highway access to the entire eastern U.S. BWI Airport’s freight transportation business provides an additional mode of transport easily accessible to the region’s manufacturers and distributors.

BWI Airport’s freight transportation business provides an additional mode of transport easily accessible to the region’s manufacturers and distributors.
Supply & Demand
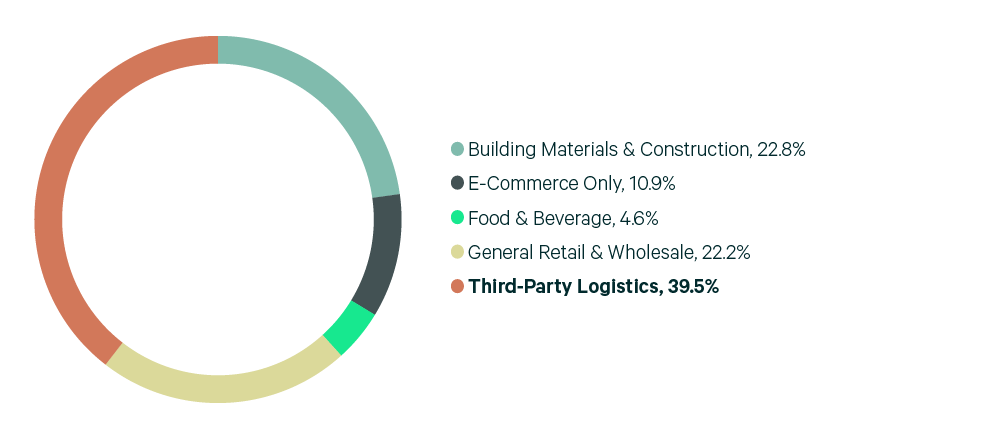
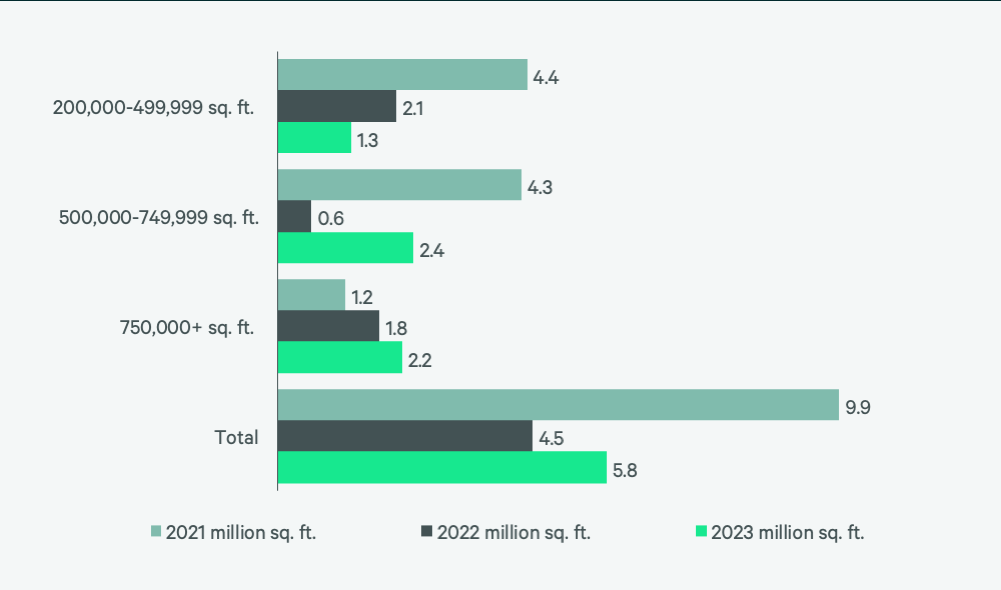
Despite only 87 million sq. ft of existing industrial big-box inventory, Baltimore is garnering significant interest from big-box occupiers because of its central location and nearby port. Baltimore’s 2023 leasing volume was 5.8 million sq. ft., a nearly 30% year-over-year increase. It is one of the few markets in this report to have a year-over-year increase in leasing activity. Despite this, a decline in positive net absorption and 3.3 million sq. ft. of construction completions drove up the vacancy rate to 7.3%, significantly higher than 2022’s 4.5% rate. 3PLs were the most active occupier in 2023, accounting for 39.5% of leasing activity. However, the building materials, general retail & wholesale, and e-commerce sectors each also accounted for more than 10% of the total transaction volume.
Baltimore’s vacancy rate should stabilize in H1 2024, given that only 2.1 million sq. ft. is under construction, and decline year-over-year by this year’s end. Leasing activity is expected to increase throughout this year as occupiers, buoyed by solid retail sales and economic stability, expand into Baltimore to leverage its central location and other logistics advantages.
Figure 4: Share of 2023 Leasing by Occupier Type
Source: CBRE Research.
Figure 5: Lease Transaction Volume by Size Range
Source: CBRE Research.
Figure 6: 2023 Construction Completions vs. Overall Net Absorption by Size Range
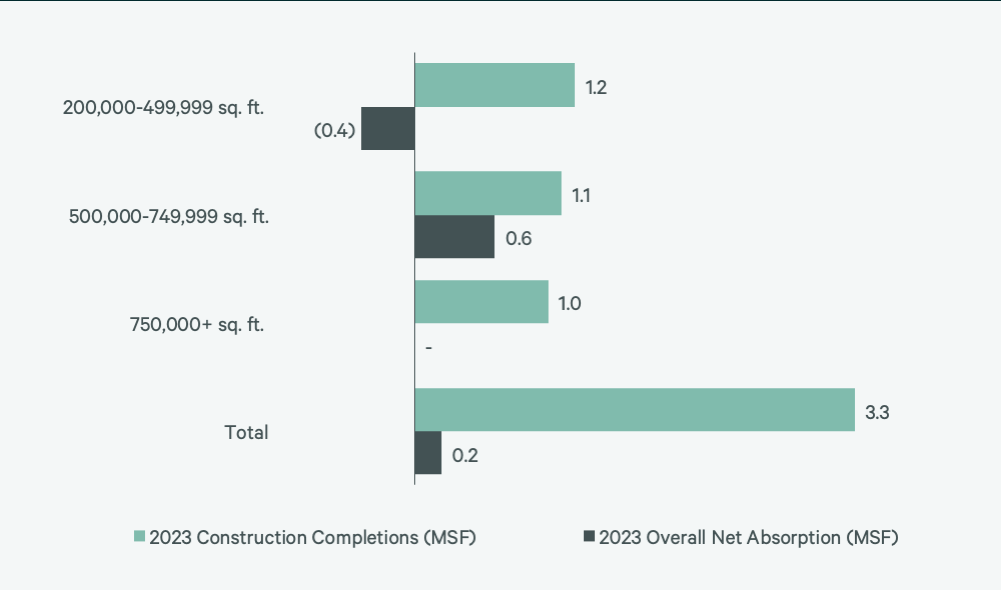
Figure 7: Direct Vacancy Rate by Size Range
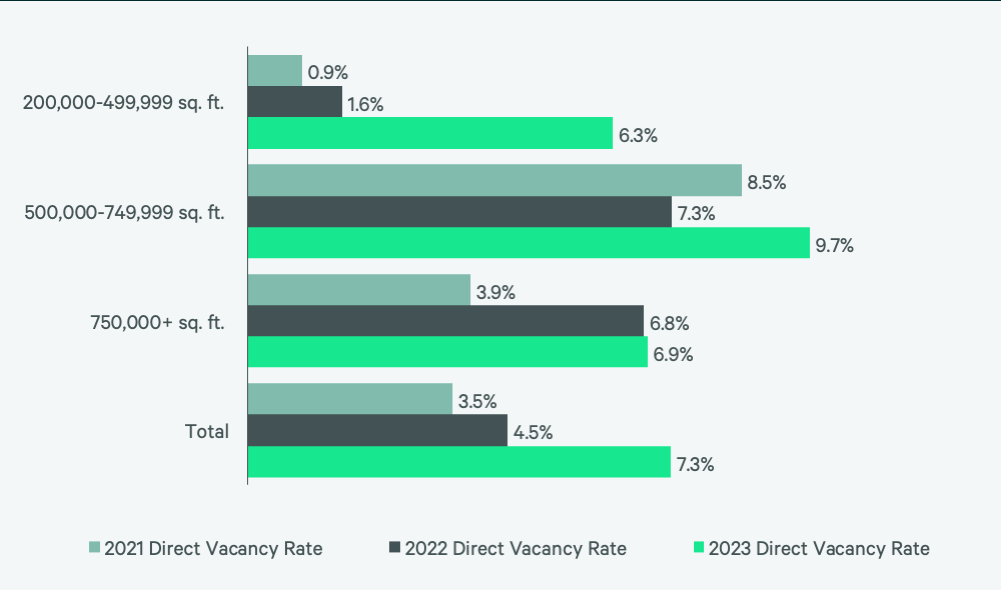
Figure 8: Under Construction & Percentage Preleased
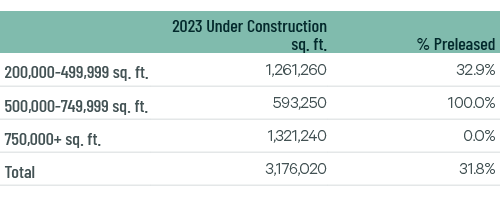
Figure 9: First Year Taking Rents (psf/yr)
Source: CBRE Research.
Explore Big-Box Insights by Market
-

More than 2.6 million people live within 50 miles of the market’s core, with a projected five-year growth rate of 1.8%.
-

The Northern/Central New Jersey market serves the U.S.’s largest population within a 50-, 100- and 250-mile radius.
-

Around 9 million people live within 50 miles of the market’s core, the highest population concentration in Canada.
Industrial & Logistics Research
James Breeze
Vice President, Global Industrial and Retail Research

John Morris
President, Americas Industrial & Logistics, Advisory Services