Future Cities
Louisville
2024 North America Industrial Big-Box Review & Outlook
April 29, 2024 5 Minute Read

Demographics
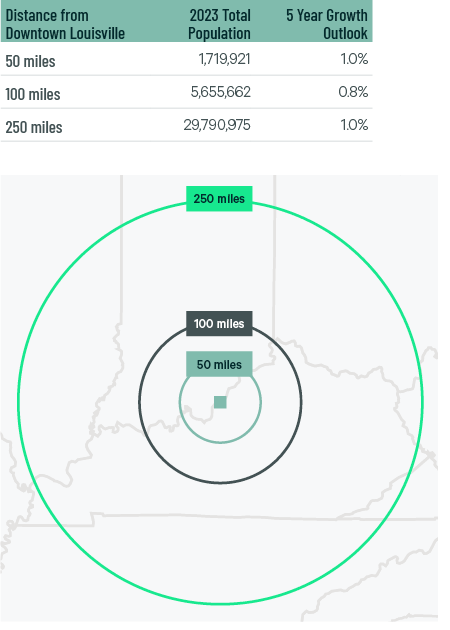
Nearly 30 million people—24% aged 18-34—live within 250 miles of downtown Louisville, with a 1% projected five-year growth rate. Louisville has a larger population concentration within 250 miles than the Inland Empire, DFW, Phoenix or Memphis.
Figure 1: Louisville Population Analysis
The local warehouse labor force of 43,650 is expected to grow by 6.4% by 2034, according to CBRE Labor Analytics. The average wage for non-supervisory warehouse worker is $18.04 per hour, 1.7% above the national average.
Figure 2: Louisville Warehouse & Storage Labor Fundamentals
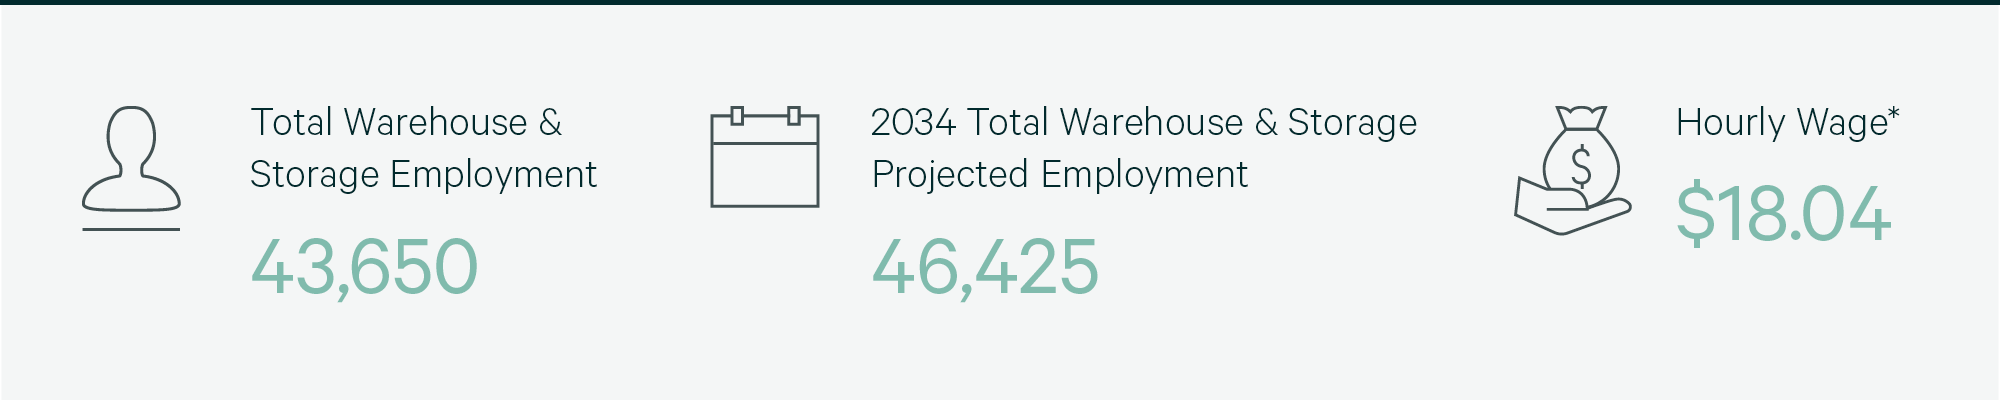
*Median wage (1 year experience); non-supervisory warehouse material handlers.
Location Incentives
Over the past five years, there have been over 200 economic incentives deals totaling more than $340 million for an average of $16,300 per new job in metro Louisville, according to fDi Intelligence.
CBRE’s Location Incentives Group reports that top incentive programs offered in Louisville include the Kentucky Business Investment Program (KBI), offering income tax credits and wage assessments to businesses engaged in manufacturing, agribusiness, headquarter operations, alternative fuel, renewable energy or carbon dioxide transmission pipelines. To qualify, companies must create and maintain an annual average of at least 10 new full-time jobs for Kentucky residents during the length of the incentive agreement.
Another program available in Kentucky is the Kentucky Enterprise Initiative Act (KEIA), offering companies a sales and use tax refund for building and construction materials used to improve real property value. This refund is also available for research and development, data processing and flight simulation equipment.
Figure 3: Louisville Top Incentive Programs
Note: The extent, if any, of state and local incentive offerings depends on location and scope of the operation.
Logistics Driver
Louisville Muhammad Ali International Airport was named the world’s fourth-busiest air cargo hub by Airport Councils International. The airport is home to UPS Worldport, one of the world’s largest package-handling facilities. The region also hosts a growing manufacturing base, particularly medical, packaging materials and automotive. This is driving demand for surrounding distribution centers. As e-commerce’s share of total retail sales keeps growing, more distributors are expected to take advantage of the region’s air cargo capabilities.

Louisville Muhammad Ali International Airport is home to UPS Worldport, one of the world’s largest package-handling facilities.
Supply & Demand
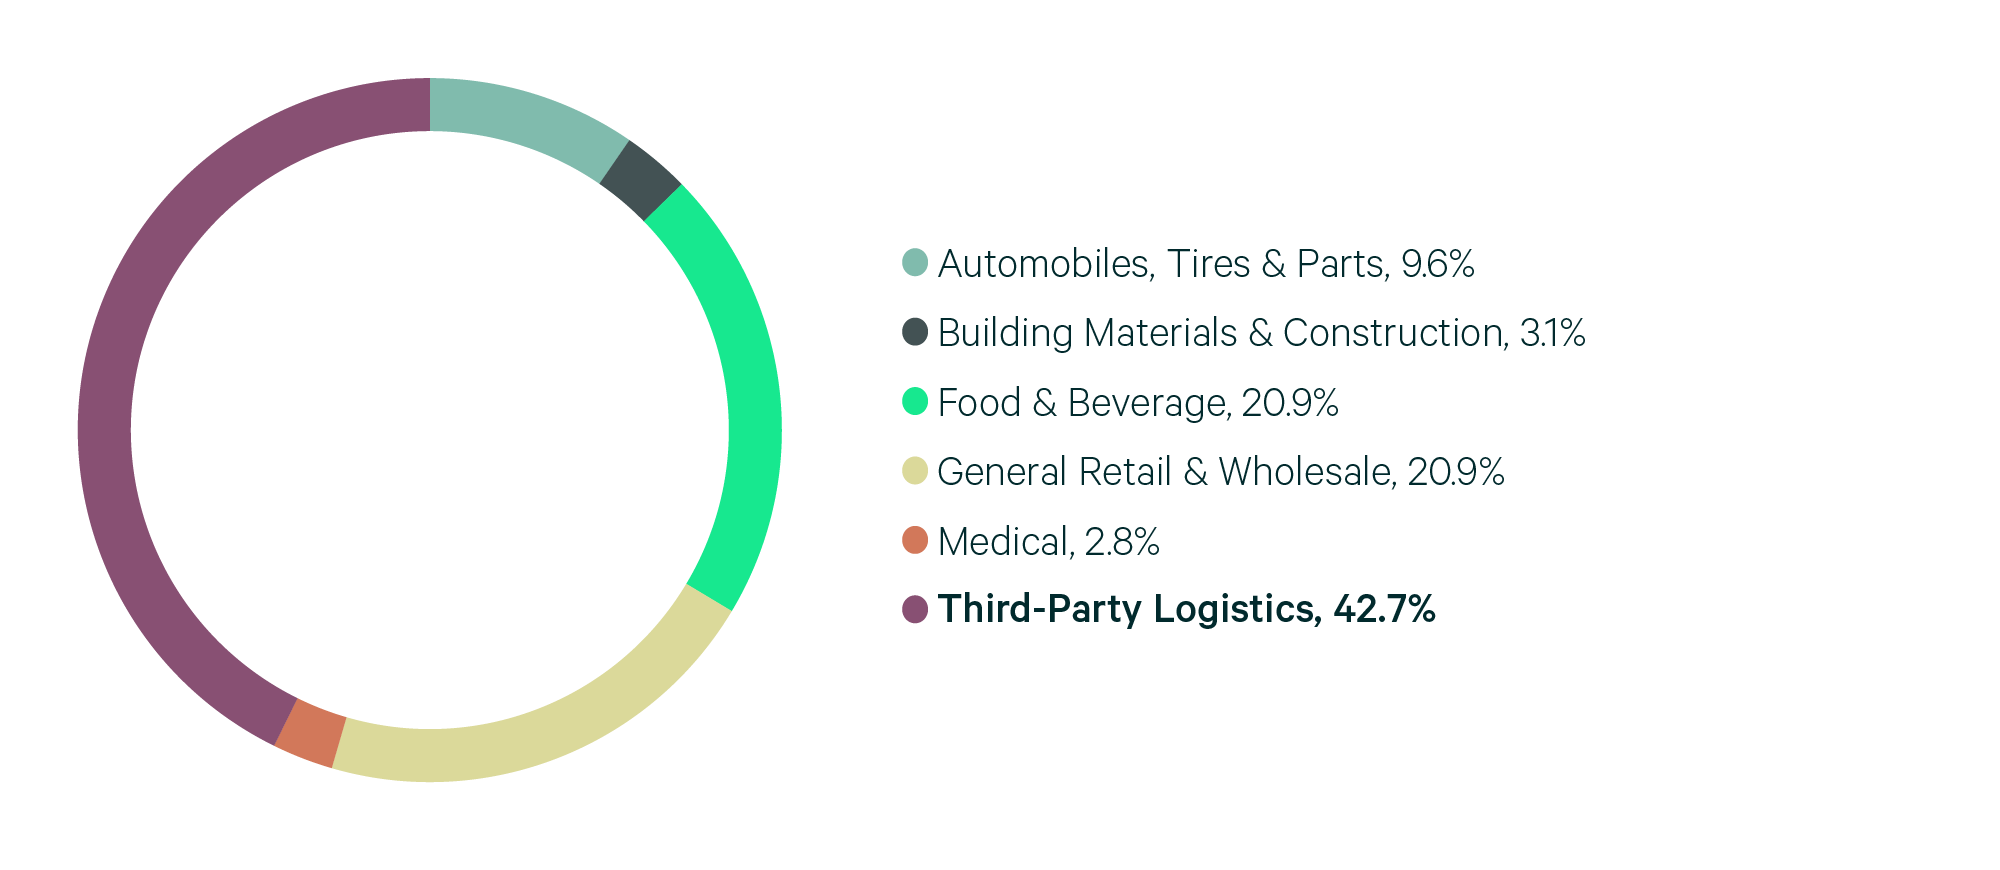
Louisville’s central location is attracting new occupiers, leading to robust demand and new development. Louisville’s transaction volume reached a record 11.5 million sq. ft. in 2023, the 10th-highest for a market in this report, from 5.2 million sq. ft. in 2022, Strong leasing activity resulted in positive net absorption of 5.4 million sq. ft., making Louisville the seventh-top growth (net absorption/existing inventory) market in this report. 3PLs dominated leasing, followed by food & beverage and general retail & wholesale, each of which accounted for 21% of transaction volume.
Louisville was one of the few markets in this report that did not experience an increases in vacancy rates, ending the year at 3.9%. Challenges in securing construction financing led to a decline in space under construction, to 2.2 million sq. ft. by year-end. As a result, Louisville is one of the most undersupplied big-box markets in North America. The lack of new supply will likely reduce vacancy rates and continue to exert upward pressure on rents this year.
Figure 4: Share of 2023 Leasing by Occupier Type
Source: CBRE Research.
Figure 5: Lease Transaction Volume by Size Range
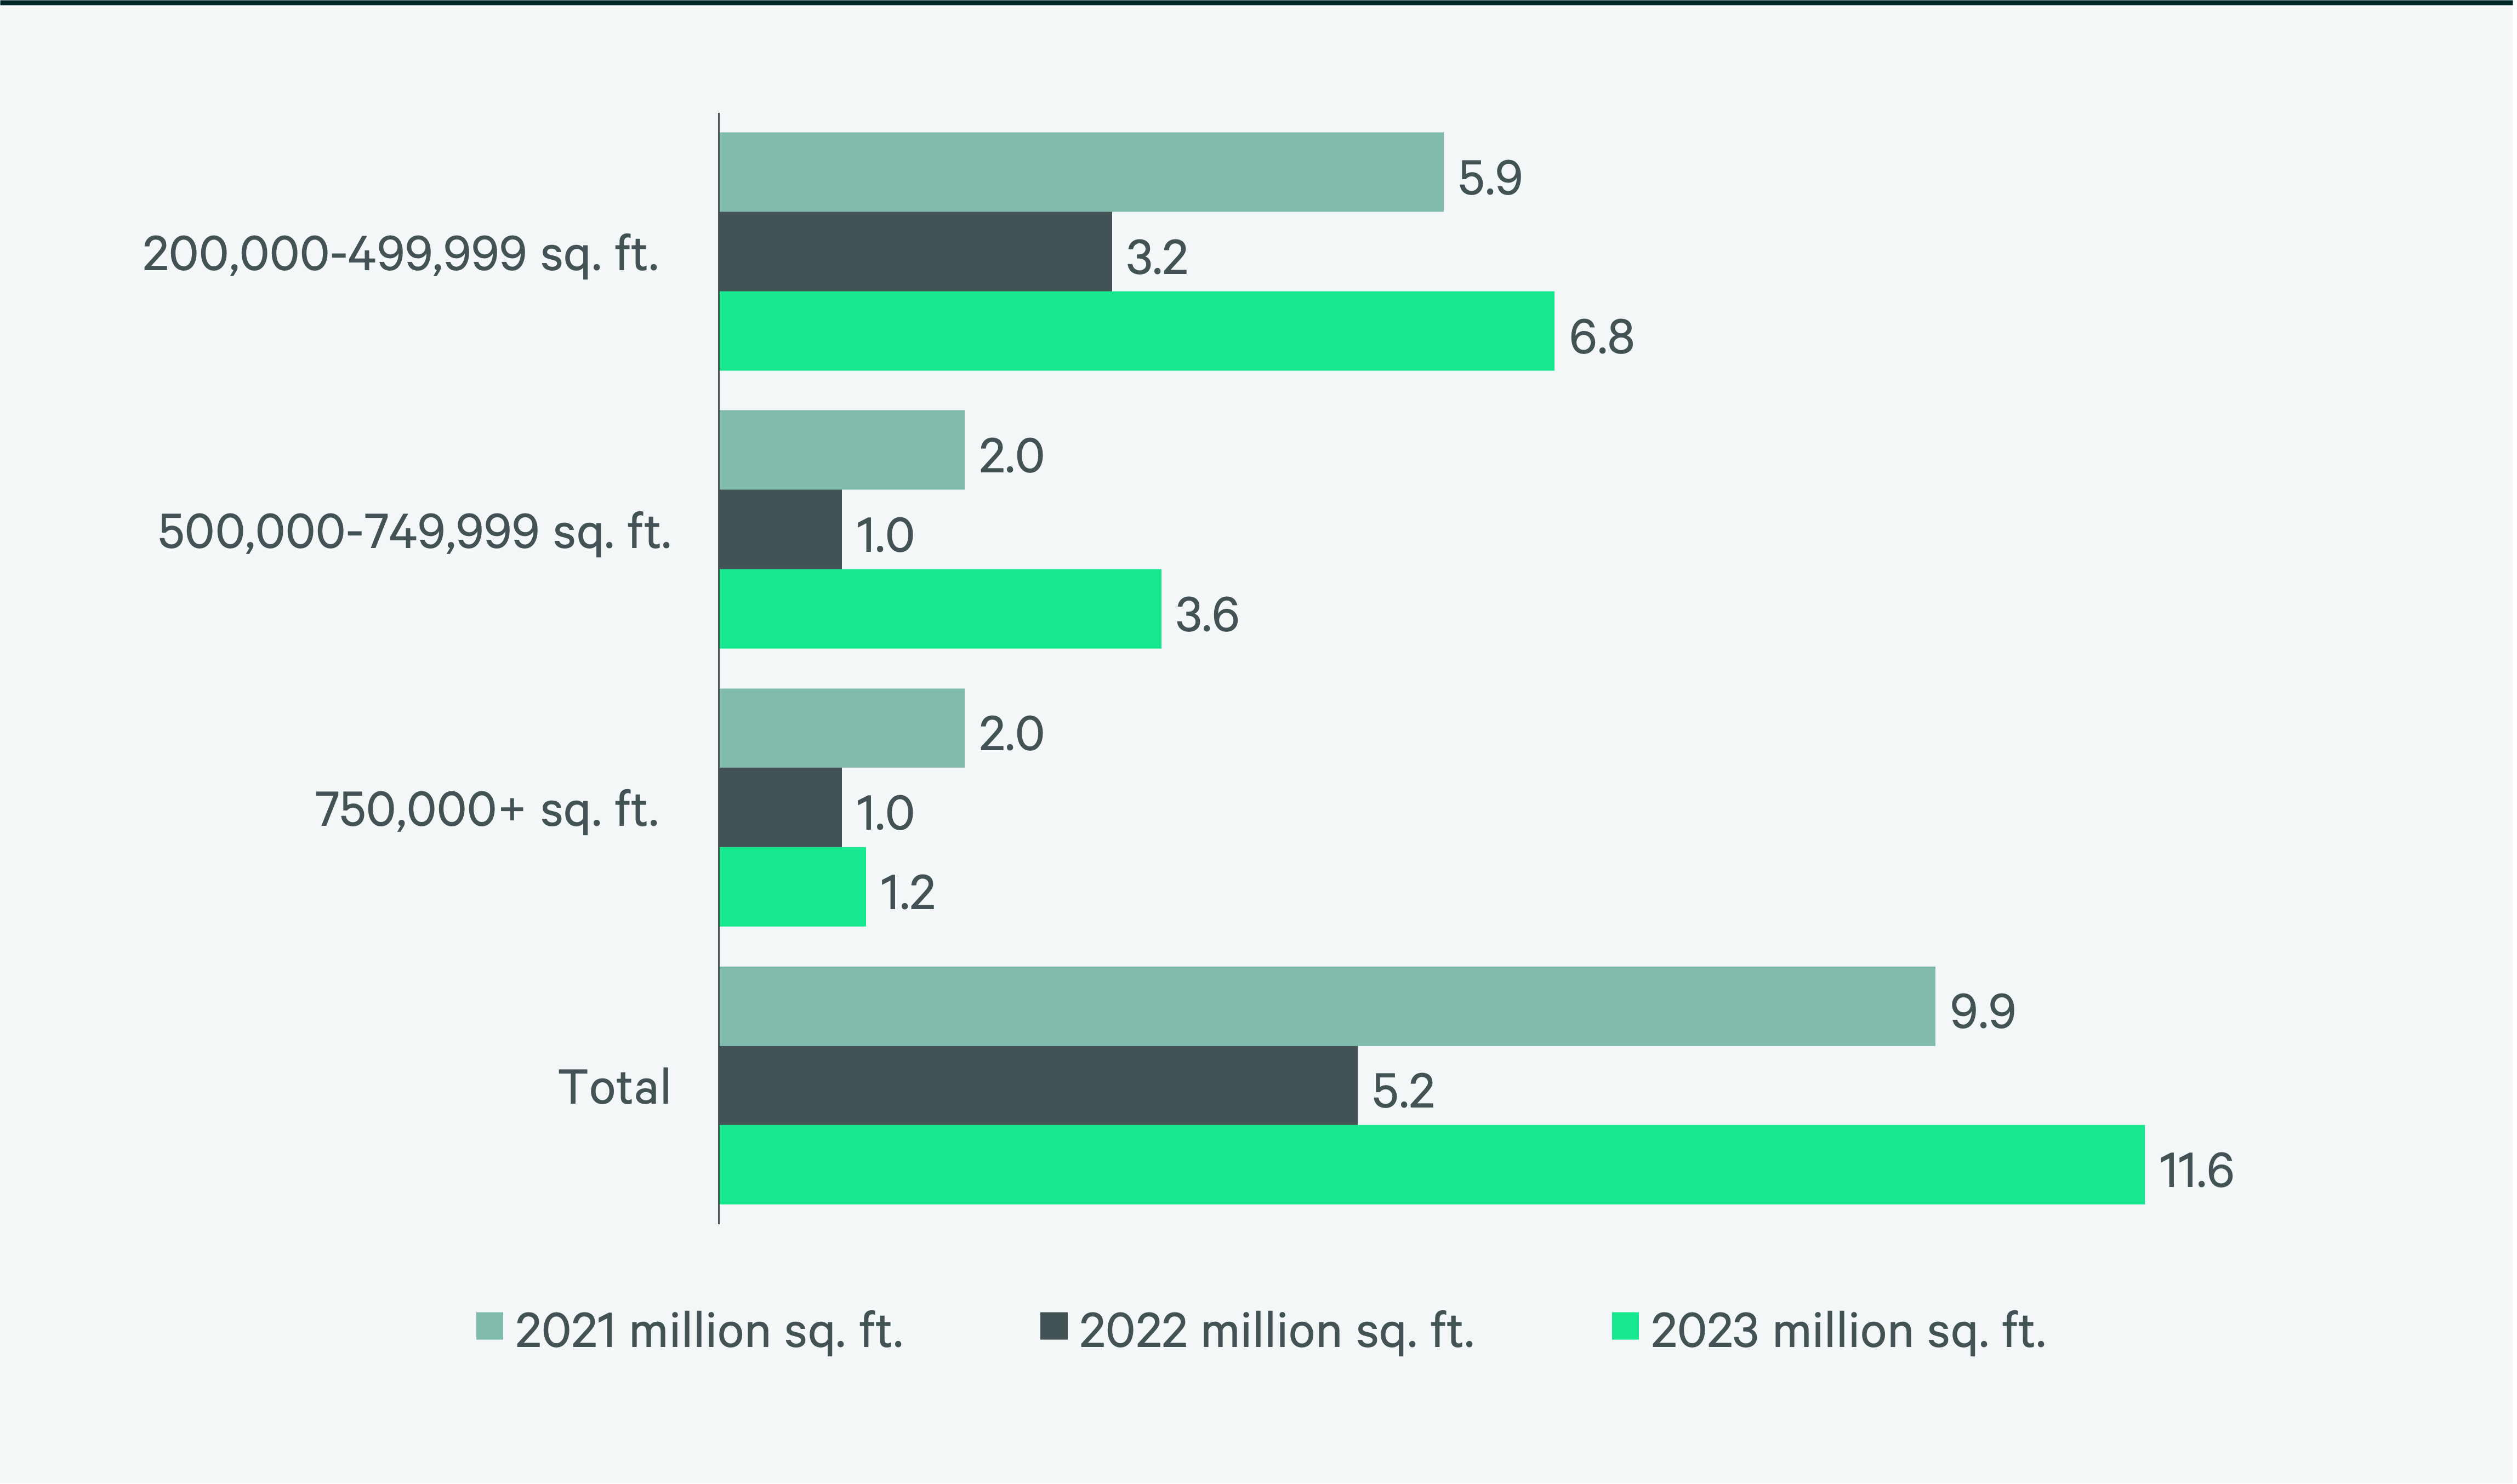
Source: CBRE Research.
Figure 6: 2023 Construction Completions vs. Overall Net Absorption by Size Range
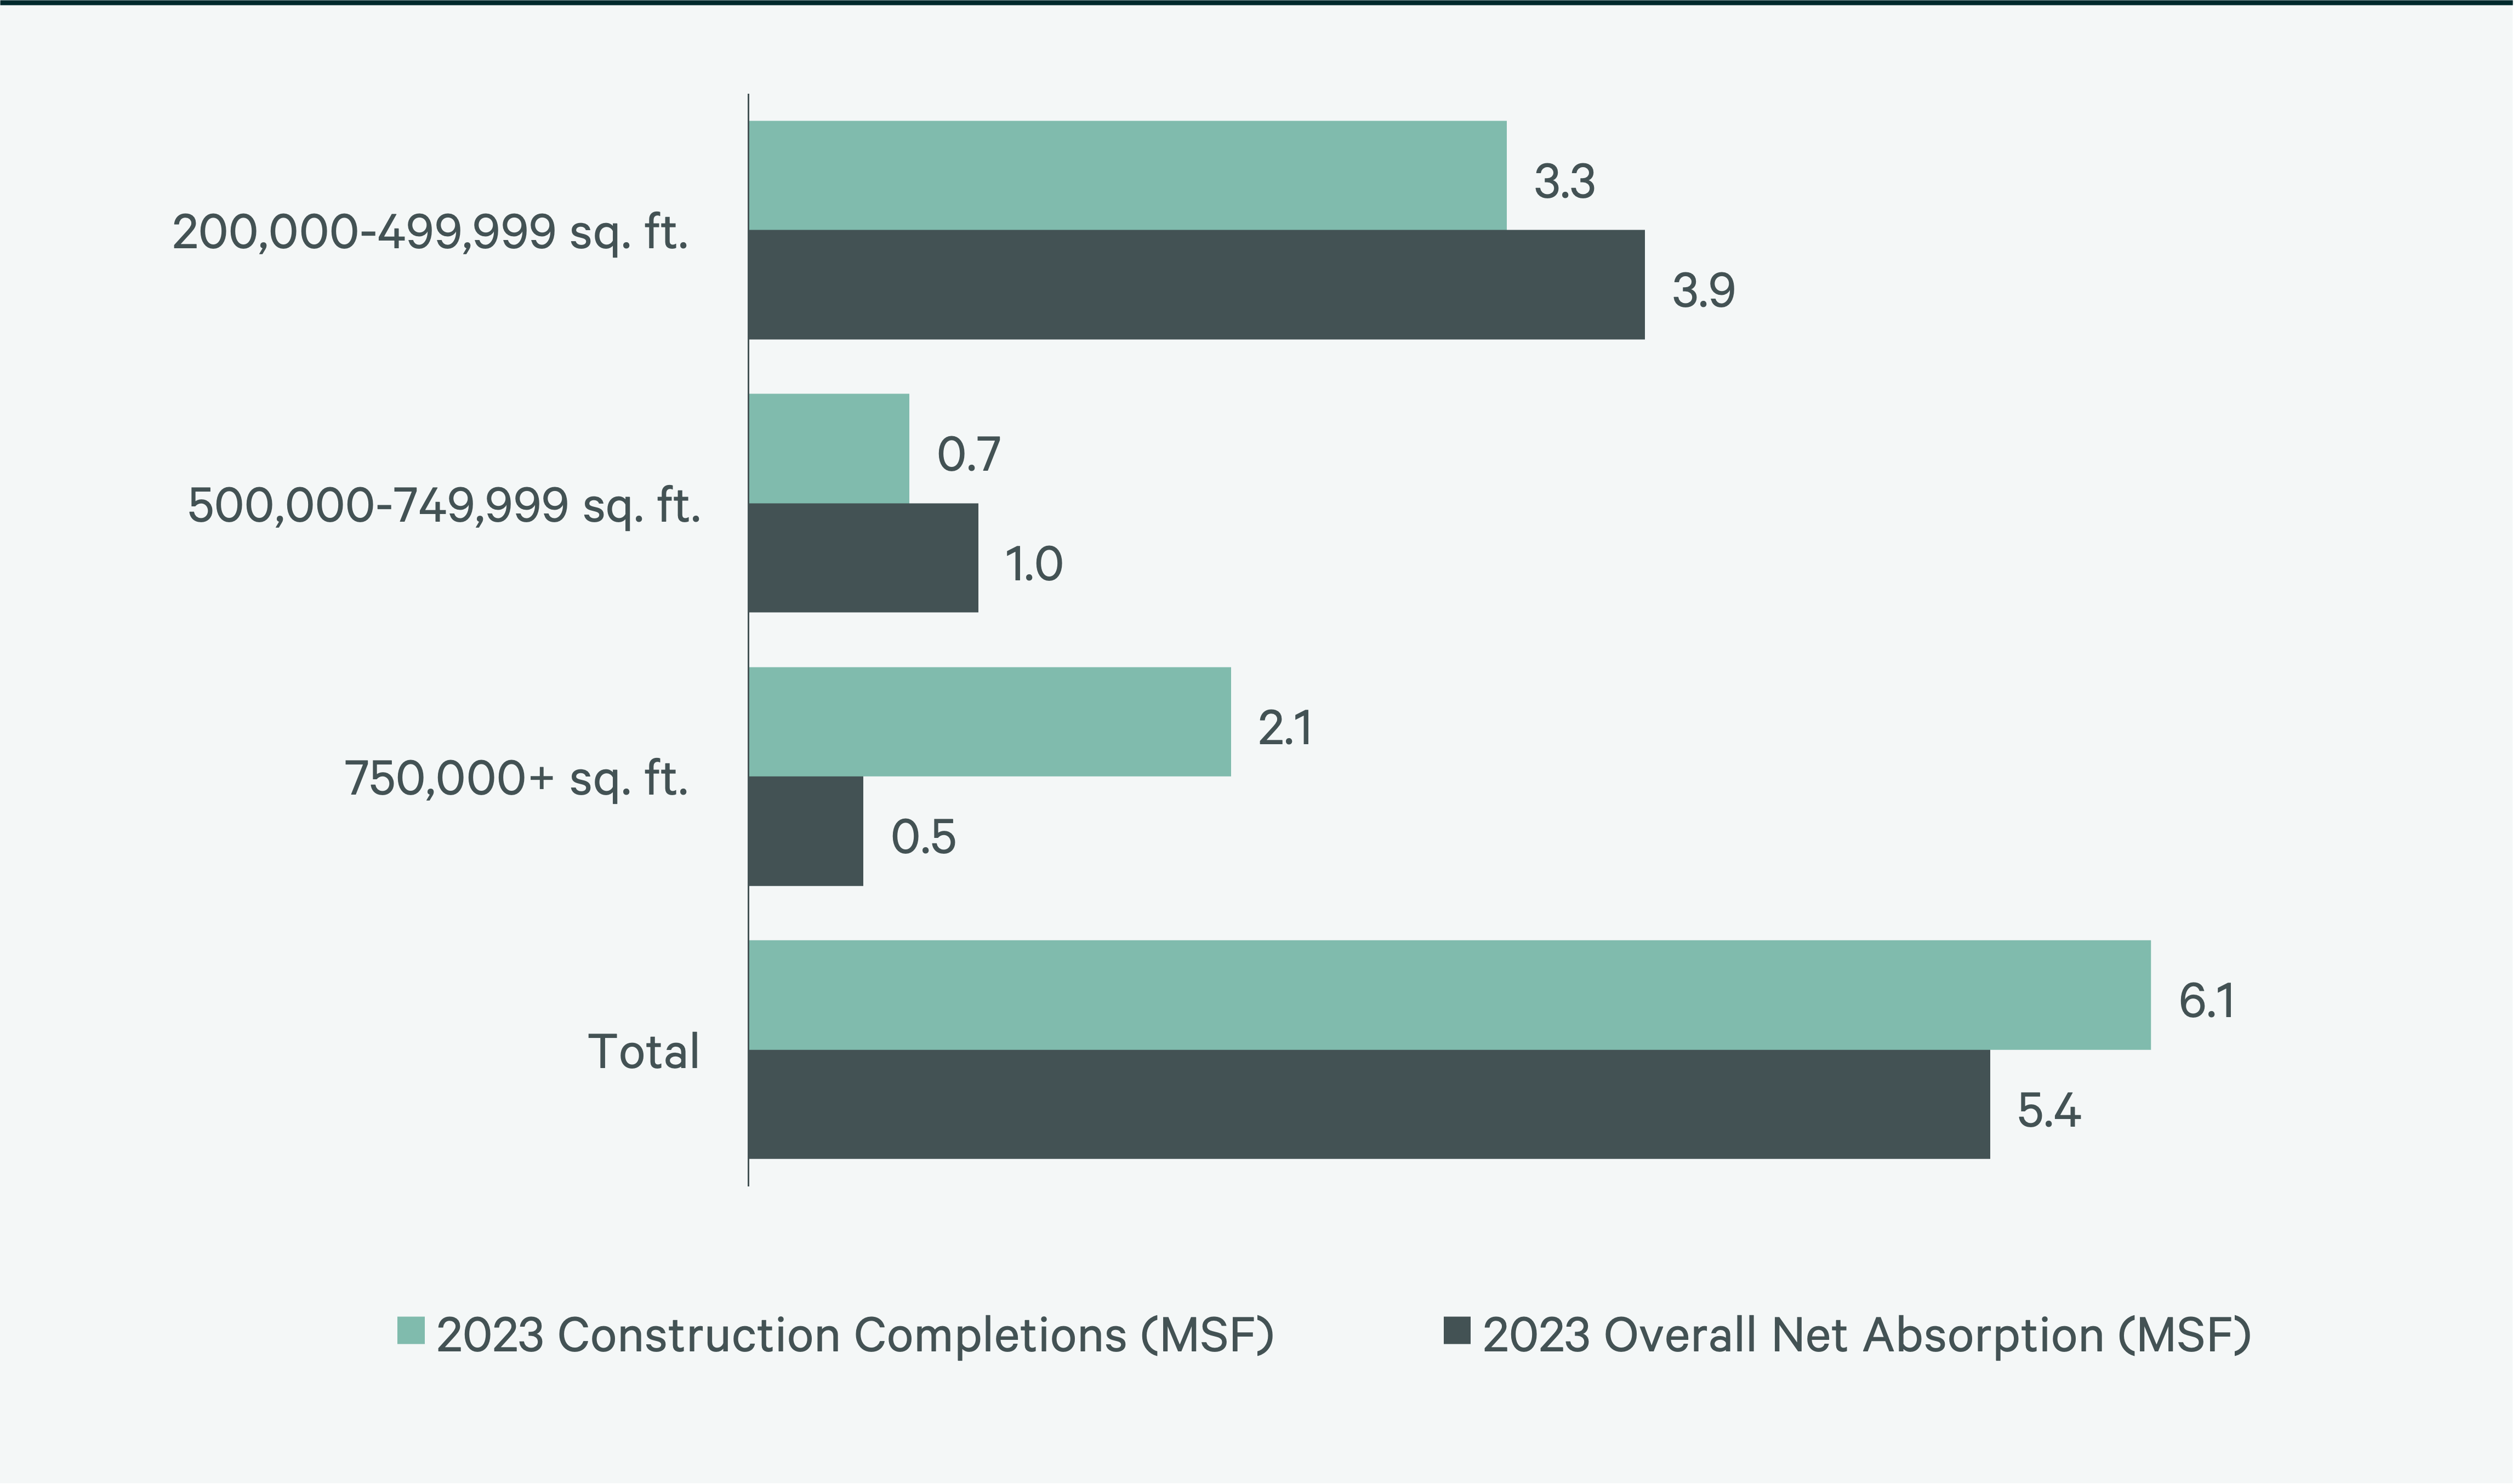
Figure 7: Direct Vacancy Rate by Size Range
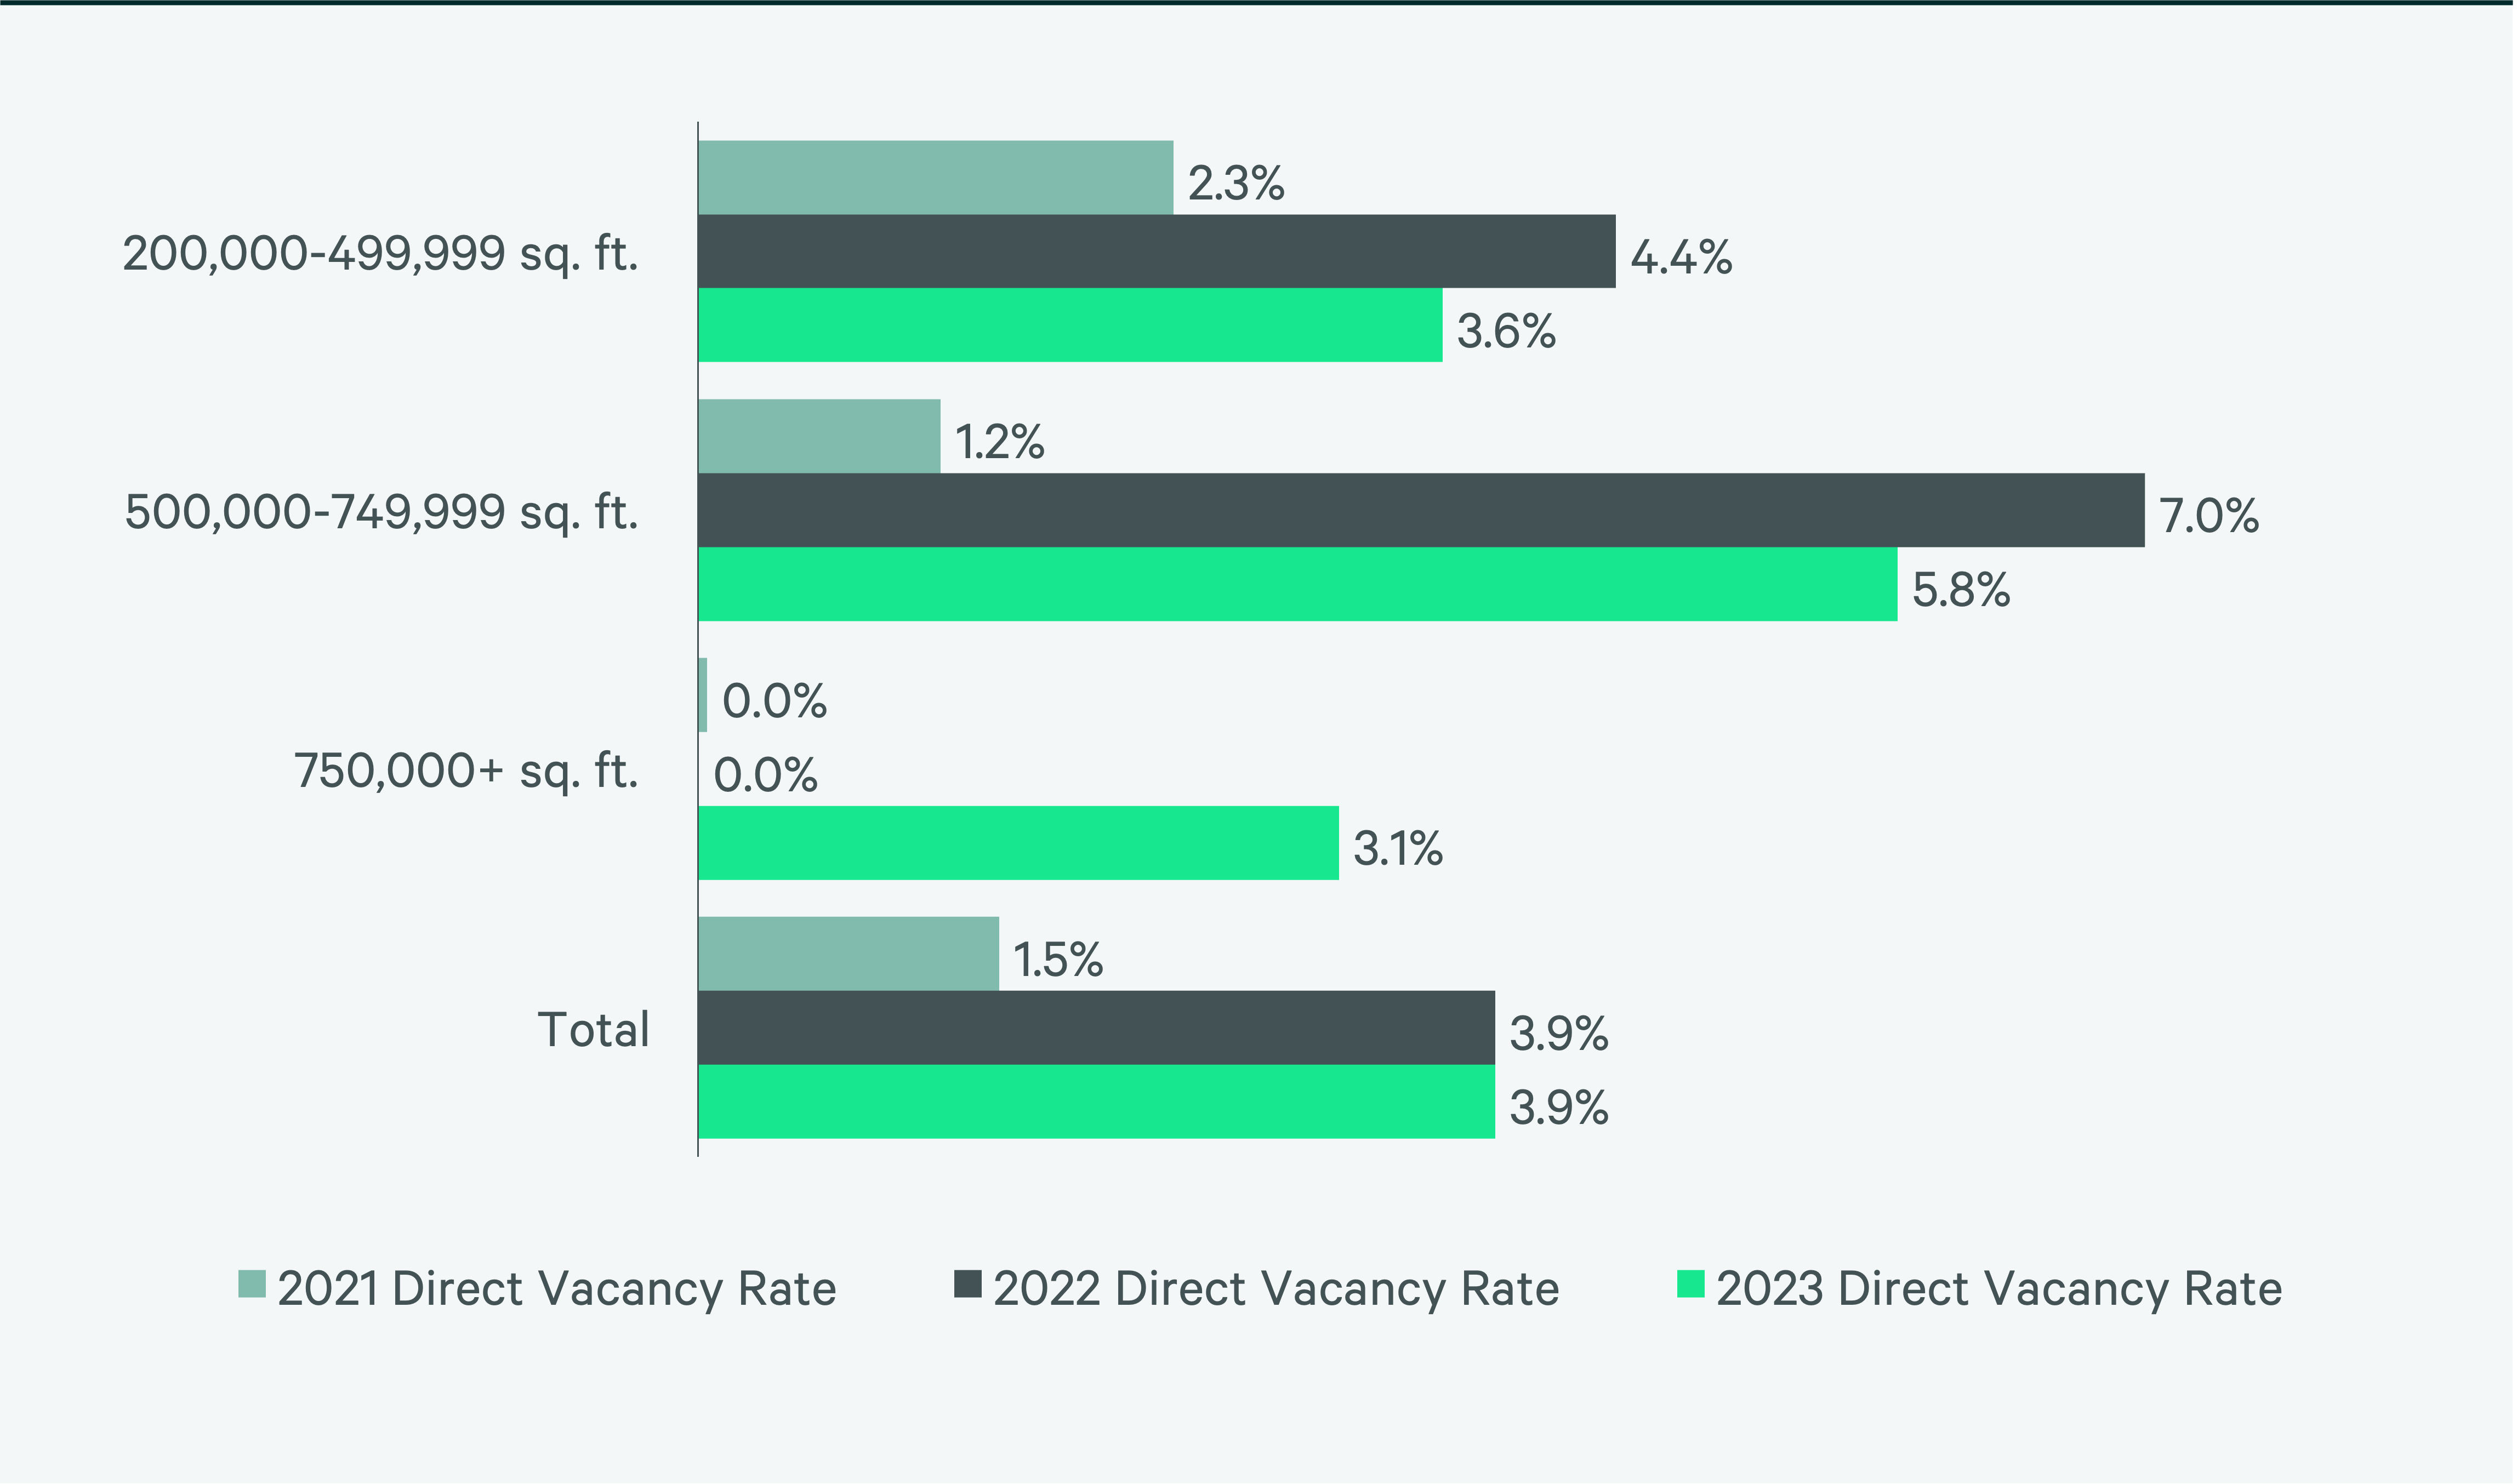
Figure 8: Under Construction & Percentage Preleased
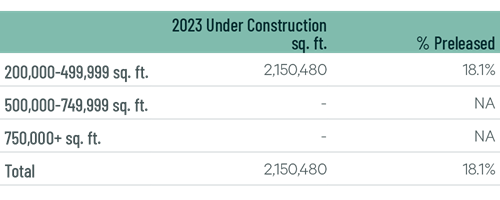
Figure 9: First Year Taking Rents (psf/yr)
Source: CBRE Research.
Explore Big-Box Insights by Market
-

Cincinnati’s central location makes it ideal for big-box occupiers.
-

More than 2.6 million people live within 50 miles of the market’s core, with a projected five-year growth rate of 1.8%.
-

Over 2.6 million people live within 50 miles of the market’s core, with a 1.9% expected five-year growth rate.
Industrial & Logistics Research
James Breeze
Vice President, Global Industrial and Retail Research

John Morris
President, Americas Industrial & Logistics, Advisory Services