Future Cities
Indianapolis
2024 North America Industrial Big-Box Review & Outlook
April 29, 2024 5 Minute Read

Demographics
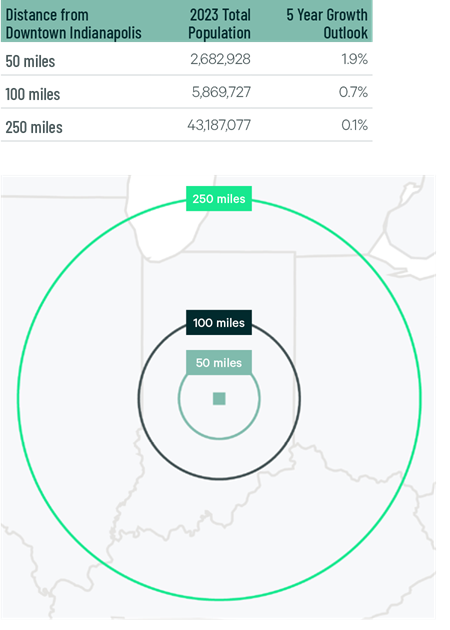
Over 2.6 million people live within 50 miles of the market’s core, with a 1.9% expected five-year growth rate. Indianapolis’s central location offers access to over 43 million people within 250 miles, the fifth-highest in North America.
Figure 1: Indianapolis Worth Population Analysis
The local warehouse labor force of 78,030 is expected to grow by 6.1% by 2034, according to CBRE Labor Analytics. The average wage for a non-supervisory warehouse worker is $17.87 per hour, 0.7% above the national average.
Figure 2: Indianapolis Warehouse & Storage Labor Fundamentals
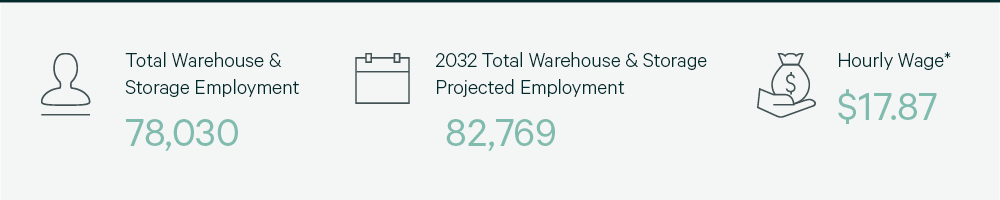
*Median wage (1 year experience); non-supervisory warehouse material handlers.
Location Incentives
Over the past five years, there have been more than 580 economic incentives deals totaling more than $1.4 billion for an average of $25,600 per new job in metro Indianapolis, according to fDi Intelligence.
CBRE’s Location Incentives Group reports that top incentive programs offered in metro Indianapolis include the Economic Development for a Growing Economy (EDGE) program, offering refundable discretionary tax credits for corporate income taxes for up to 10 years. These credits equal up to 100% of new income tax withholdings generated by a project’s job creation.
Another program available in Indianapolis is the Hoosier Business Investment Tax Credit Program, which offers a non-refundable tax credit to companies that create new jobs and make capital improvements to a business facility. The tax credits are calculated as a percentage of the project’s capital investment.
Figure 3: Indianapolis Top Incentive Programs
Note: The extent, if any, of state and local incentive offerings depends on location and scope of the operation.
Logistics Driver
Greater Indianapolis offers many logistics advantages for industrial occupiers. it is a top region for trucking, with more national highway intersections than any other state. Under its “Major Moves” program, Indiana is investing $10 billion over 10 years to add 400 miles of new highways. Indianapolis is home to the second-largest FedEx air hub in the world, helping Indianapolis International Airport consistently rank among the U.S.’s top five cargo airports. Indiana also ranks third for total railroad miles in the country.

Indiana ranks third for total railroad miles in the country.
Supply & Demand
Over 40 million sq. ft. of big-box space completed construction in 2023, setting a local record and ranking second in North America, behind only Dallas-Ft. Worth. This massive development increased the overall vacancy rate to 11.6%, more than double 2022’s 5.6% rate. Despite 15.2 million sq. ft. of lease transaction volume, which was on par with 2022, vacancies increased. Net absorption exceeded 10 million sq. ft. for the second consecutive year, reaching 10.4 million sq. ft. 3PLs dominated transaction volume, accounting for 42.3% of total leasing activity, as they capitalized on the market’s central location and numerous logistics challenges.
No market had a larger year-over-year decrease in space under construction than Indianapolis, which ended 2023 with only 4.6 million sq. ft. under construction. This was significantly less than the 30.1 million sq. ft. under construction at the end of 2022. The sharp reduction in construction completions this year will help vacancies decline, but it may take until 2025 or later for vacancy rates to return to the 5.8% mark seen in 2022.
Figure 4: Share of 2023 Leasing by Occupier Type
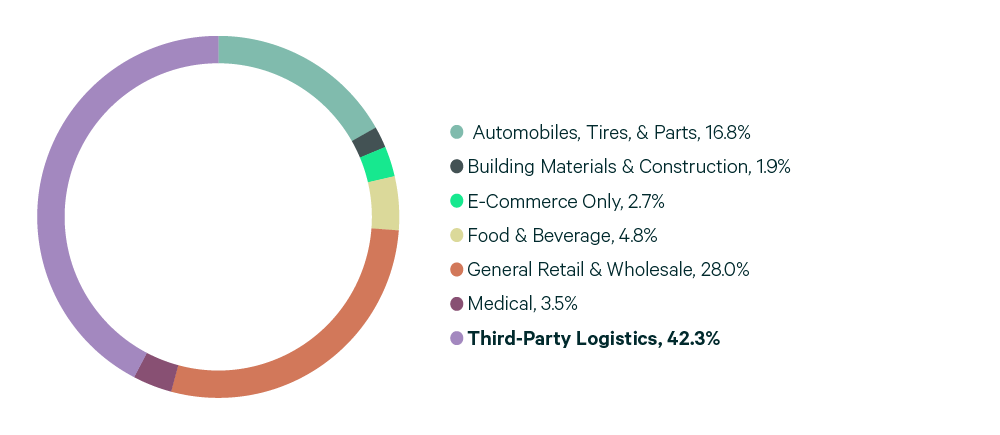
Source: CBRE Research.
Figure 5: Lease Transaction Volume by Size Range
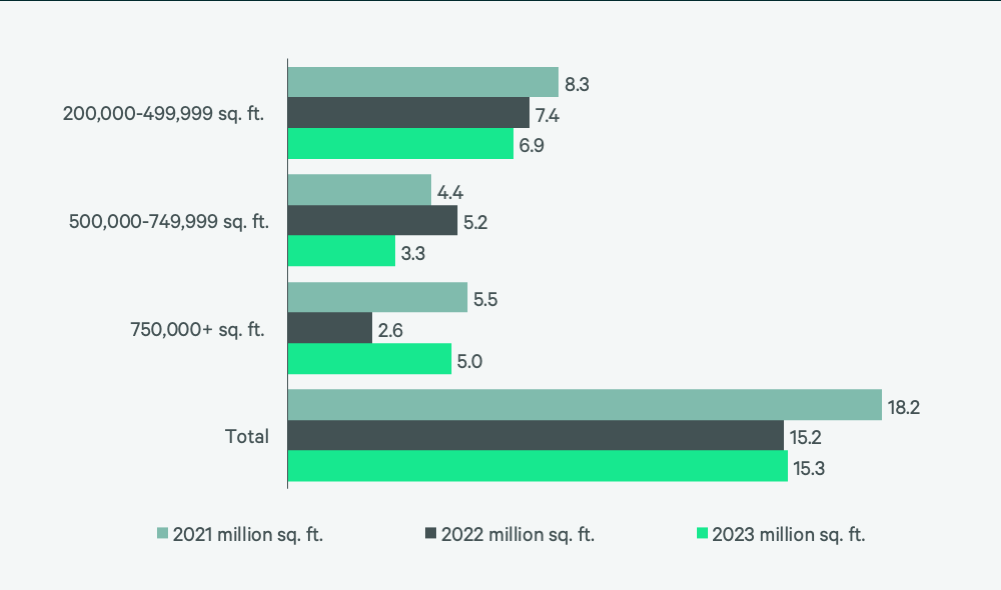
Source: CBRE Research.
Figure 6: 2023 Construction Completions vs. Overall Net Absorption by Size Range
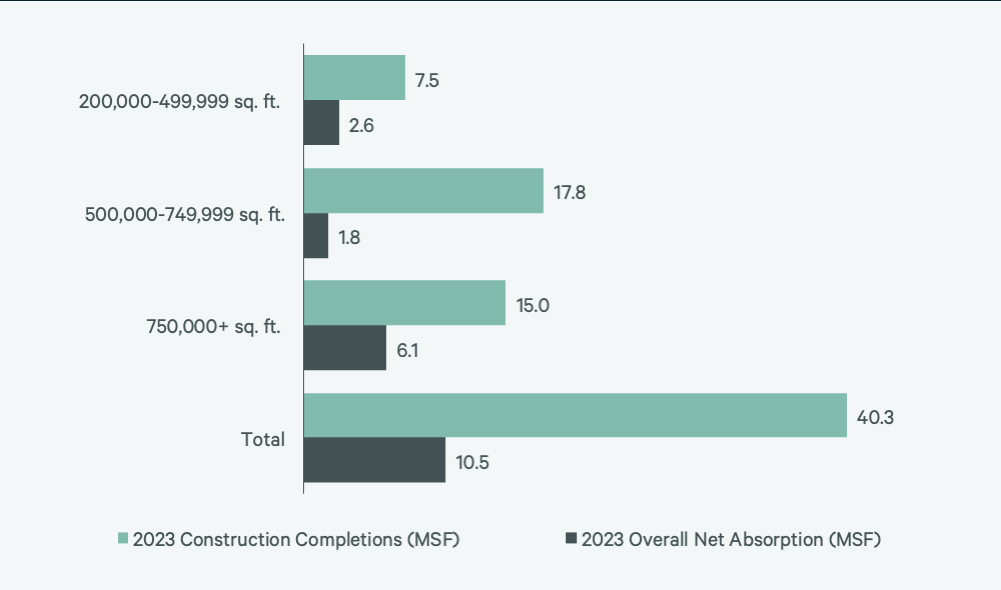
Figure 7: Direct Vacancy Rate by Size Range
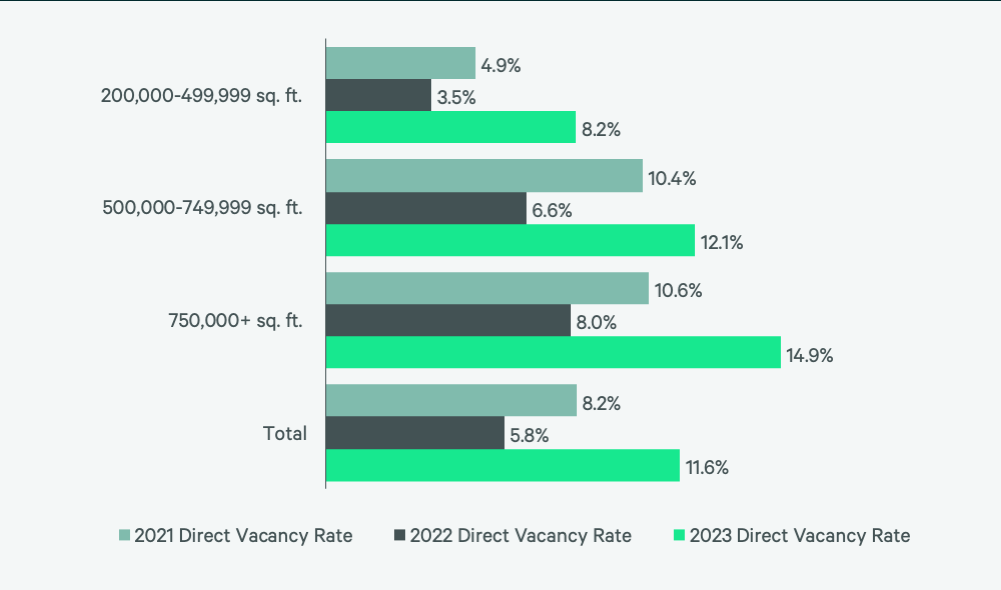
Figure 8: Under Construction & Percentage Preleased
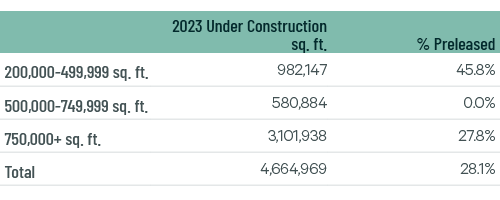
Figure 9: First Year Taking Rents (psf/yr)
Source: CBRE Research.
Explore Big-Box Insights by Market
-

Cincinnati’s central location makes it ideal for big-box occupiers.
-

More than 2.6 million people live within 50 miles of the market’s core, with a projected five-year growth rate of 1.8%.
-

Nearly 3 million people live within 50 miles of the market’s core but, like many Midwest markets, this is expected to decline by 0.2% over the next five years.
Industrial & Logistics Research
James Breeze
Vice President, Global Industrial and Retail Research

John Morris
President, Americas Industrial & Logistics, Advisory Services