Future Cities
Cincinnati
2024 North America Industrial Big-Box Review & Outlook
April 29, 2024 5 Minute Read

Demographics
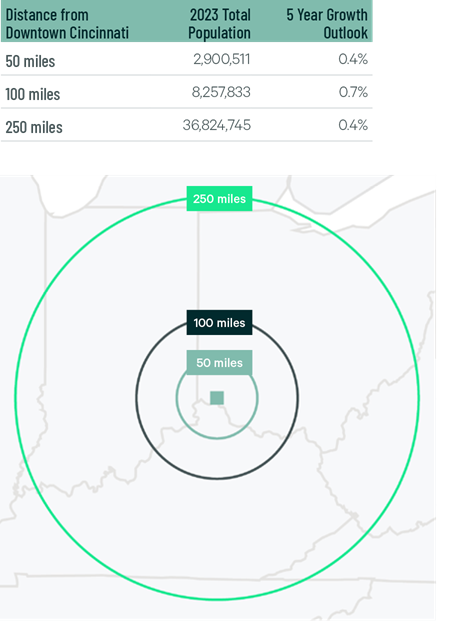
Cincinnati’s central location makes it ideal for big-box occupiers. More than 2.9 million people live within 50 miles of the market’s core, while 36.8 million live within 250 miles–more than Atlanta, Los Angeles County or Dallas-Ft. Worth.
Figure 1: Cincinnati Population Analysis
The local warehouse labor force of 53,703 is expected to grow by 7.4% by 2034, according to CBRE Labor Analytics. The average wage for a non-supervisory warehouse worker is $20.82 per hour, 17.4% above the national average.
Figure 2: Cincinnati Warehouse & Storage Labor Fundamentals
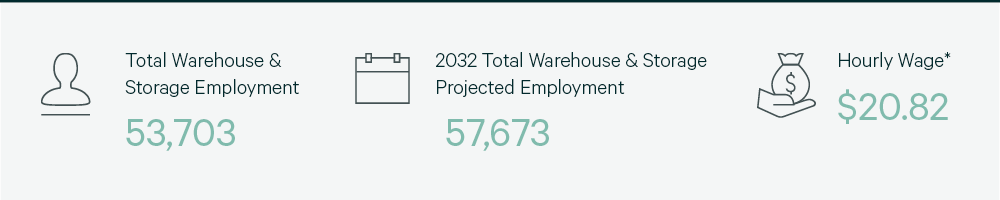
*Median wage (1 year experience); non-supervisory warehouse material handlers.
Location Incentives
Over the past five years, there have been over 500 economic incentives deals totaling more than $560 million for an average of $13,800 per new job in metro Cincinnati, according to fDi Intelligence.
CBRE’s Location Incentives Group reports that top incentive programs in Ohio include the Job Creation Tax Credit (JCTC) program. It offers a refundable performance-based tax credit calculated as a percentage of created payroll and applied toward a company’s commercial activity tax liability. JCTC was designed to create a more competitive business climate.
A top incentive program in nearby Kentucky is the Kentucky Business Investment (KBI) Program, offering income tax credits or payroll refunds to businesses engaged in manufacturing, agribusiness, headquarter operations, alternative fuel, renewable energy or carbon dioxide transmission pipelines. To qualify, companies must create and maintain an annual average of at least 10 new full-time jobs for Kentucky residents during the span of the incentive agreement.
Figure 3: Cincinnati Top Incentive Programs
Note: The extent, if any, of state and local incentive offerings depends on location and scope of the operation.
Logistics Driver
Cincinnati’s air freight capabilities separate the region from other major big-box markets. It is home to two large freight airports: Cincinnati-Northern Kentucky International Airport (CVG) and Louisville Muhammad Ali International Airport. CVG hosts DHL, FedEx and the Amazon Air Hub. Air Cargo World ranked it the world’s top air-cargo airport, based on a composite score of customer service, performance and value. Ali International is home to UPS World Port, one of the world’s largest package-handling facilities.

Air Cargo World ranked it the world’s top air-cargo airport, based on a composite score of customer service, performance and value.
Supply & Demand
Big-box leasing concluded 2023 with 7.5 million sq. ft., a 4.3% year-over-year increase but far below 2021’s record 16.8 million sq. ft. General retail & wholesale occupiers dominated leasing, accounting for 44.2% of transaction volume. Despite more leasing, vacancy rates tripled year-over-year, to 7.0%, due to reduced positive net absorption and a record 7.9 million sq. ft. in construction completions. However, despite higher vacancies, taking rents grew 28.5% annually to $5.63 psf/yr, largely driven by a nearly $2.00 psf/year increase in rents in the under-500,000 sq. ft. size range.
Challenges in the construction finance markets and increased vacancies virtually halted big-box ground-breakings in Cincinnati, with only 1.3 million sq. ft. under construction by year-end. This construction slowdown will allow the market time to absorb the available space, which should result in lower vacancies by this year’s end.
Figure 4: Share of 2023 Leasing by Occupier Type
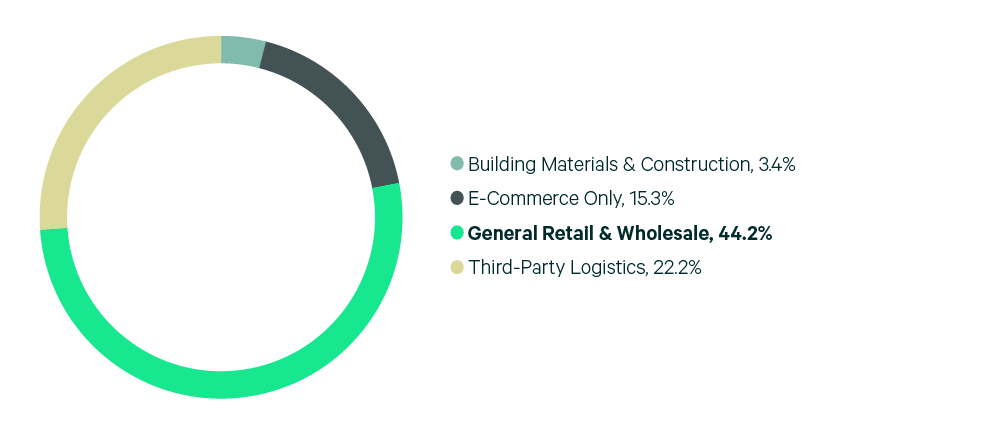
Source: CBRE Research.
Figure 5: Lease Transaction Volume by Size Range
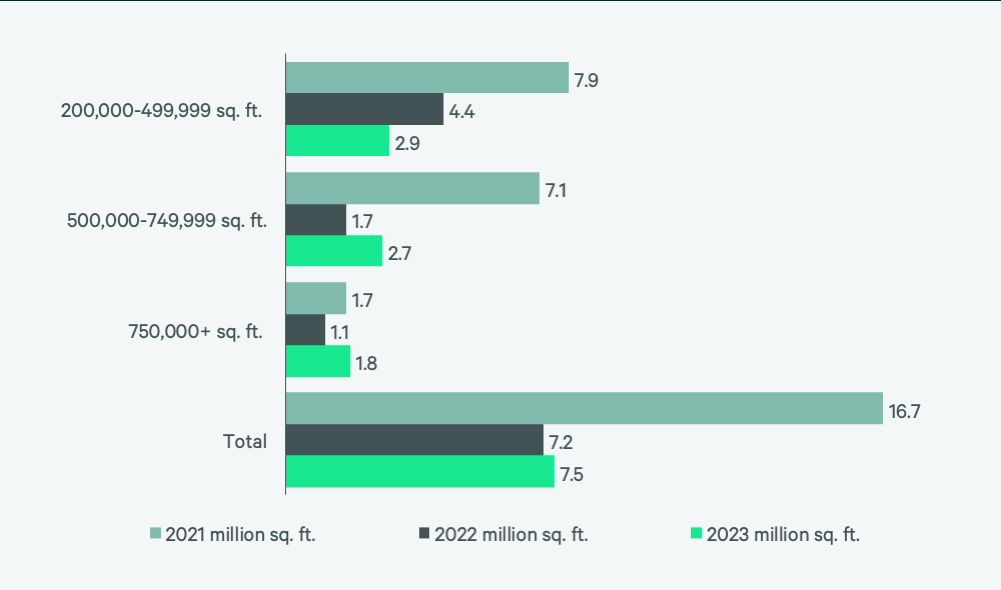
Source: CBRE Research.
Figure 6: 2023 Construction Completions vs. Overall Net Absorption by Size Range
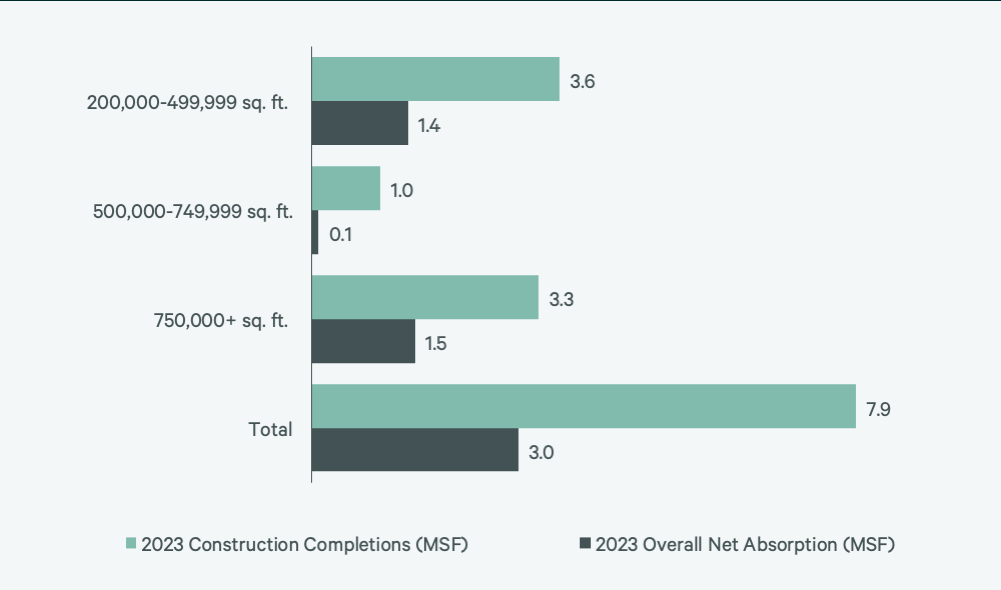
Figure 7: Direct Vacancy Rate by Size Range
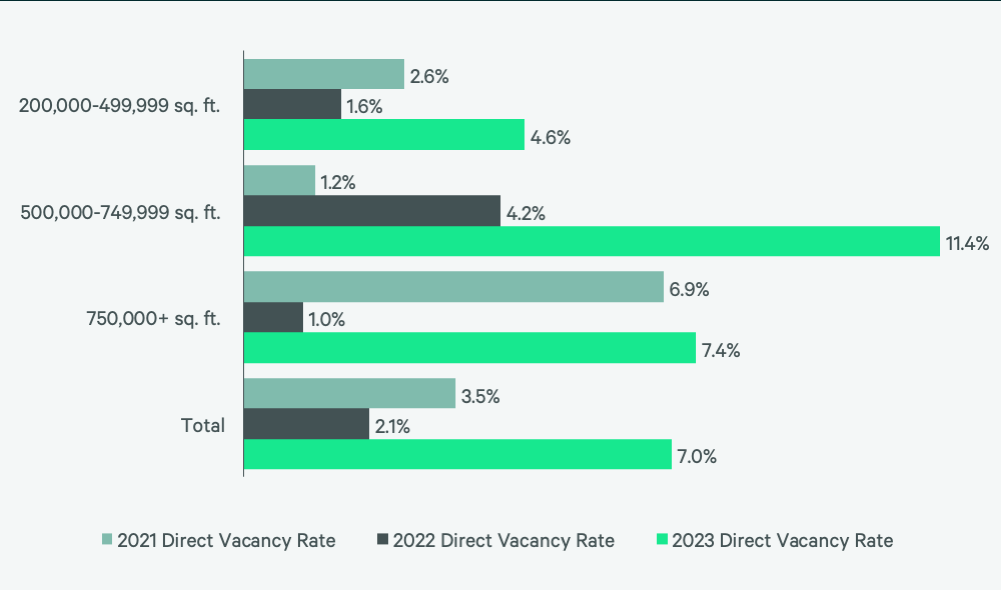
Figure 8: Under Construction & Percentage Preleased
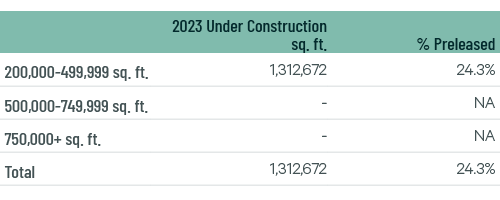
Figure 9: First Year Taking Rents (psf/yr)
Source: CBRE Research.
Explore Big-Box Insights by Market
-

More than 2.6 million people live within 50 miles of the market’s core, with a projected five-year growth rate of 1.8%.
-

Over 2.6 million people live within 50 miles of the market’s core, with a 1.9% expected five-year growth rate.
-

Nearly 30 million people—24% aged 18-34—live within 250 miles of downtown Louisville.
Industrial & Logistics Research
James Breeze
Vice President, Global Industrial and Retail Research

John Morris
President, Americas Industrial & Logistics, Advisory Services