Future Cities
Toronto Market
2025 North America Industrial Big-Box Review & Outlook
April 16, 2025 5 Minute Read

Supply & Demand
Toronto, with 277 million sq. ft. of total inventory, is Canada’s largest big-box market and North America’s seventh-largest. However, 2023 saw a dramatic rise in vacancy rates to 5.1%, up from 0.8% in 2022, driven by 3 million sq. ft. of negative net absorptions and 11.6 million sq. ft. of construction completions. Net absorption remained negative even with solid leasing performance that matched 2022’s 8.9 million sq. ft. A diverse group of occupiers was active in Toronto, with 3PLs leading at 42.9% and general retailers & wholesalers following at 33.3% of leasing.
An additional 8.8 million sq. ft. of industrial big-box space is currently under construction, with most set to complete in 2024. Given this development and the prevailing economic uncertainty in Canada, vacancy rates are expected to hold steady at their current levels over the coming quarters, potentially stabilizing rent growth in 2024.
Figure 4: Share of 2023 Leasing by Occupier Type
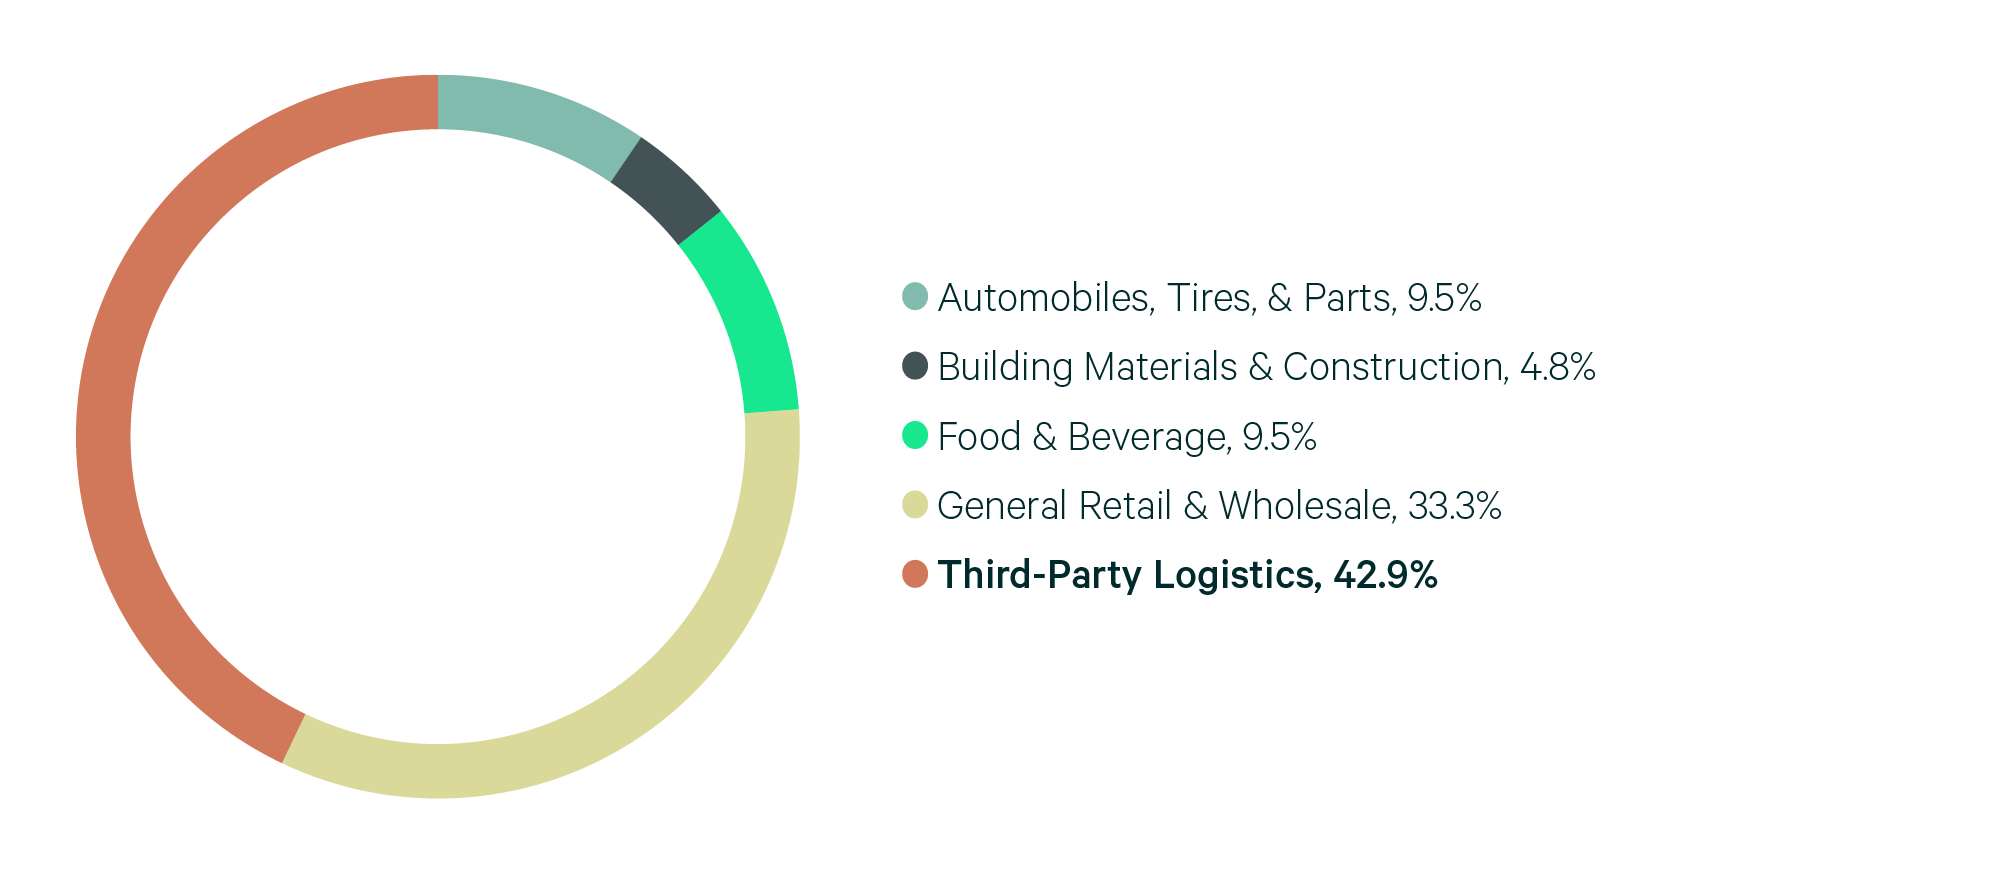
Source: CBRE Research.
Figure 5: Lease Transaction Volume by Size Range
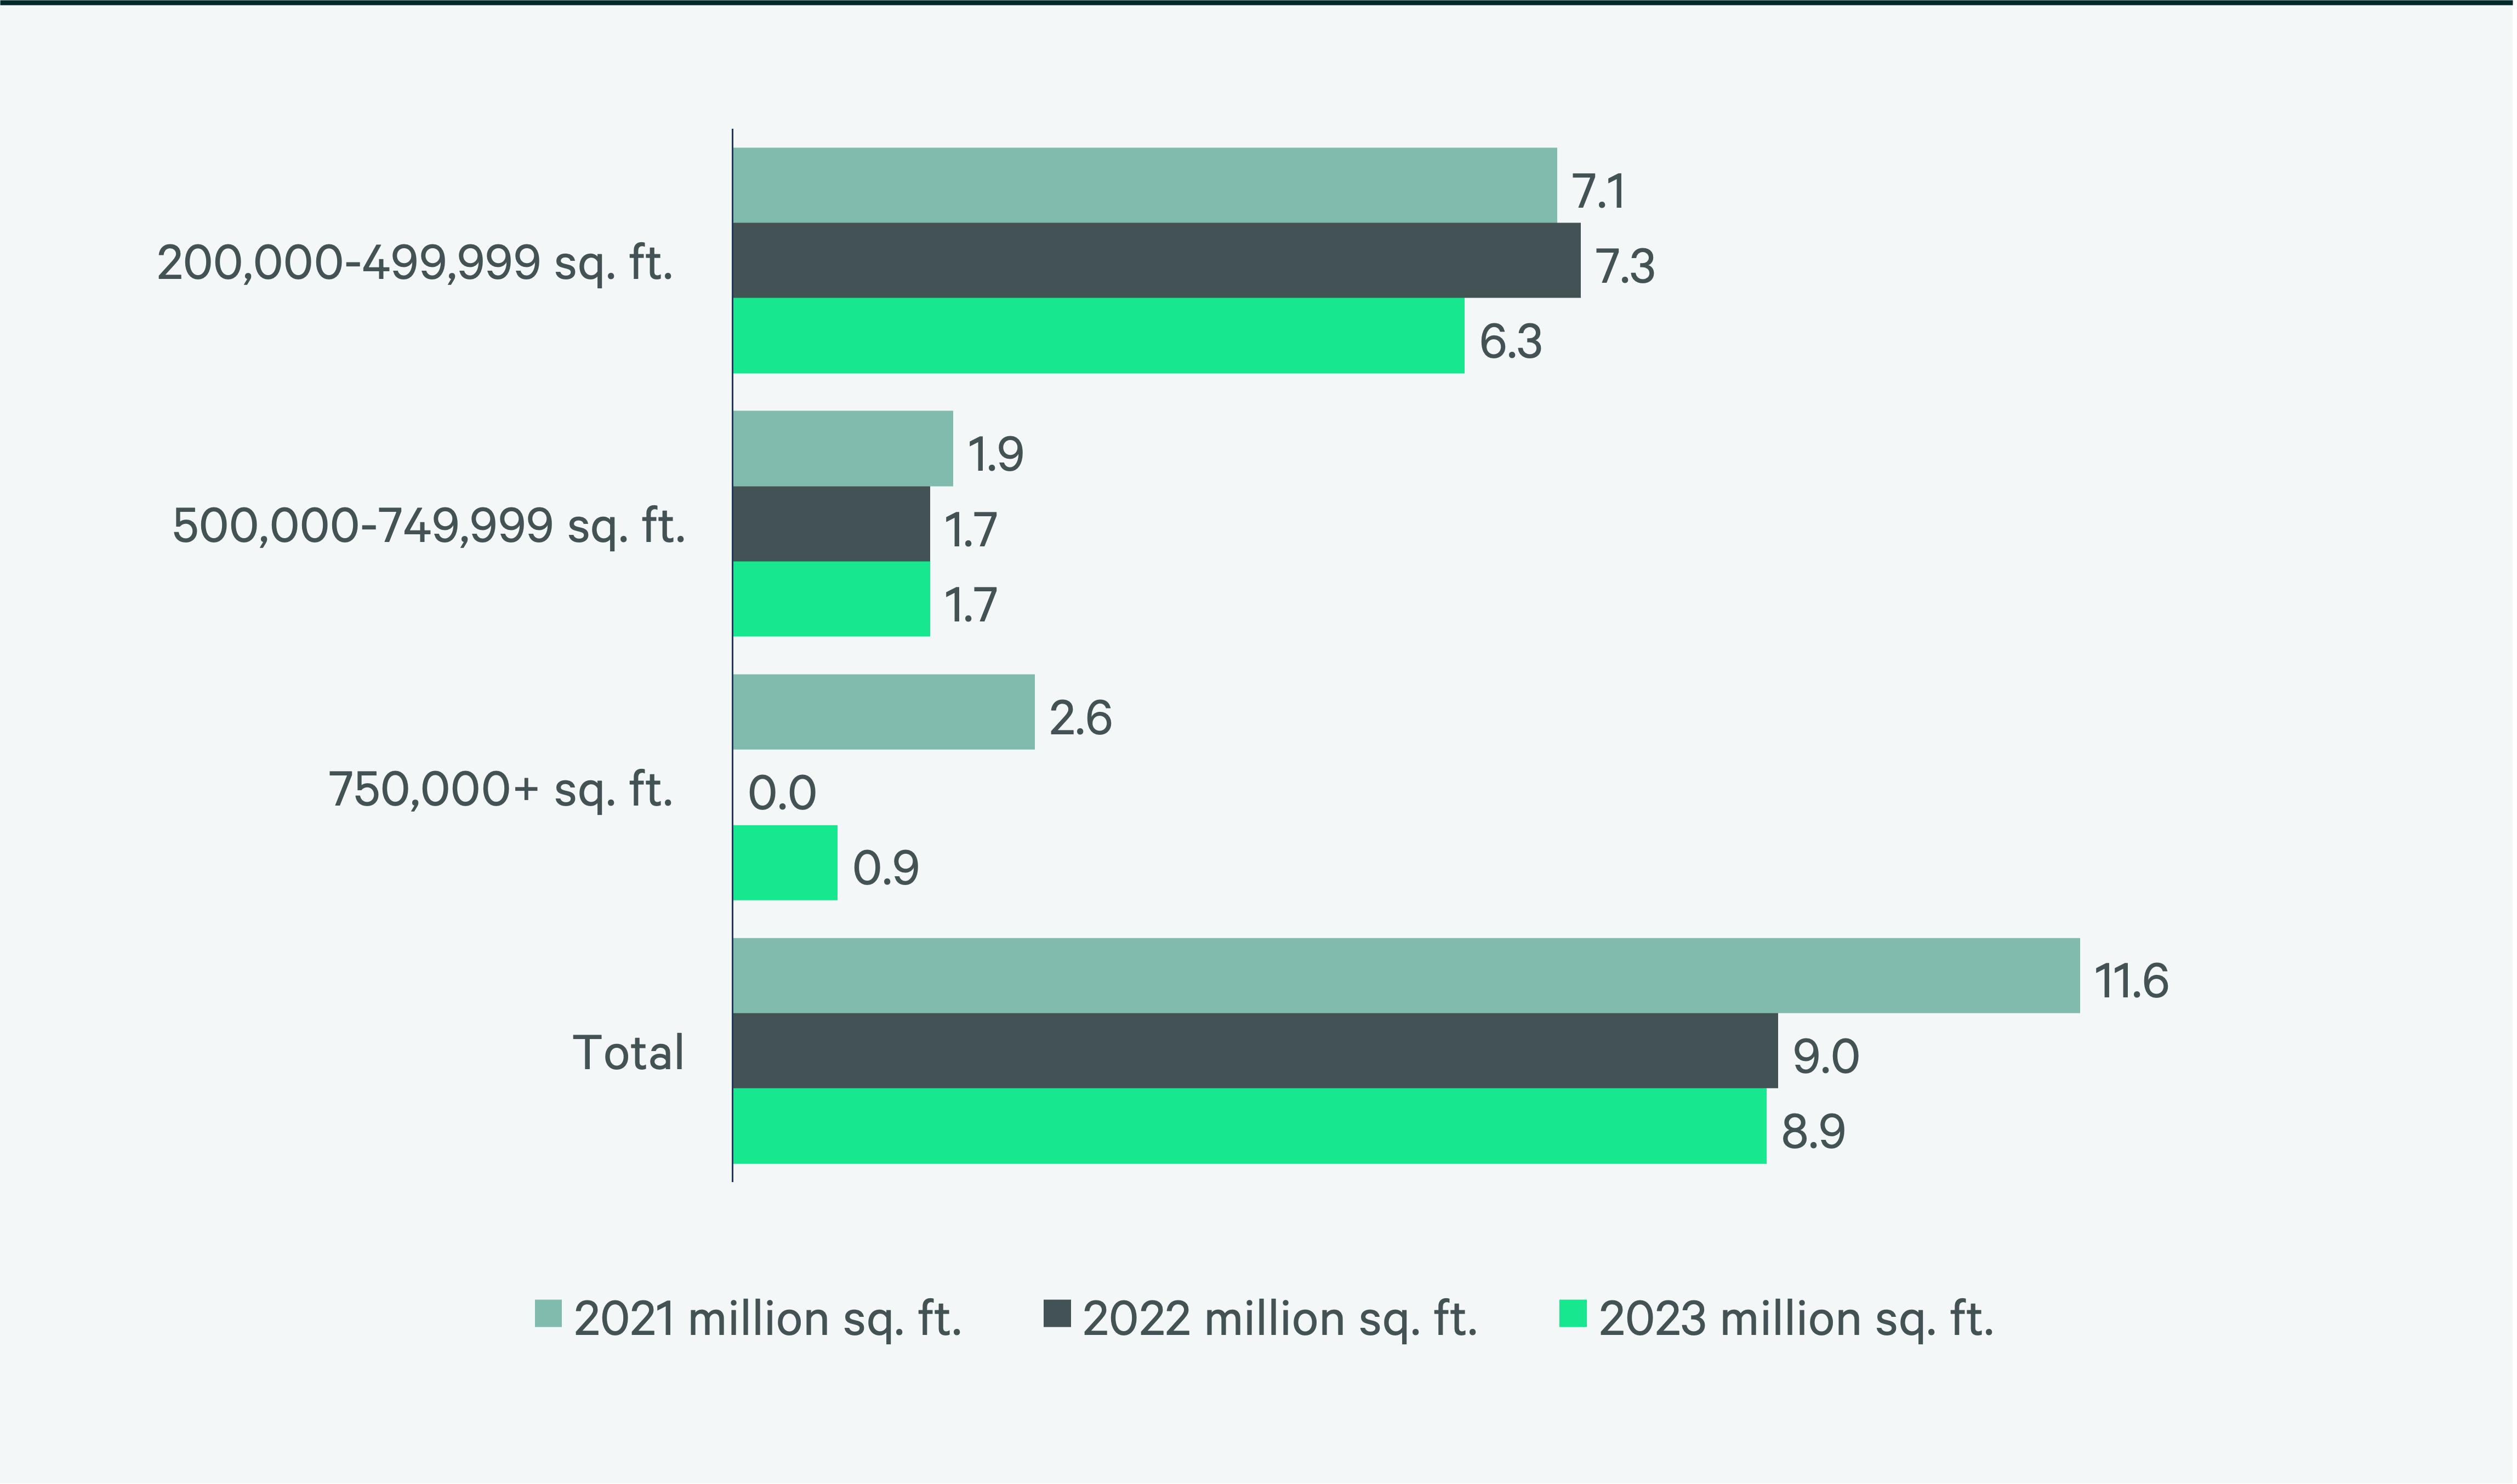
Source: CBRE Research.
Figure 6: 2023 Construction Completions vs. Overall Net Absorption by Size Range
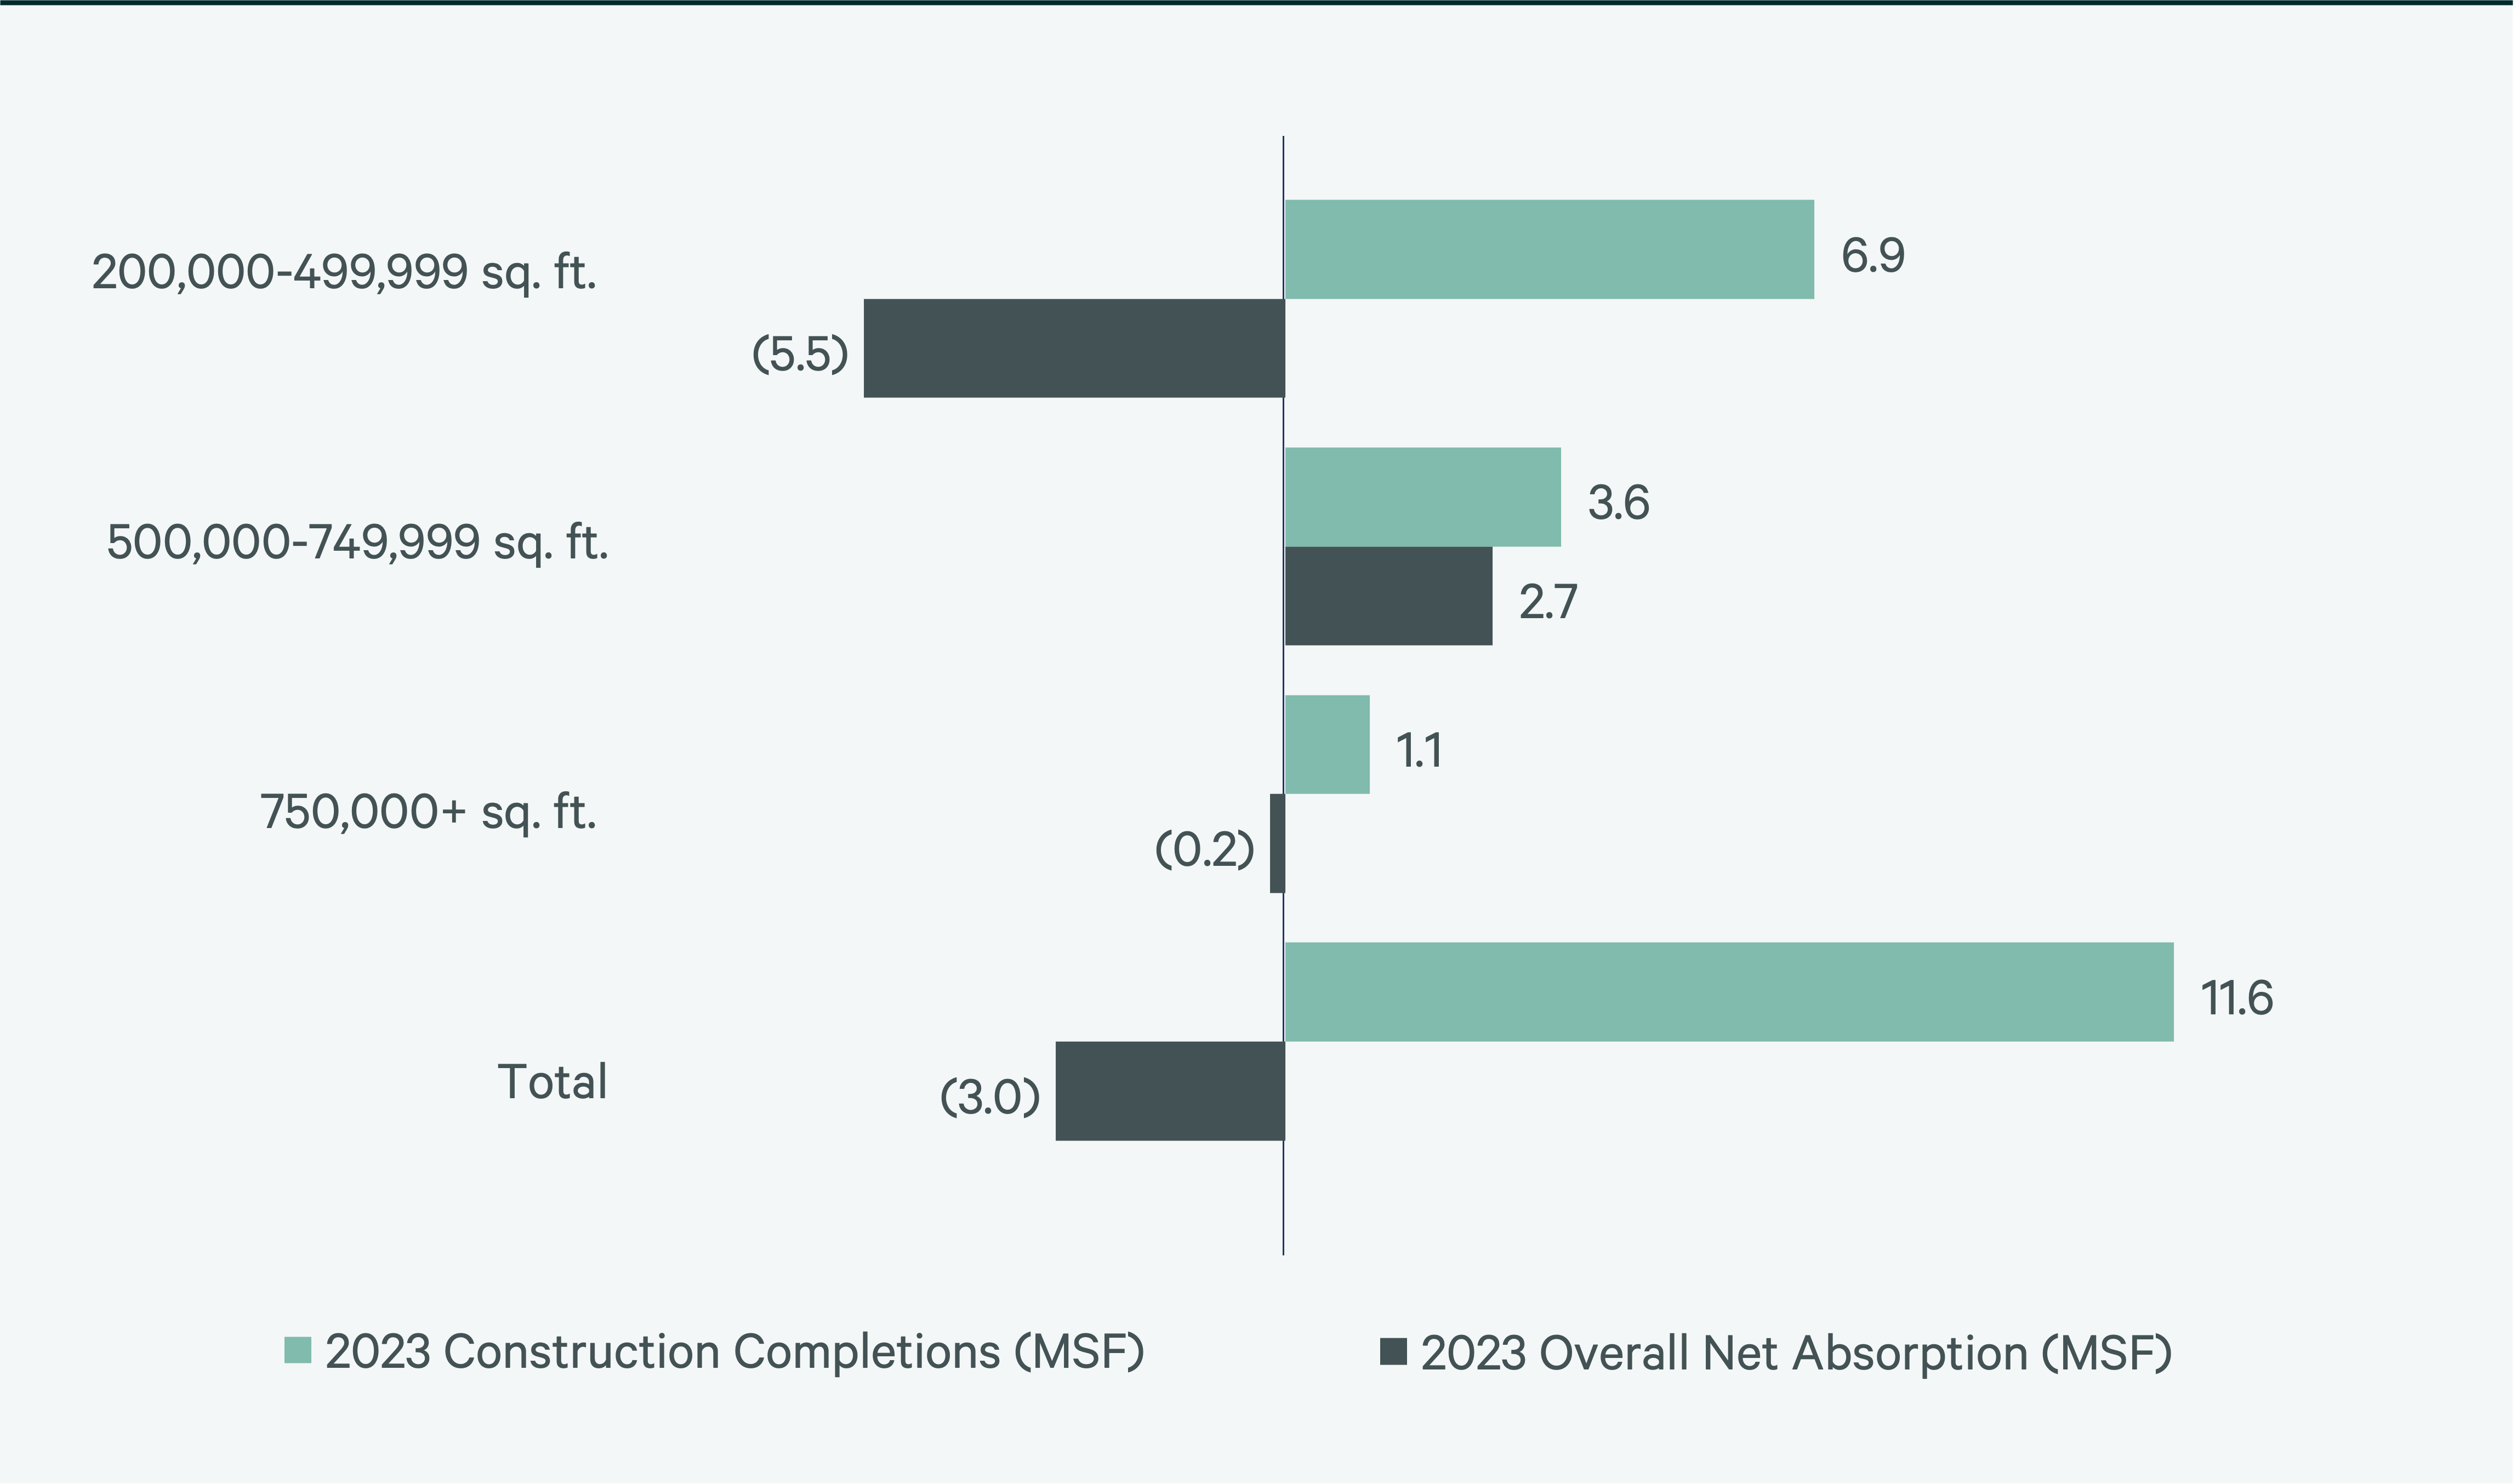
Figure 7: Direct Vacancy Rate by Size Range
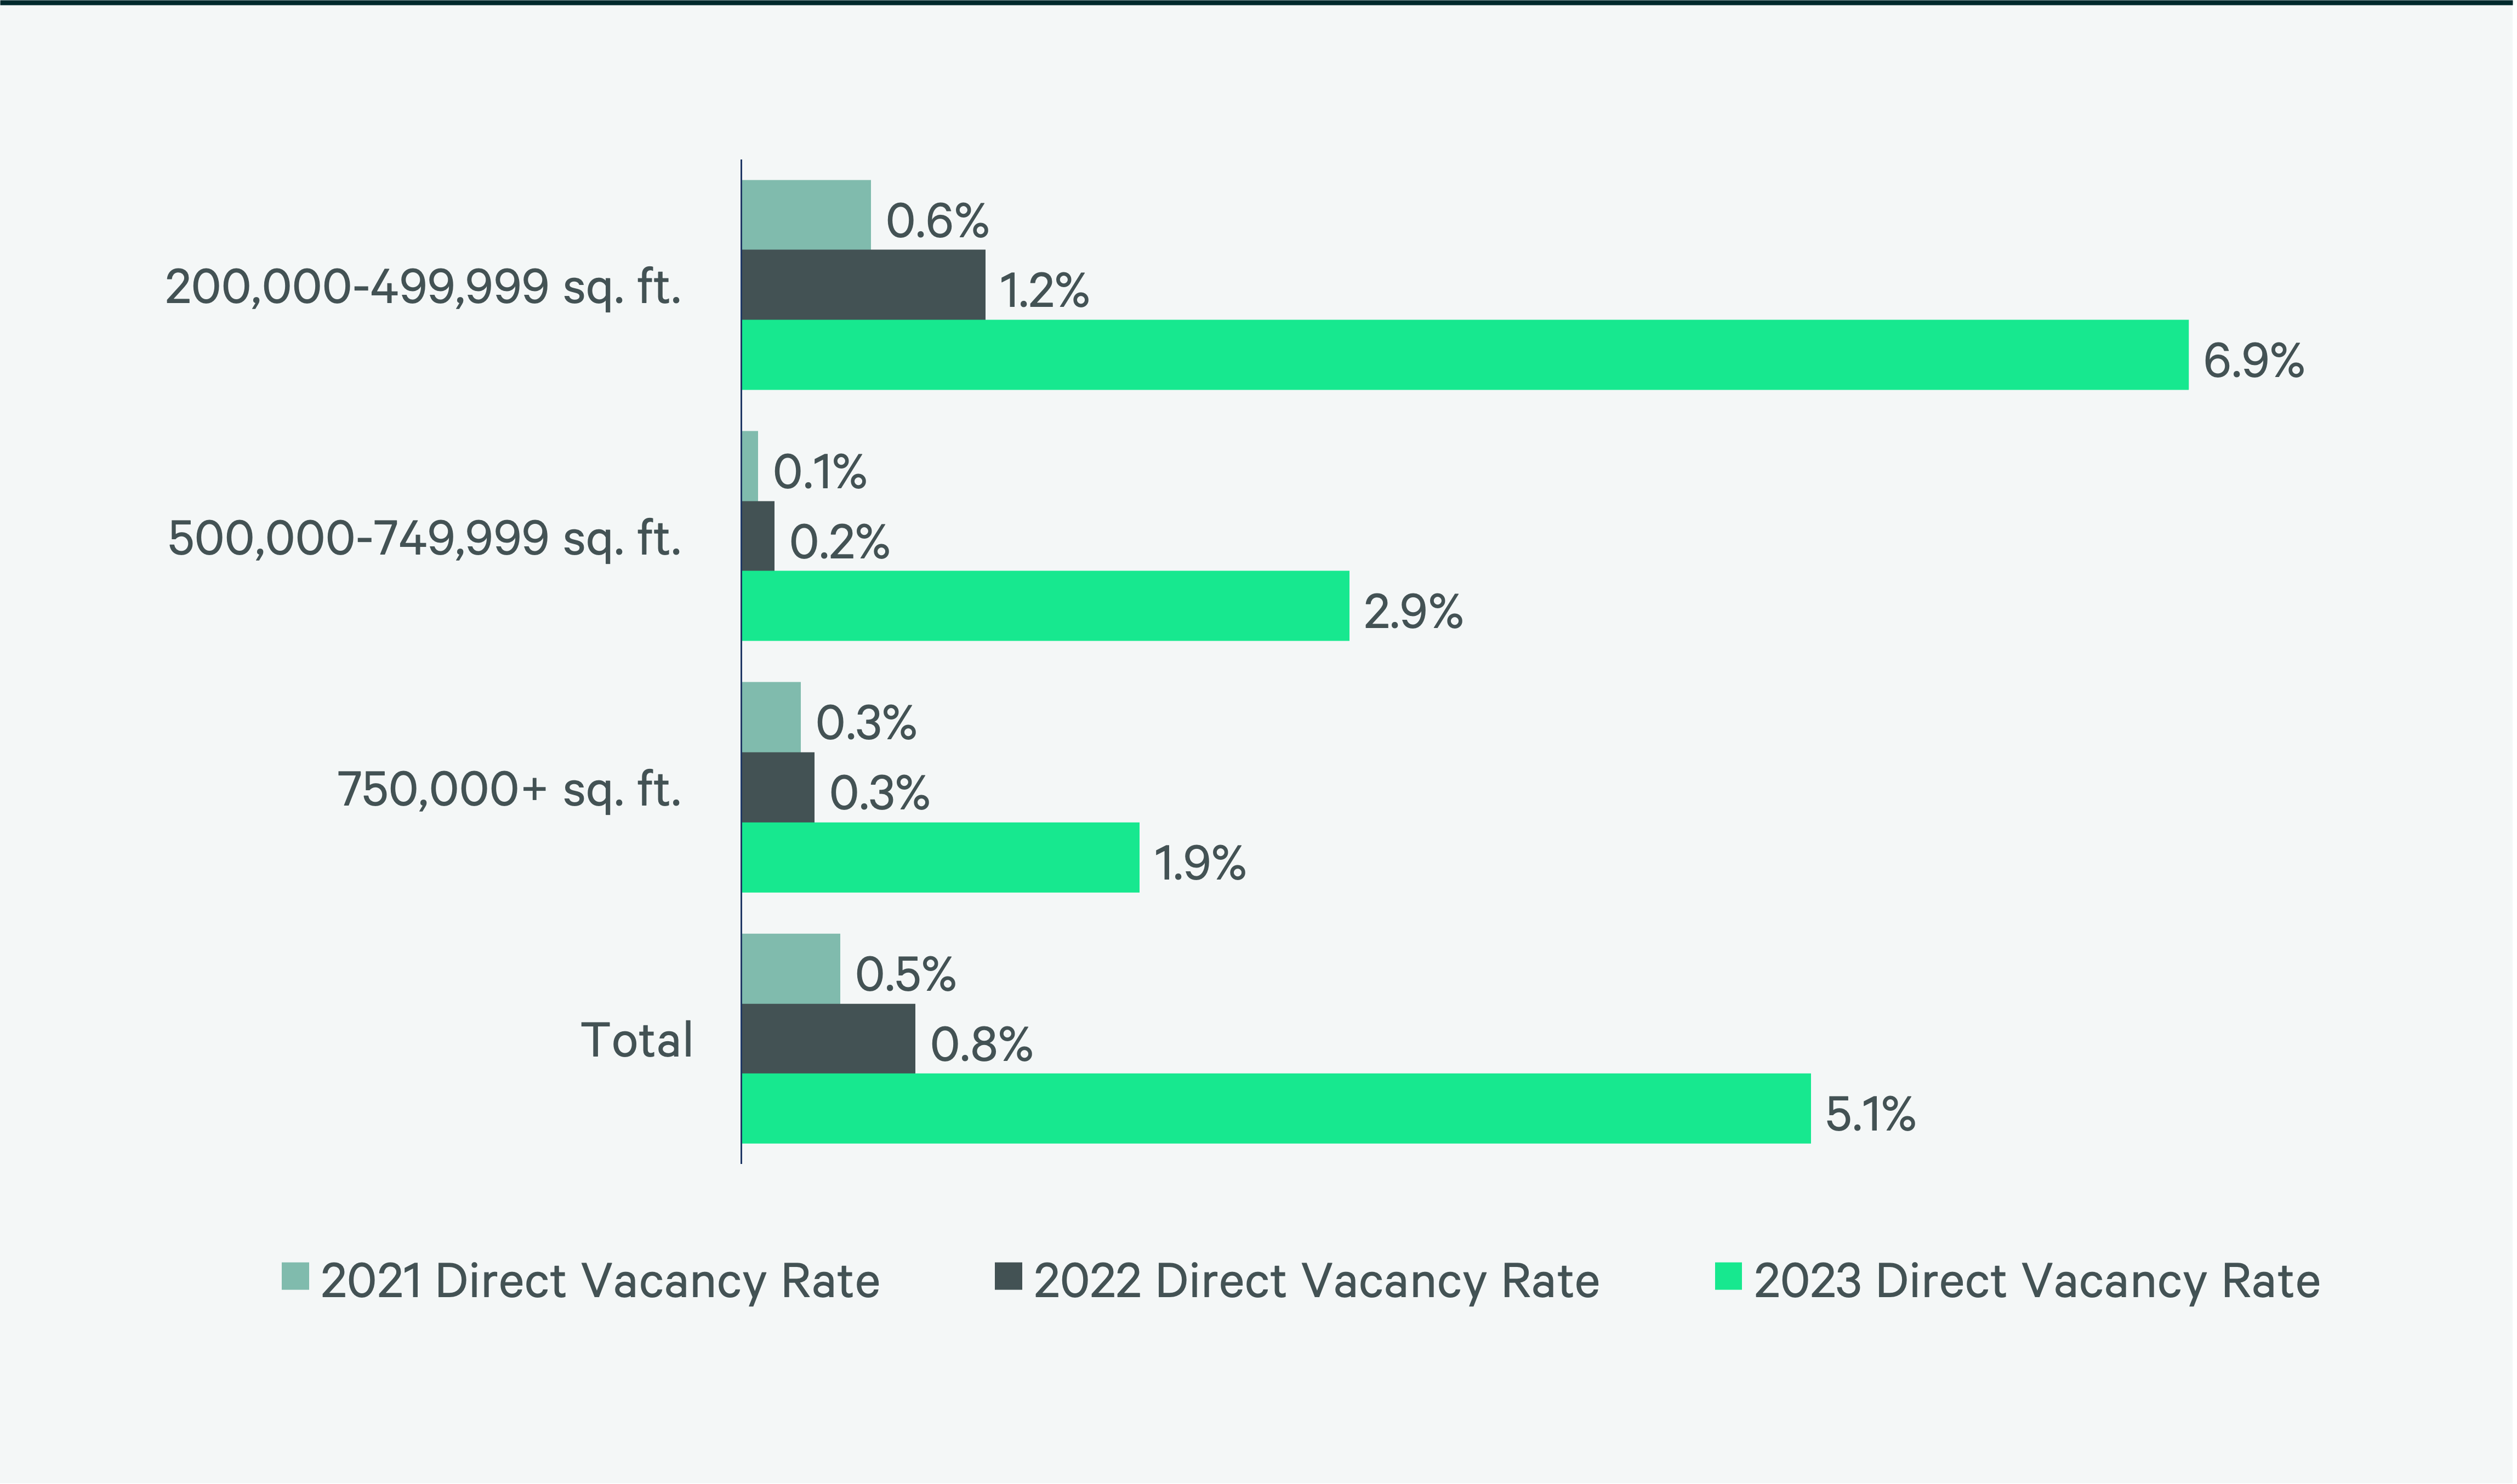
Figure 8: Under Construction & Percentage Preleased
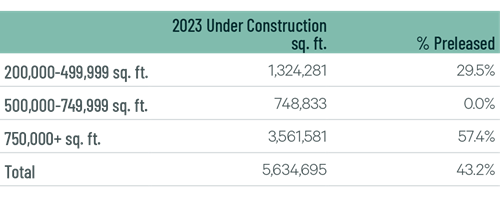
Figure 9: First Year Taking Rents (psf/yr)
Source: CBRE Research.
Explore Big-Box Insights by Market
Industrial & Logistics Research
James Breeze
Vice President, Global Industrial and Retail Research

John Morris
President, Americas Industrial & Logistics, Advisory Services