Future Cities
Puget Sound Market
2025 North America Industrial Big-Box Review & Outlook
April 16, 2025 5 Minute Read

Supply & Demand
Puget Sound was one of the few big-box markets to post year-over-year growth in lease transaction, reaching 8.2 million sq. ft. leased, an increase of 100,000 sq. ft. from 2022. Despite slightly increased leasing, net absorption decreased to 1 million sq. ft. This reduction, coupled with 4 million sq. ft. of construction completions, drove the overall vacancy rate up to 5.7%. Most of this vacancy rate increase occurred in buildings smaller than 500,000 sq. ft., which ended 2023 with a vacancy rate of 7.8%, significantly higher than 2022’s 4.4% rate. General retailers & wholesalers were the top occupier in 2023, accounting for 63.8% of total lease volume.
6.7 million sq. ft. was under construction at year-end, with nearly half of it preleased. The over 3 million sq. ft. of space under construction delivering this year will likely prevent significantly lowered vacancy. However, the market will likely not experience a strongly rising vacancy rate in the coming quarters either.
Figure 4: Share of 2023 Leasing by Occupier Type
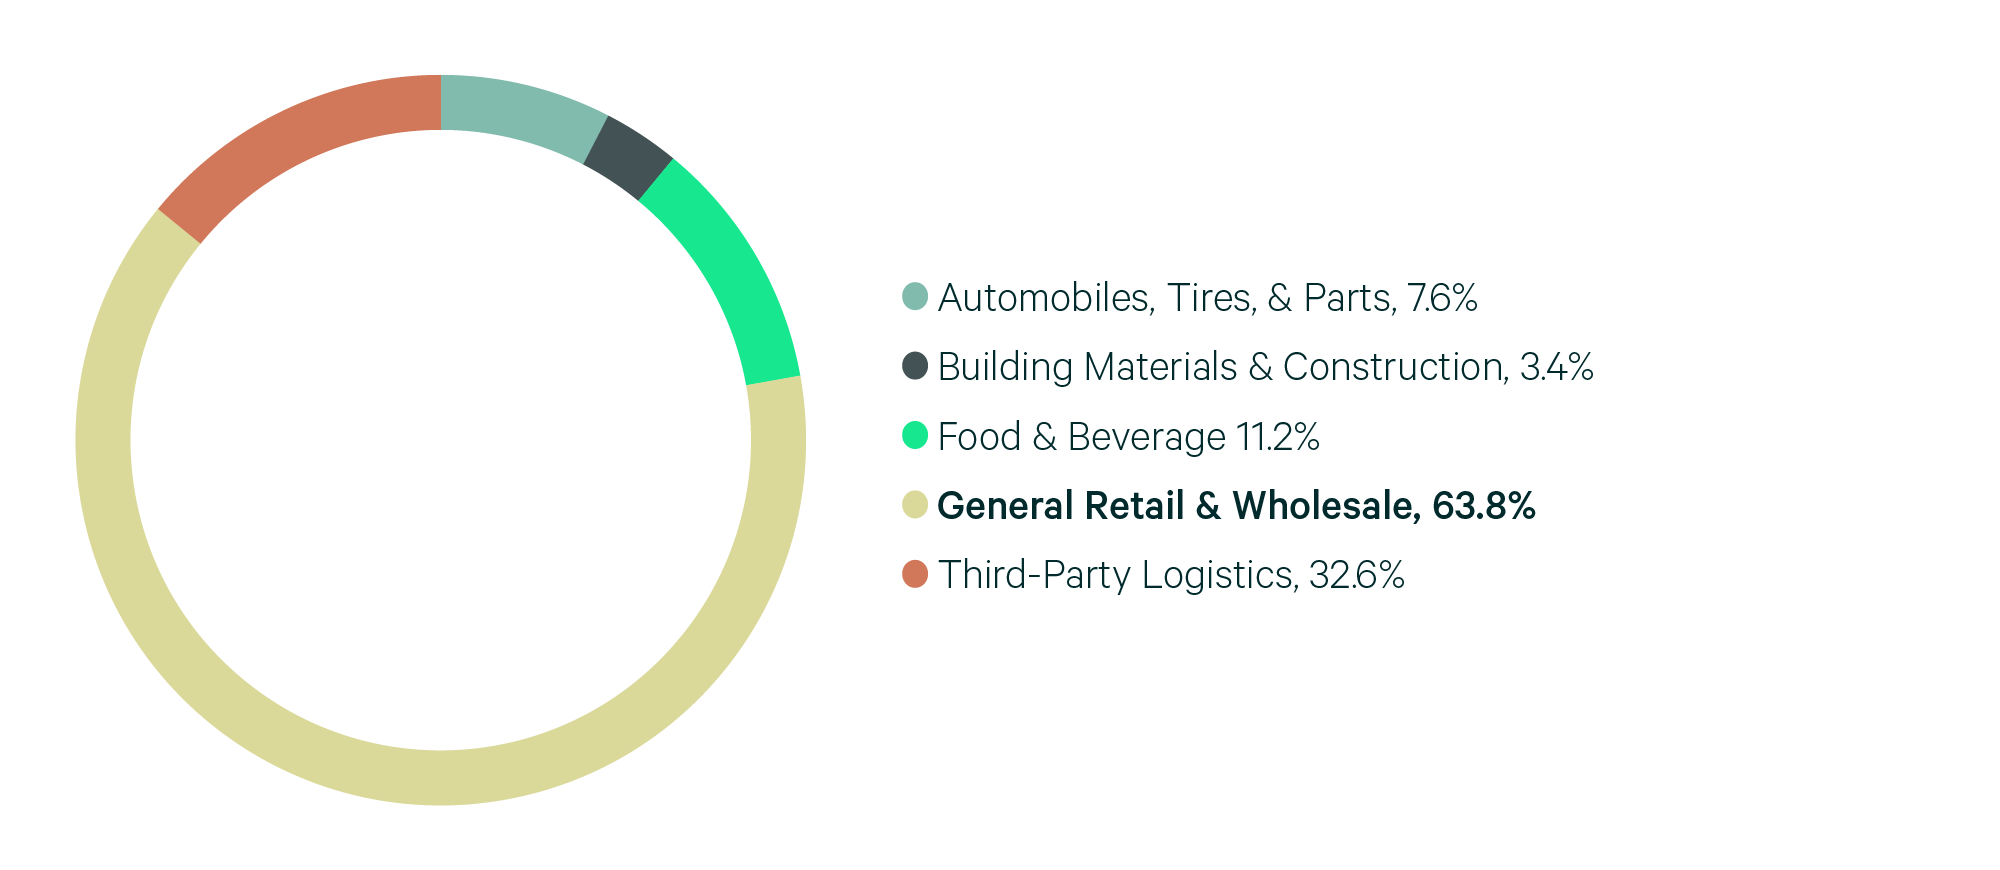
Source: CBRE Research.
Figure 5: Lease Transaction Volume by Size Range
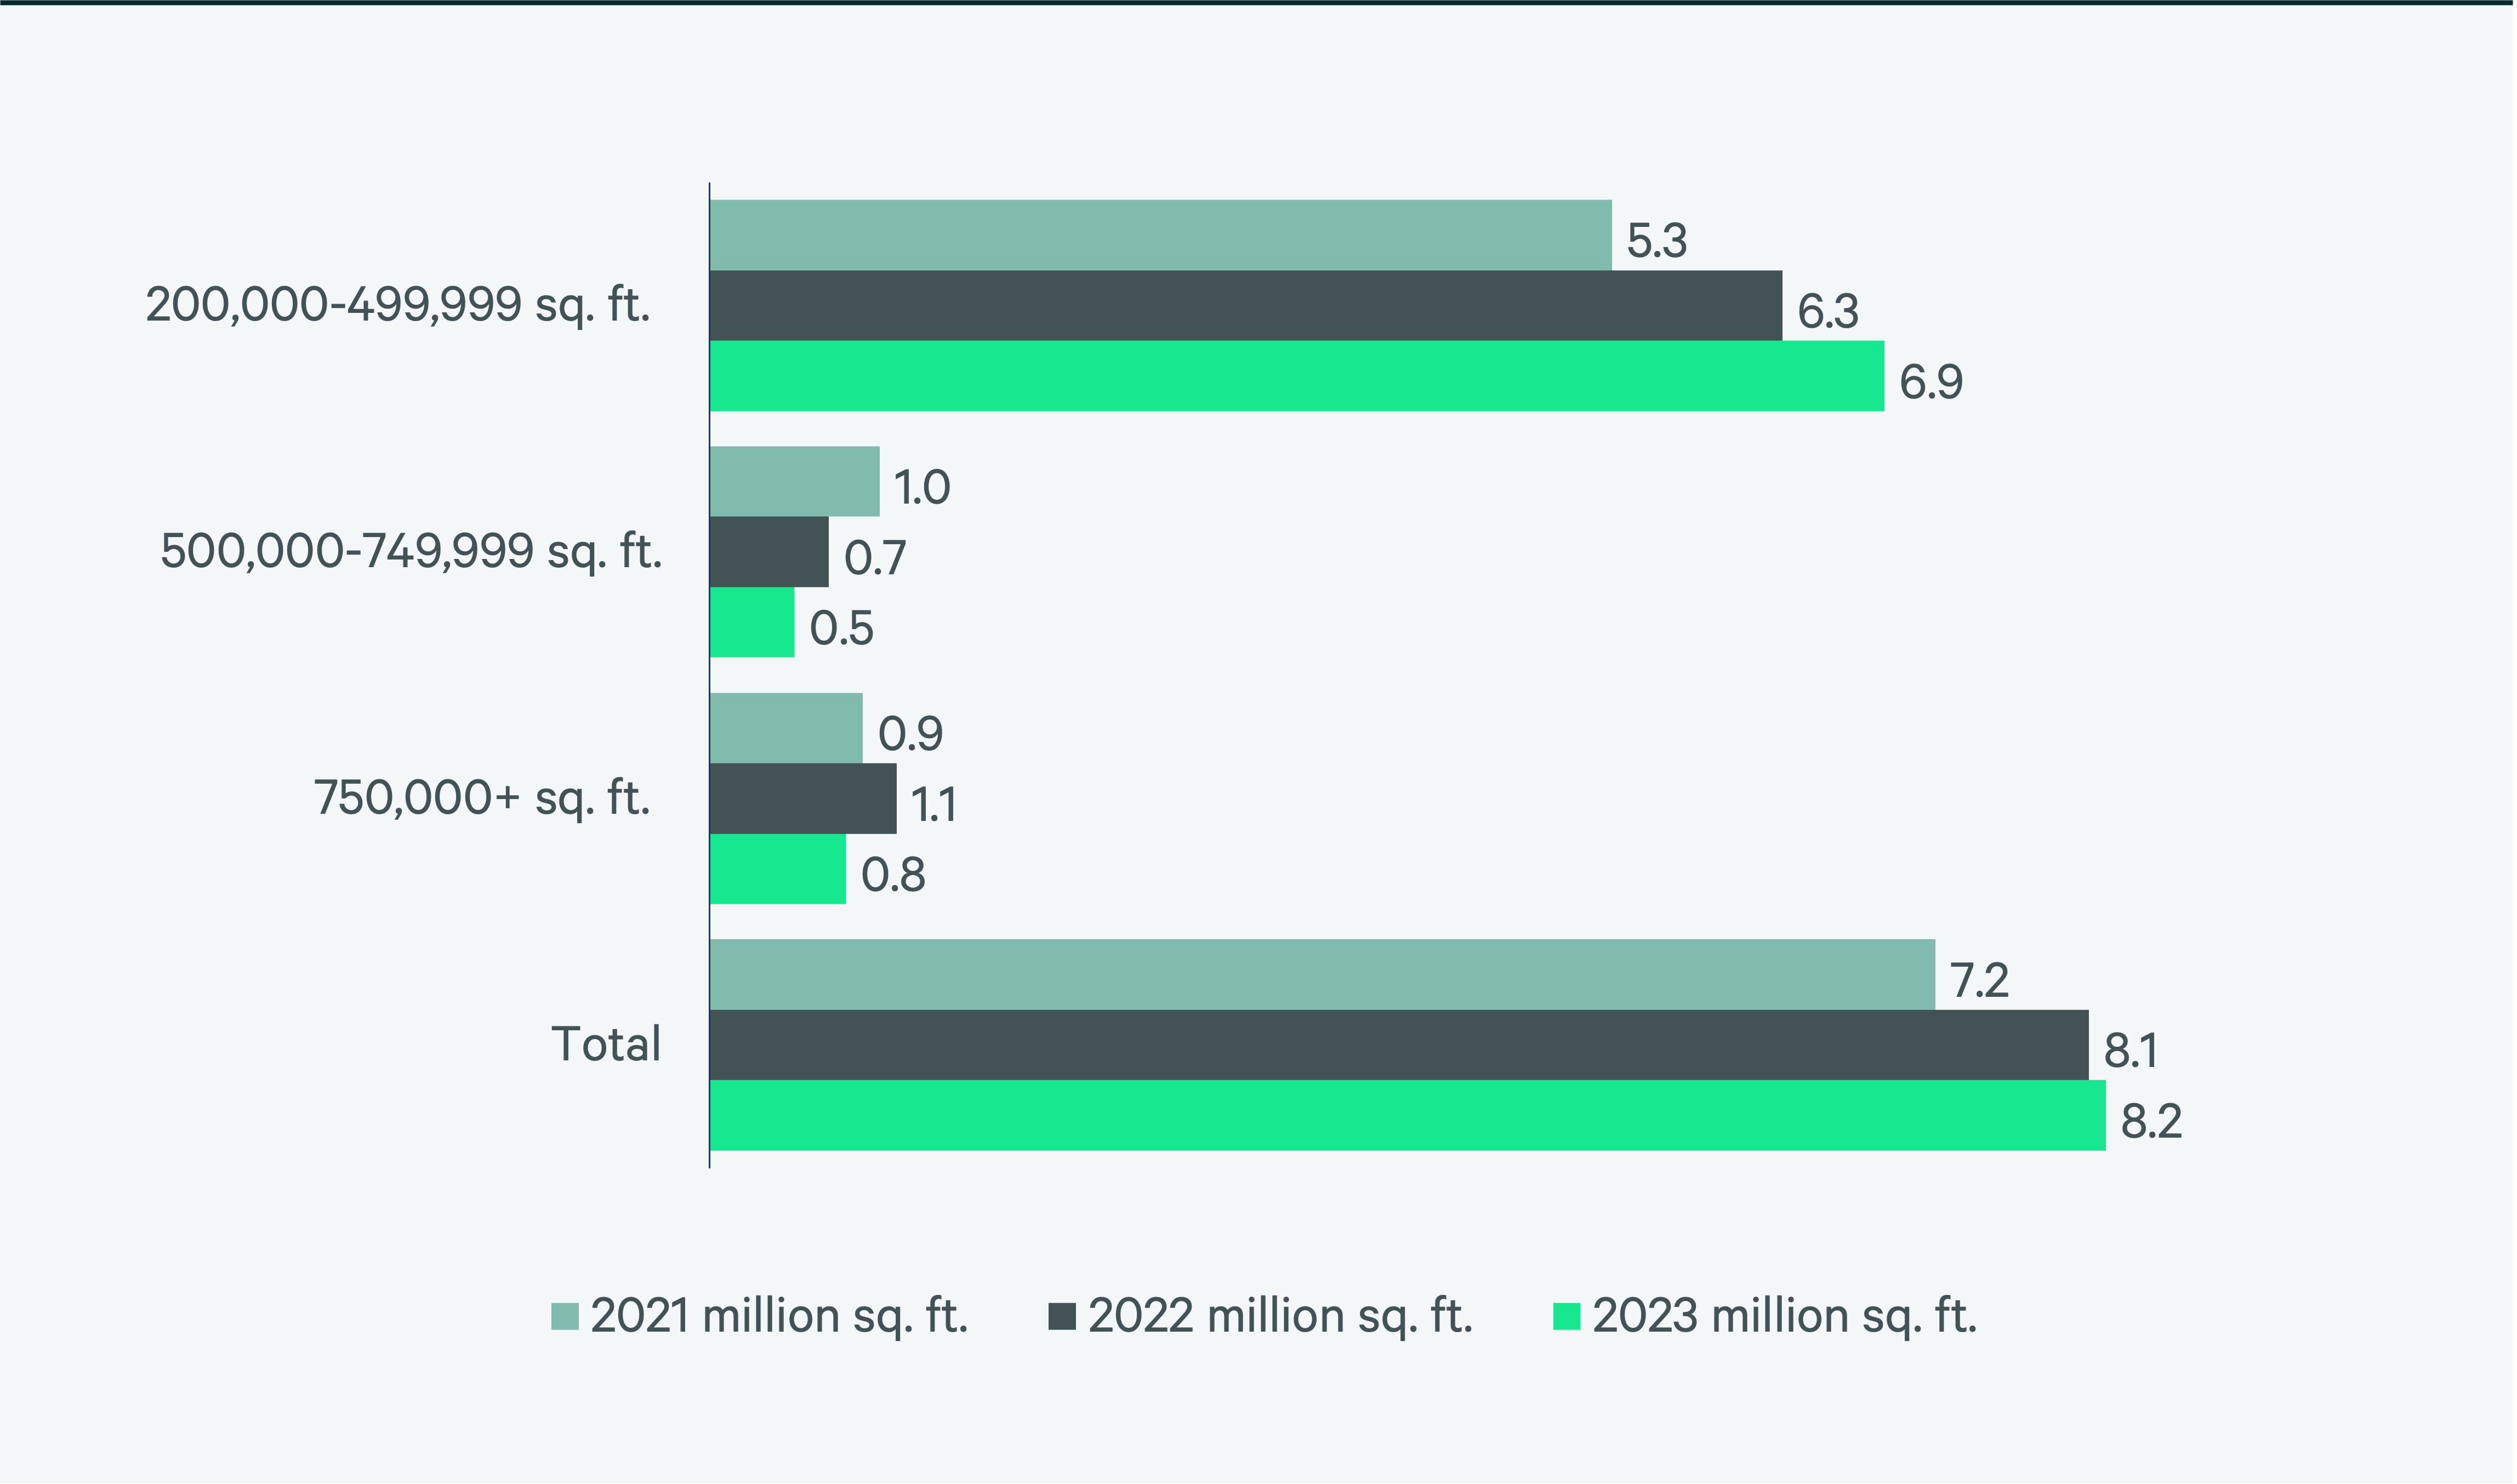
Source: CBRE Research.
Figure 6: 2023 Construction Completions vs. Overall Net Absorption by Size Range
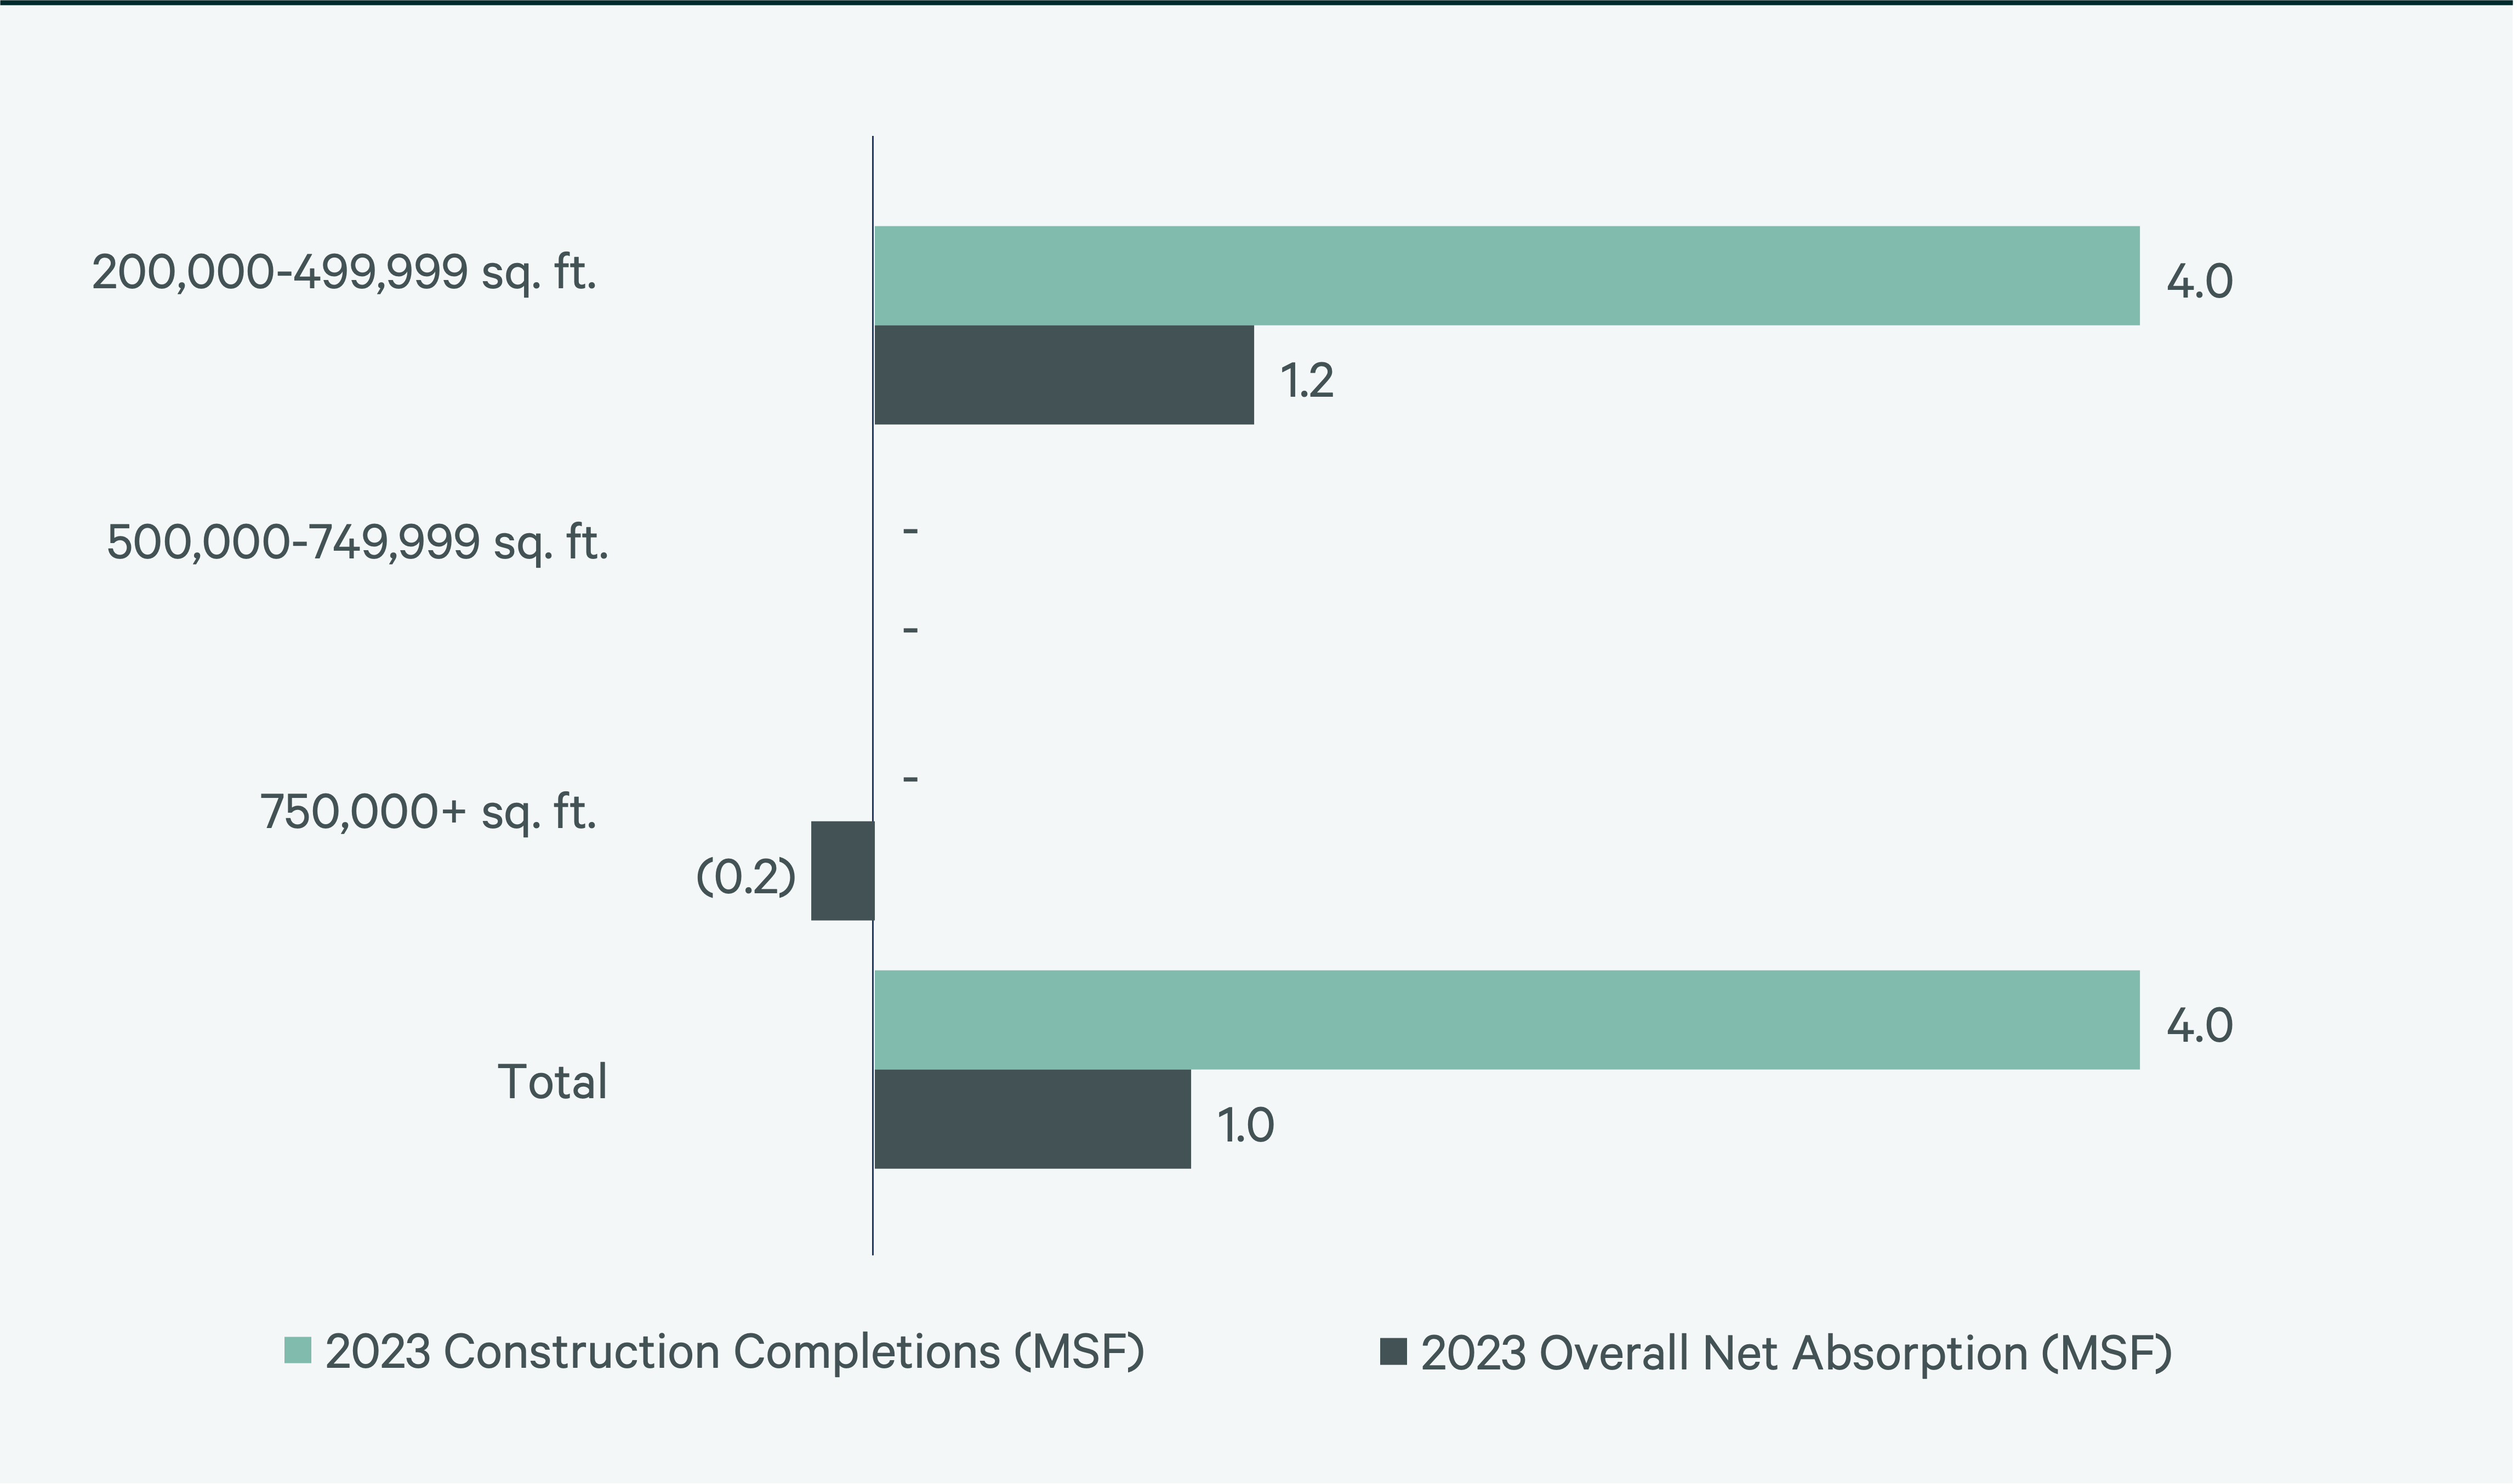
Figure 7: Direct Vacancy Rate by Size Range
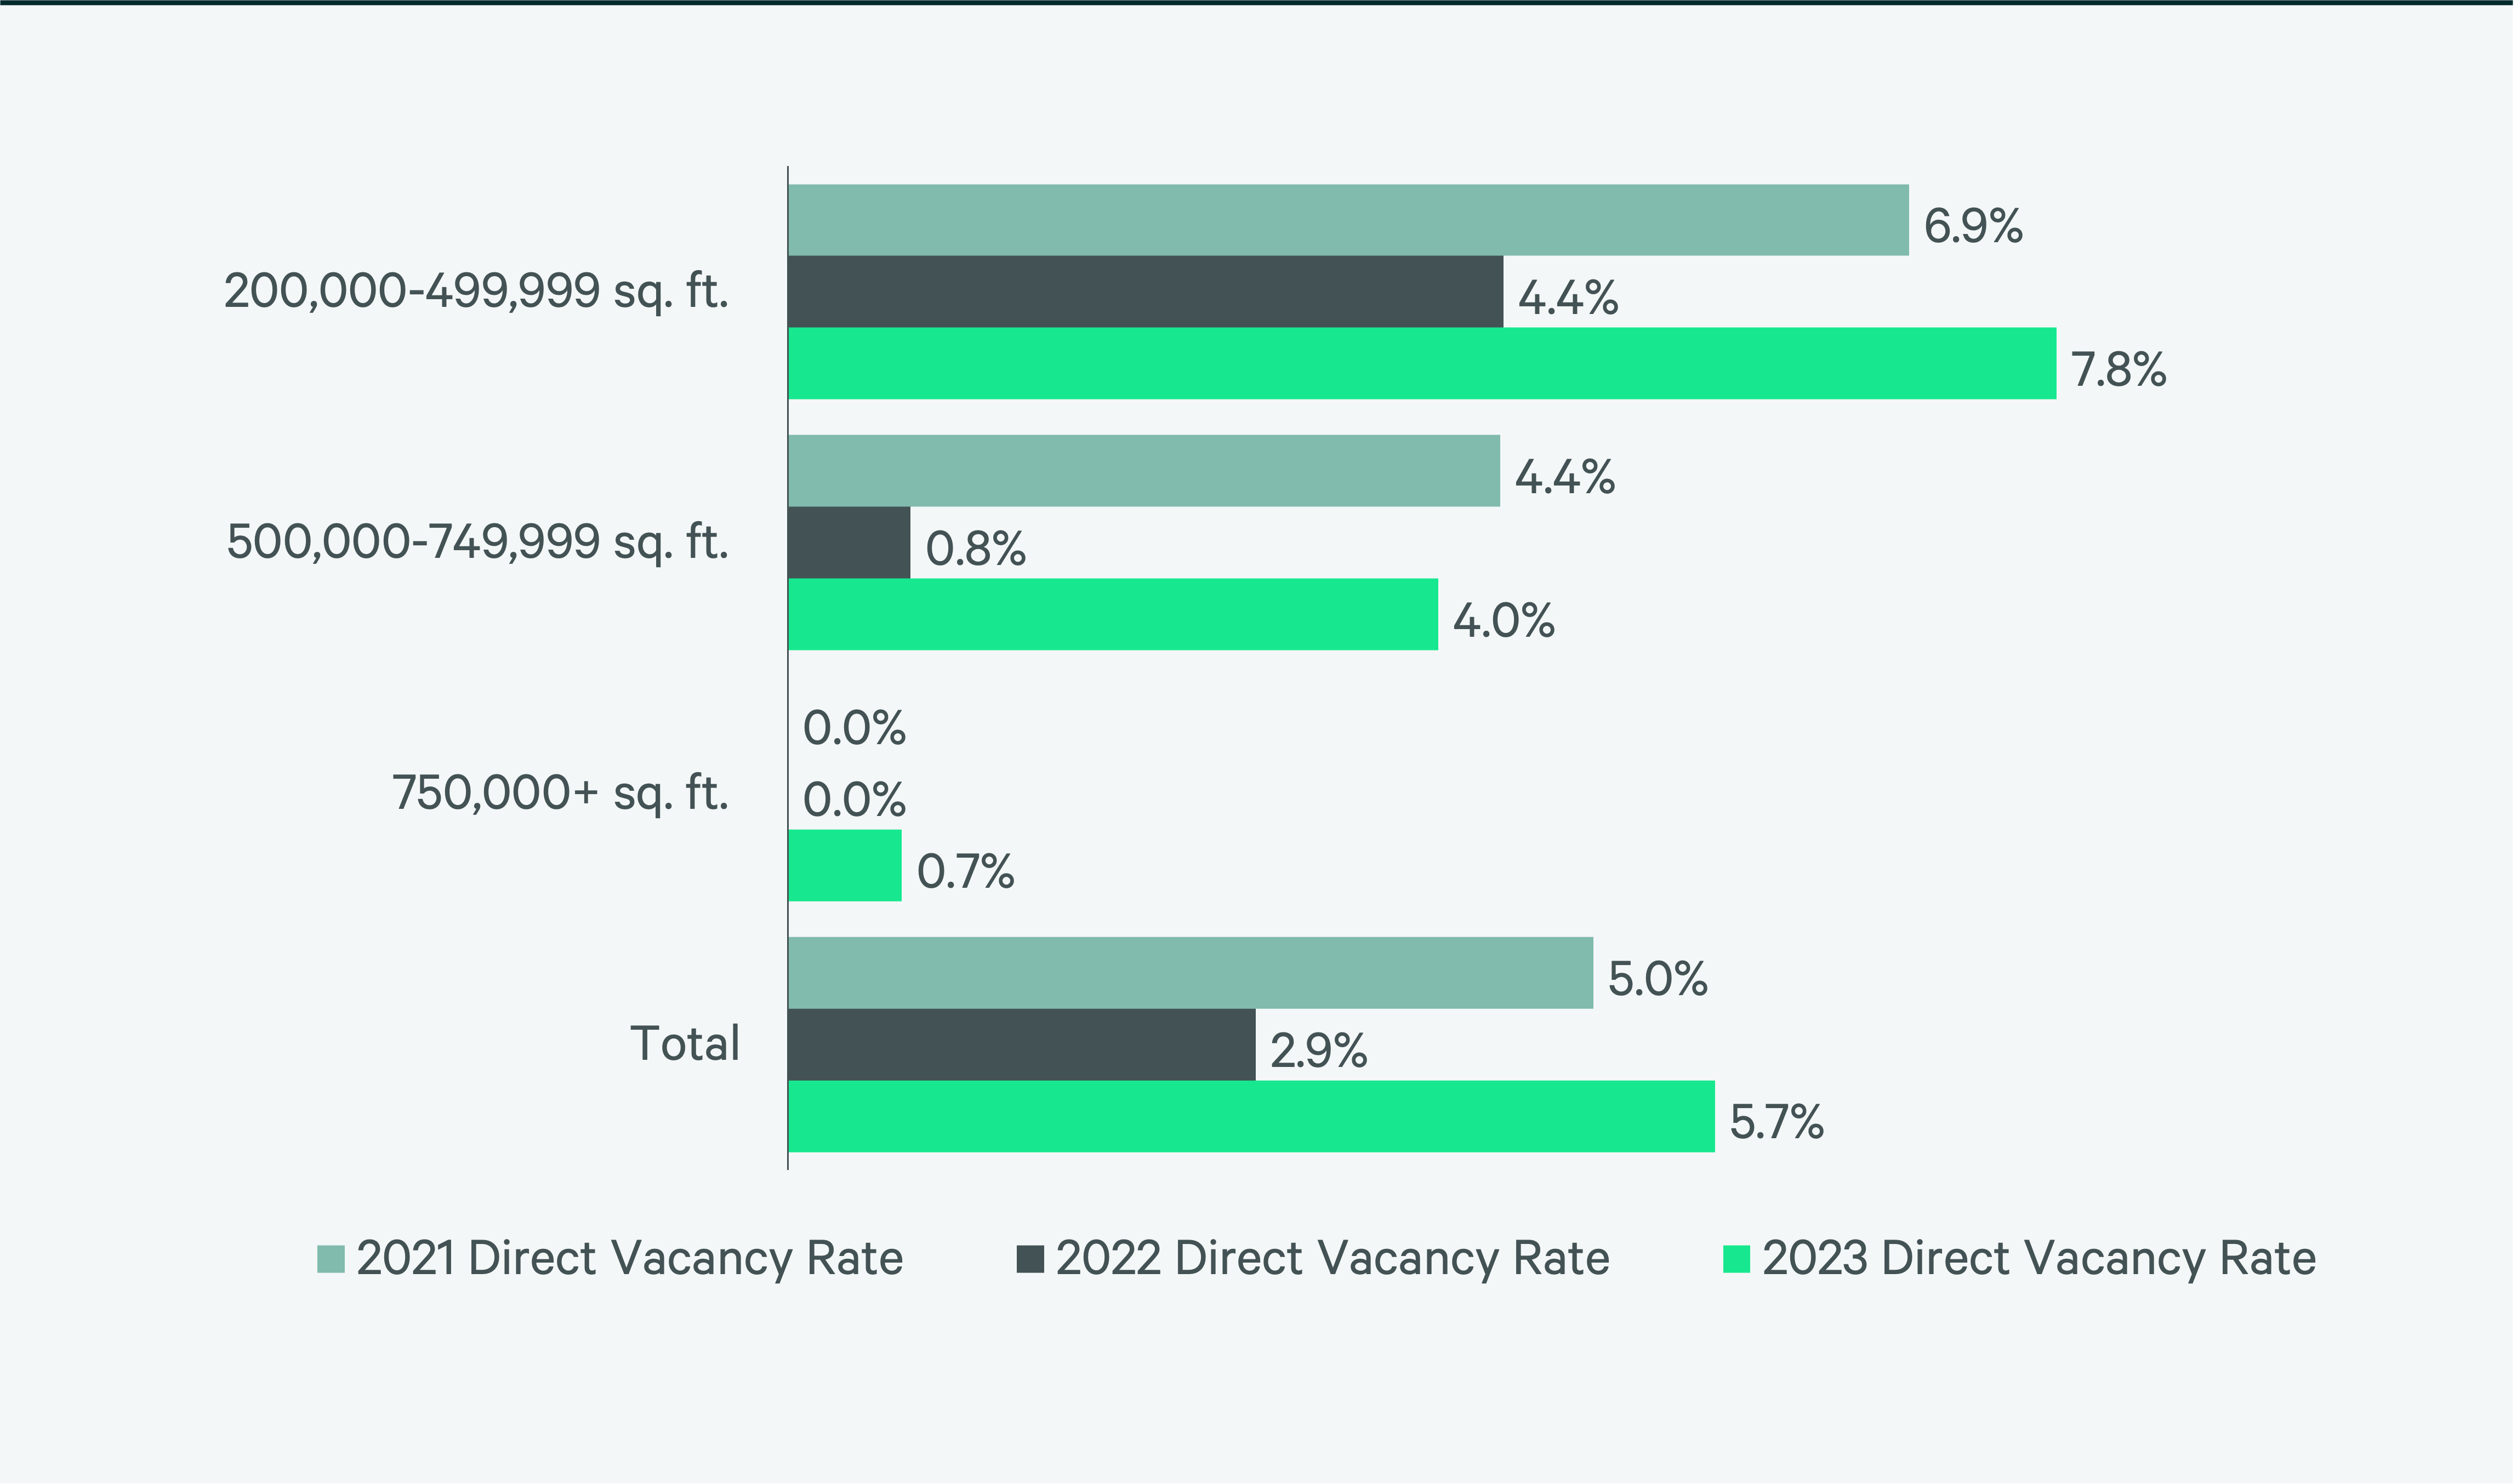
Figure 8: Under Construction & Percentage Preleased
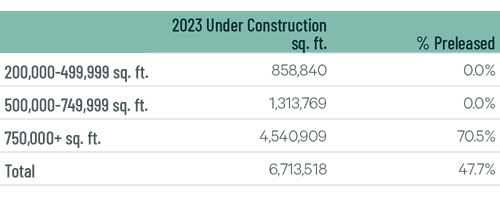
Figure 9: First Year Taking Rents (psf/yr)
Source: CBRE Research.
Explore Big-Box Insights by Market
Industrial & Logistics Research
James Breeze
Vice President, Global Industrial and Retail Research

John Morris
President, Americas Industrial & Logistics, Advisory Services