Future Cities
Los Angeles County Market
2025 North America Industrial Big-Box Review & Outlook
April 16, 2025 5 Minute Read

Supply & Demand
Los Angeles County, one of North America’s most established big-box markets, is dominated by buildings constructed before 2000, with 85% of the total inventory under 500,000 sq. ft. The region has North America’s second-lowest direct vacancy rate, at 1.6%. Lease renewals accounted for more than half of the market’s transaction volume of 8.1 million sq. ft., all of which were in spaces under 500,000 sq. ft. Despite land constraints, the market was able to complete 2.5 million sq. ft. of new construction, doubling last year’s total. Los Angeles County remains the most expensive big-box market in this report, with taking rents averaging $19.67 psf/yr, a year-over-year increase of just over 4%. 3PLs remained the dominant occupier, accounting for 40.5% of lease volume. They benefited from the market’s proximity to the ports of Los Angeles and Long Beach.
Los Angeles County will remain one of the tightest and most expensive big-box markets in North America due to land constraints. There is just over 4.3 million sq. ft. of space under construction. However, this is expected to have a minimal impact on the vacancy rate, which will likely remain in the low single digits. Rental rates, already at record highs, will remain steady for the foreseeable future.
Figure 4: Share of 2023 Leasing by Occupier Type
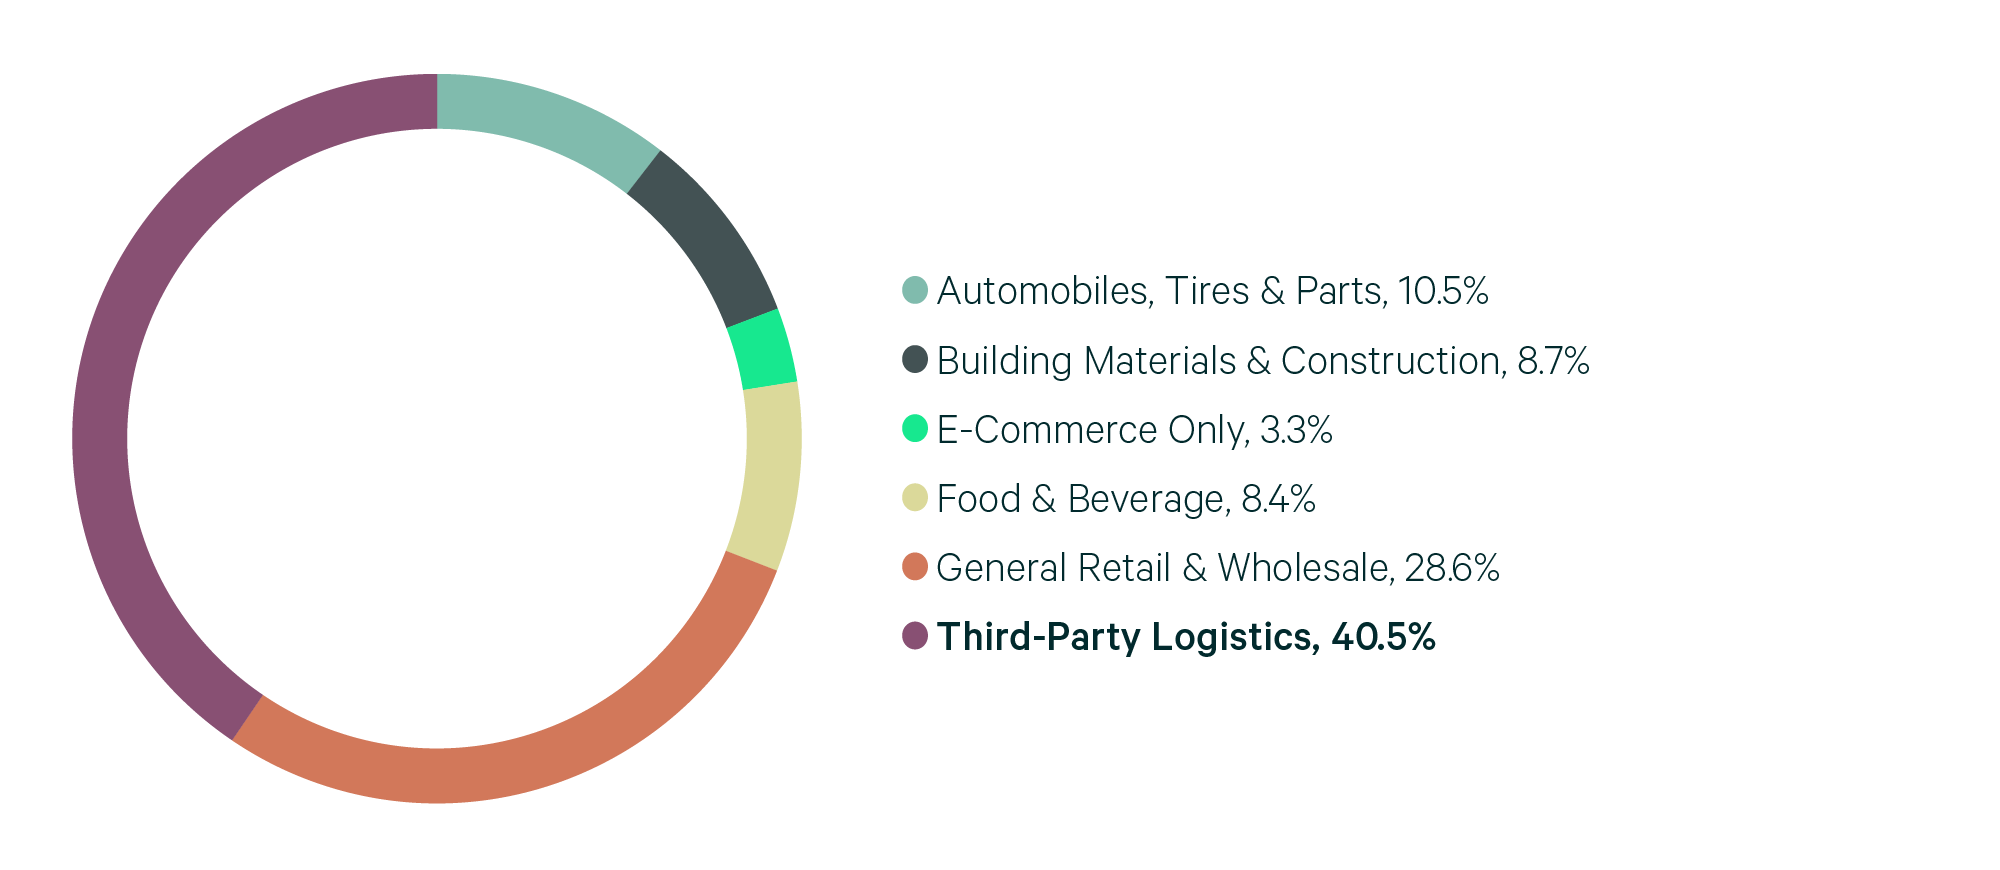
Source: CBRE Research.
Figure 5: Lease Transaction Volume by Size Range
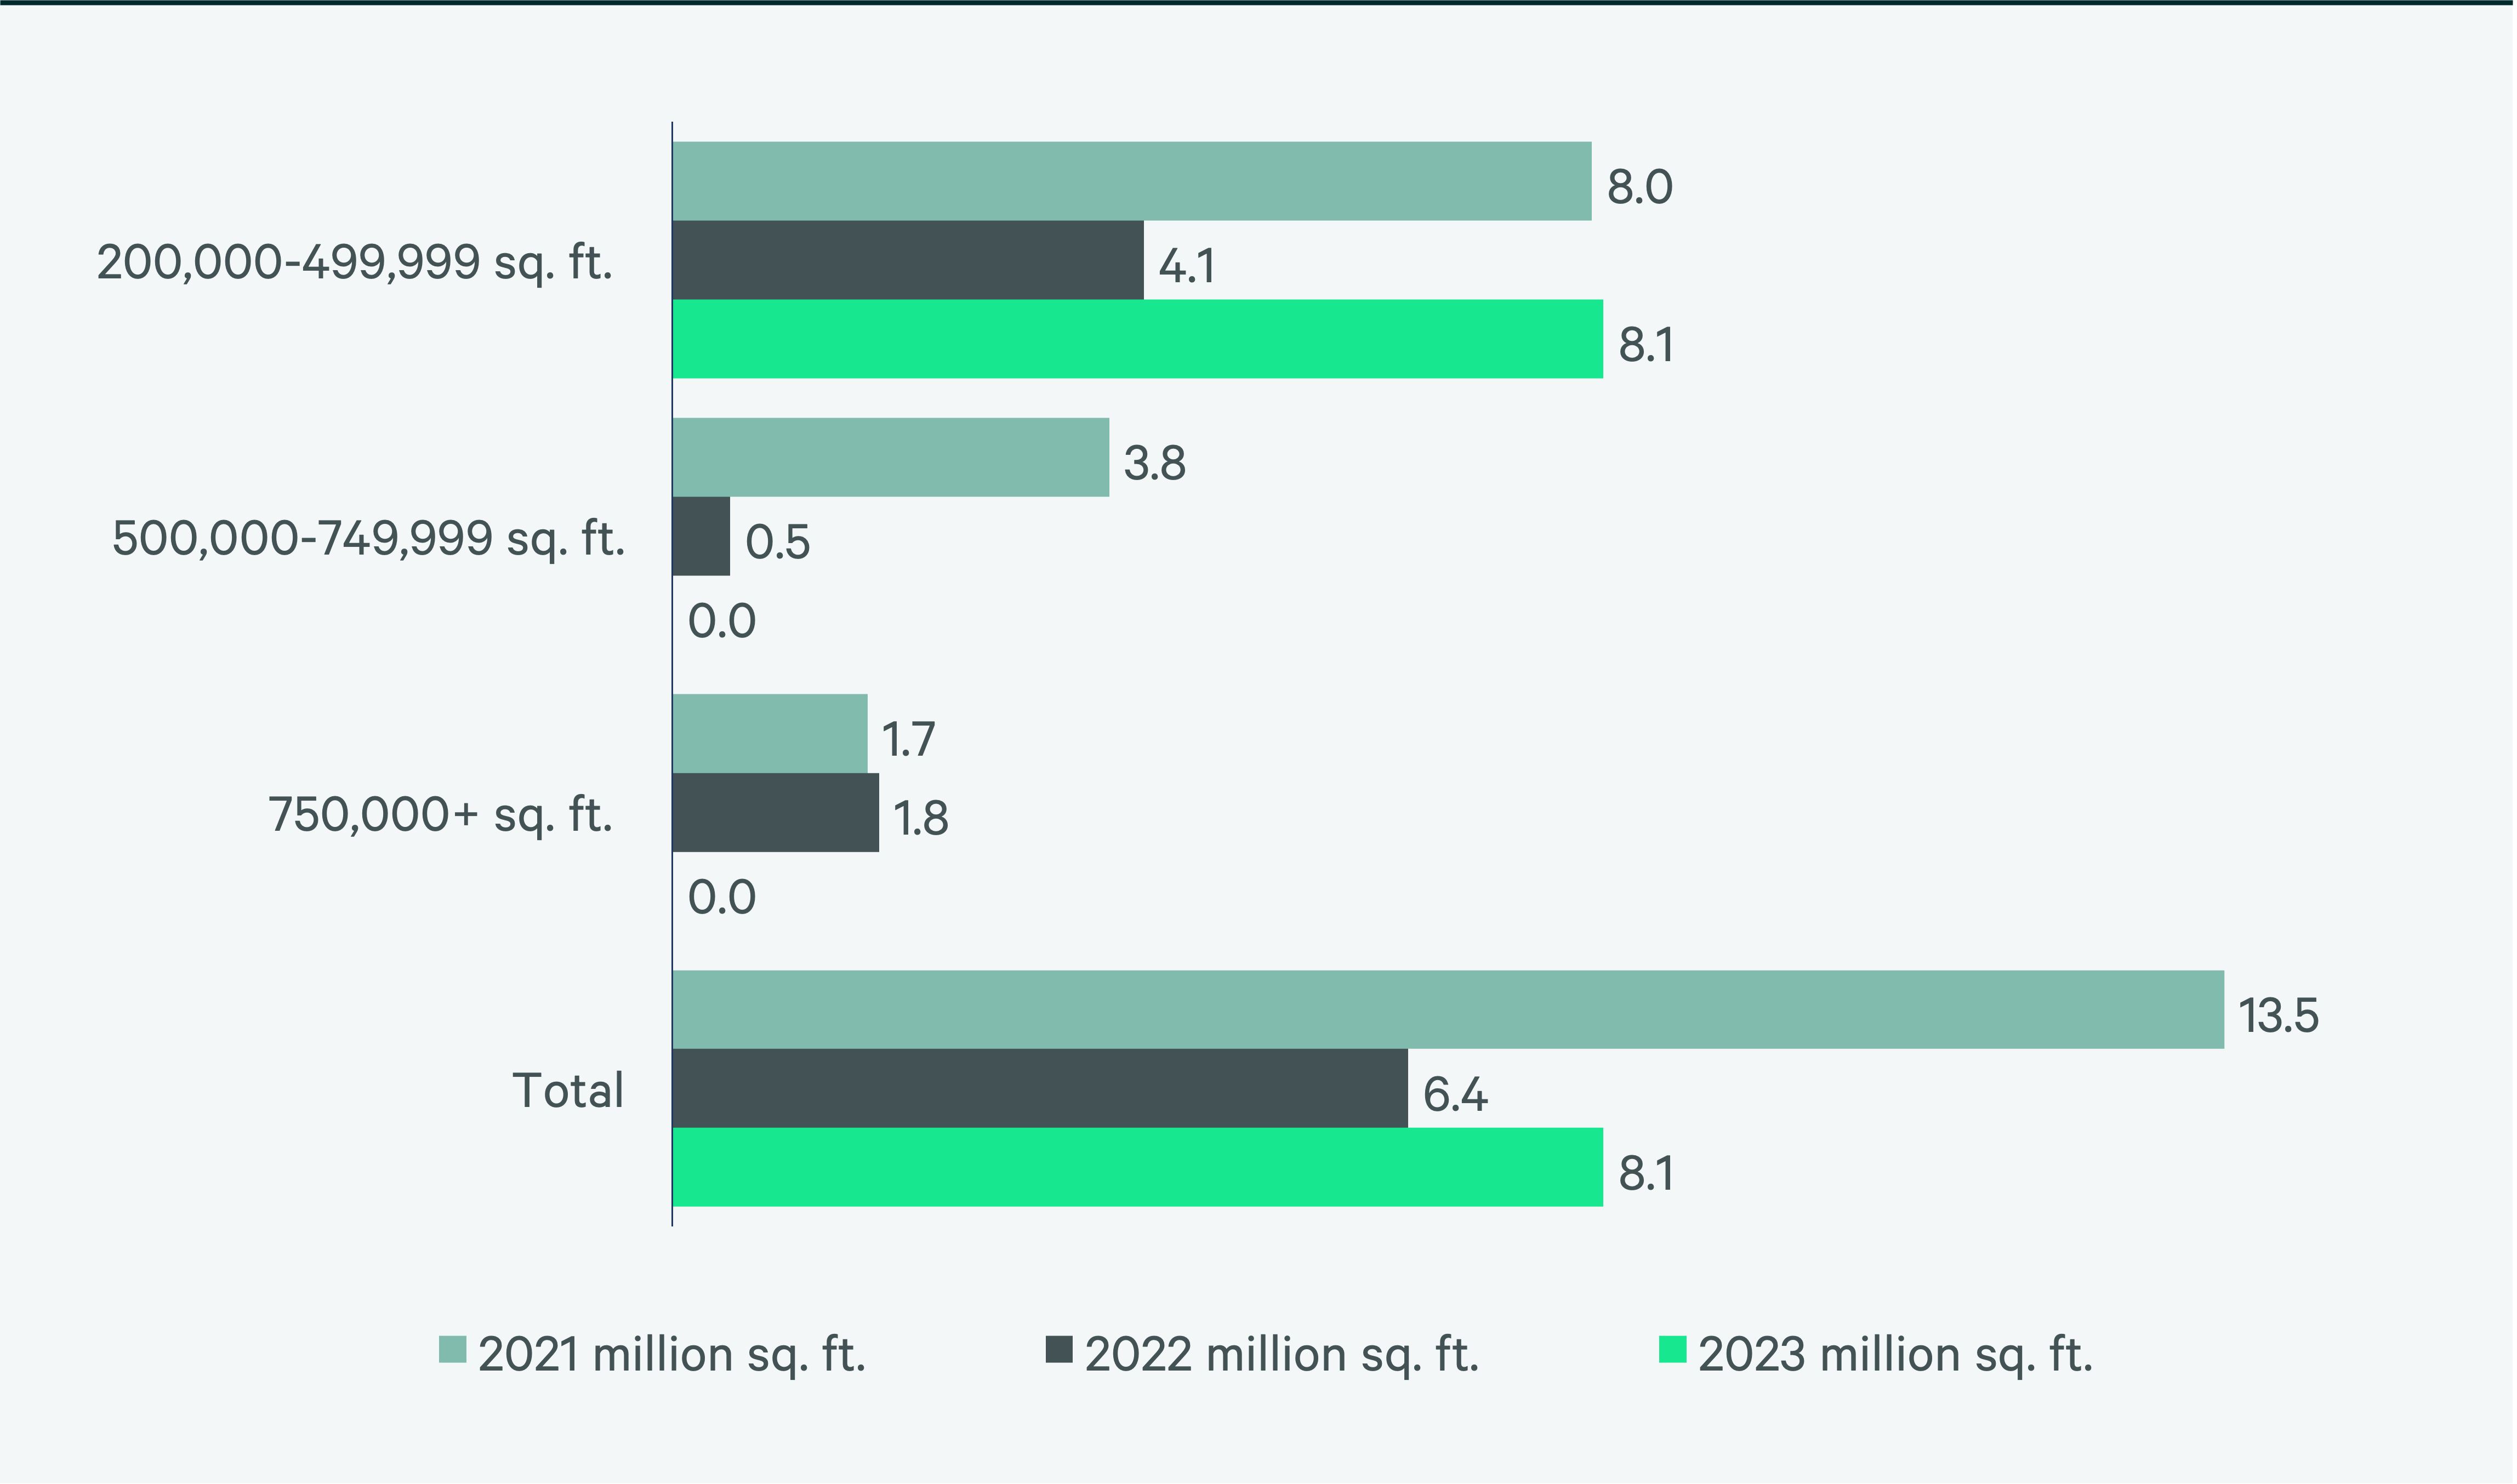
Source: CBRE Research.
Figure 6: 2023 Construction Completions vs. Overall Net Absorption by Size Range
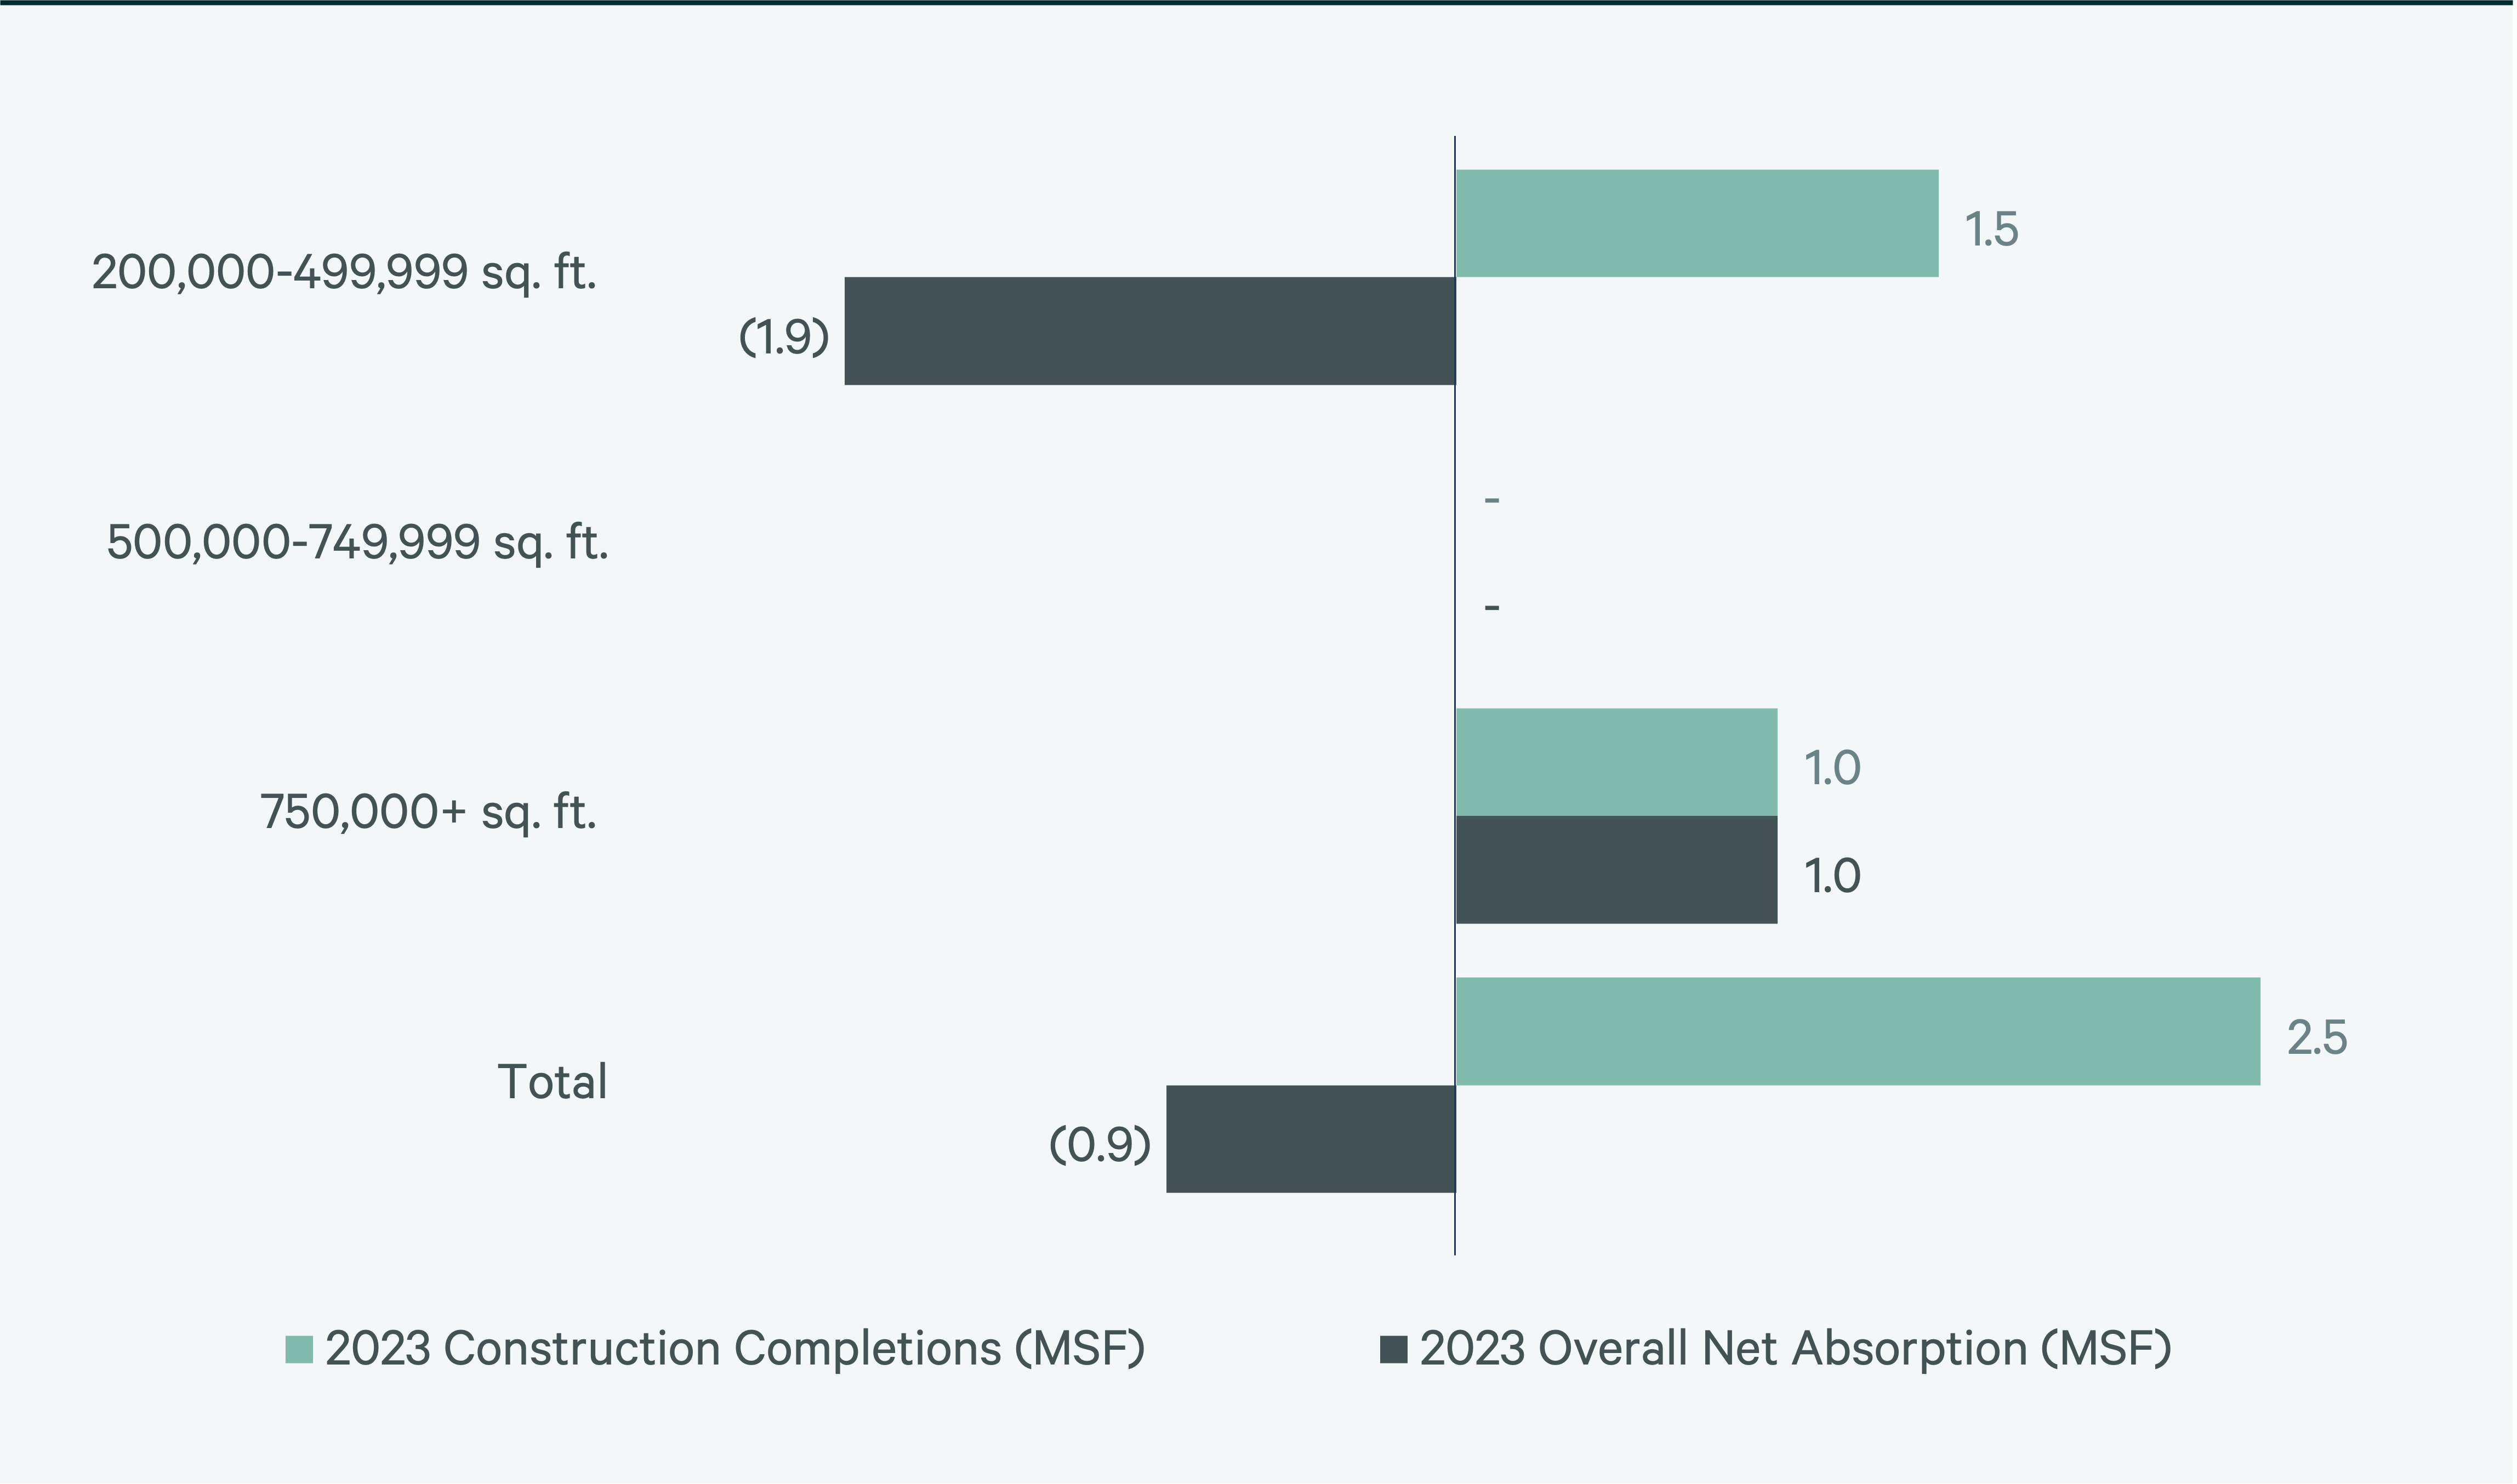
Figure 7: Direct Vacancy Rate by Size Range
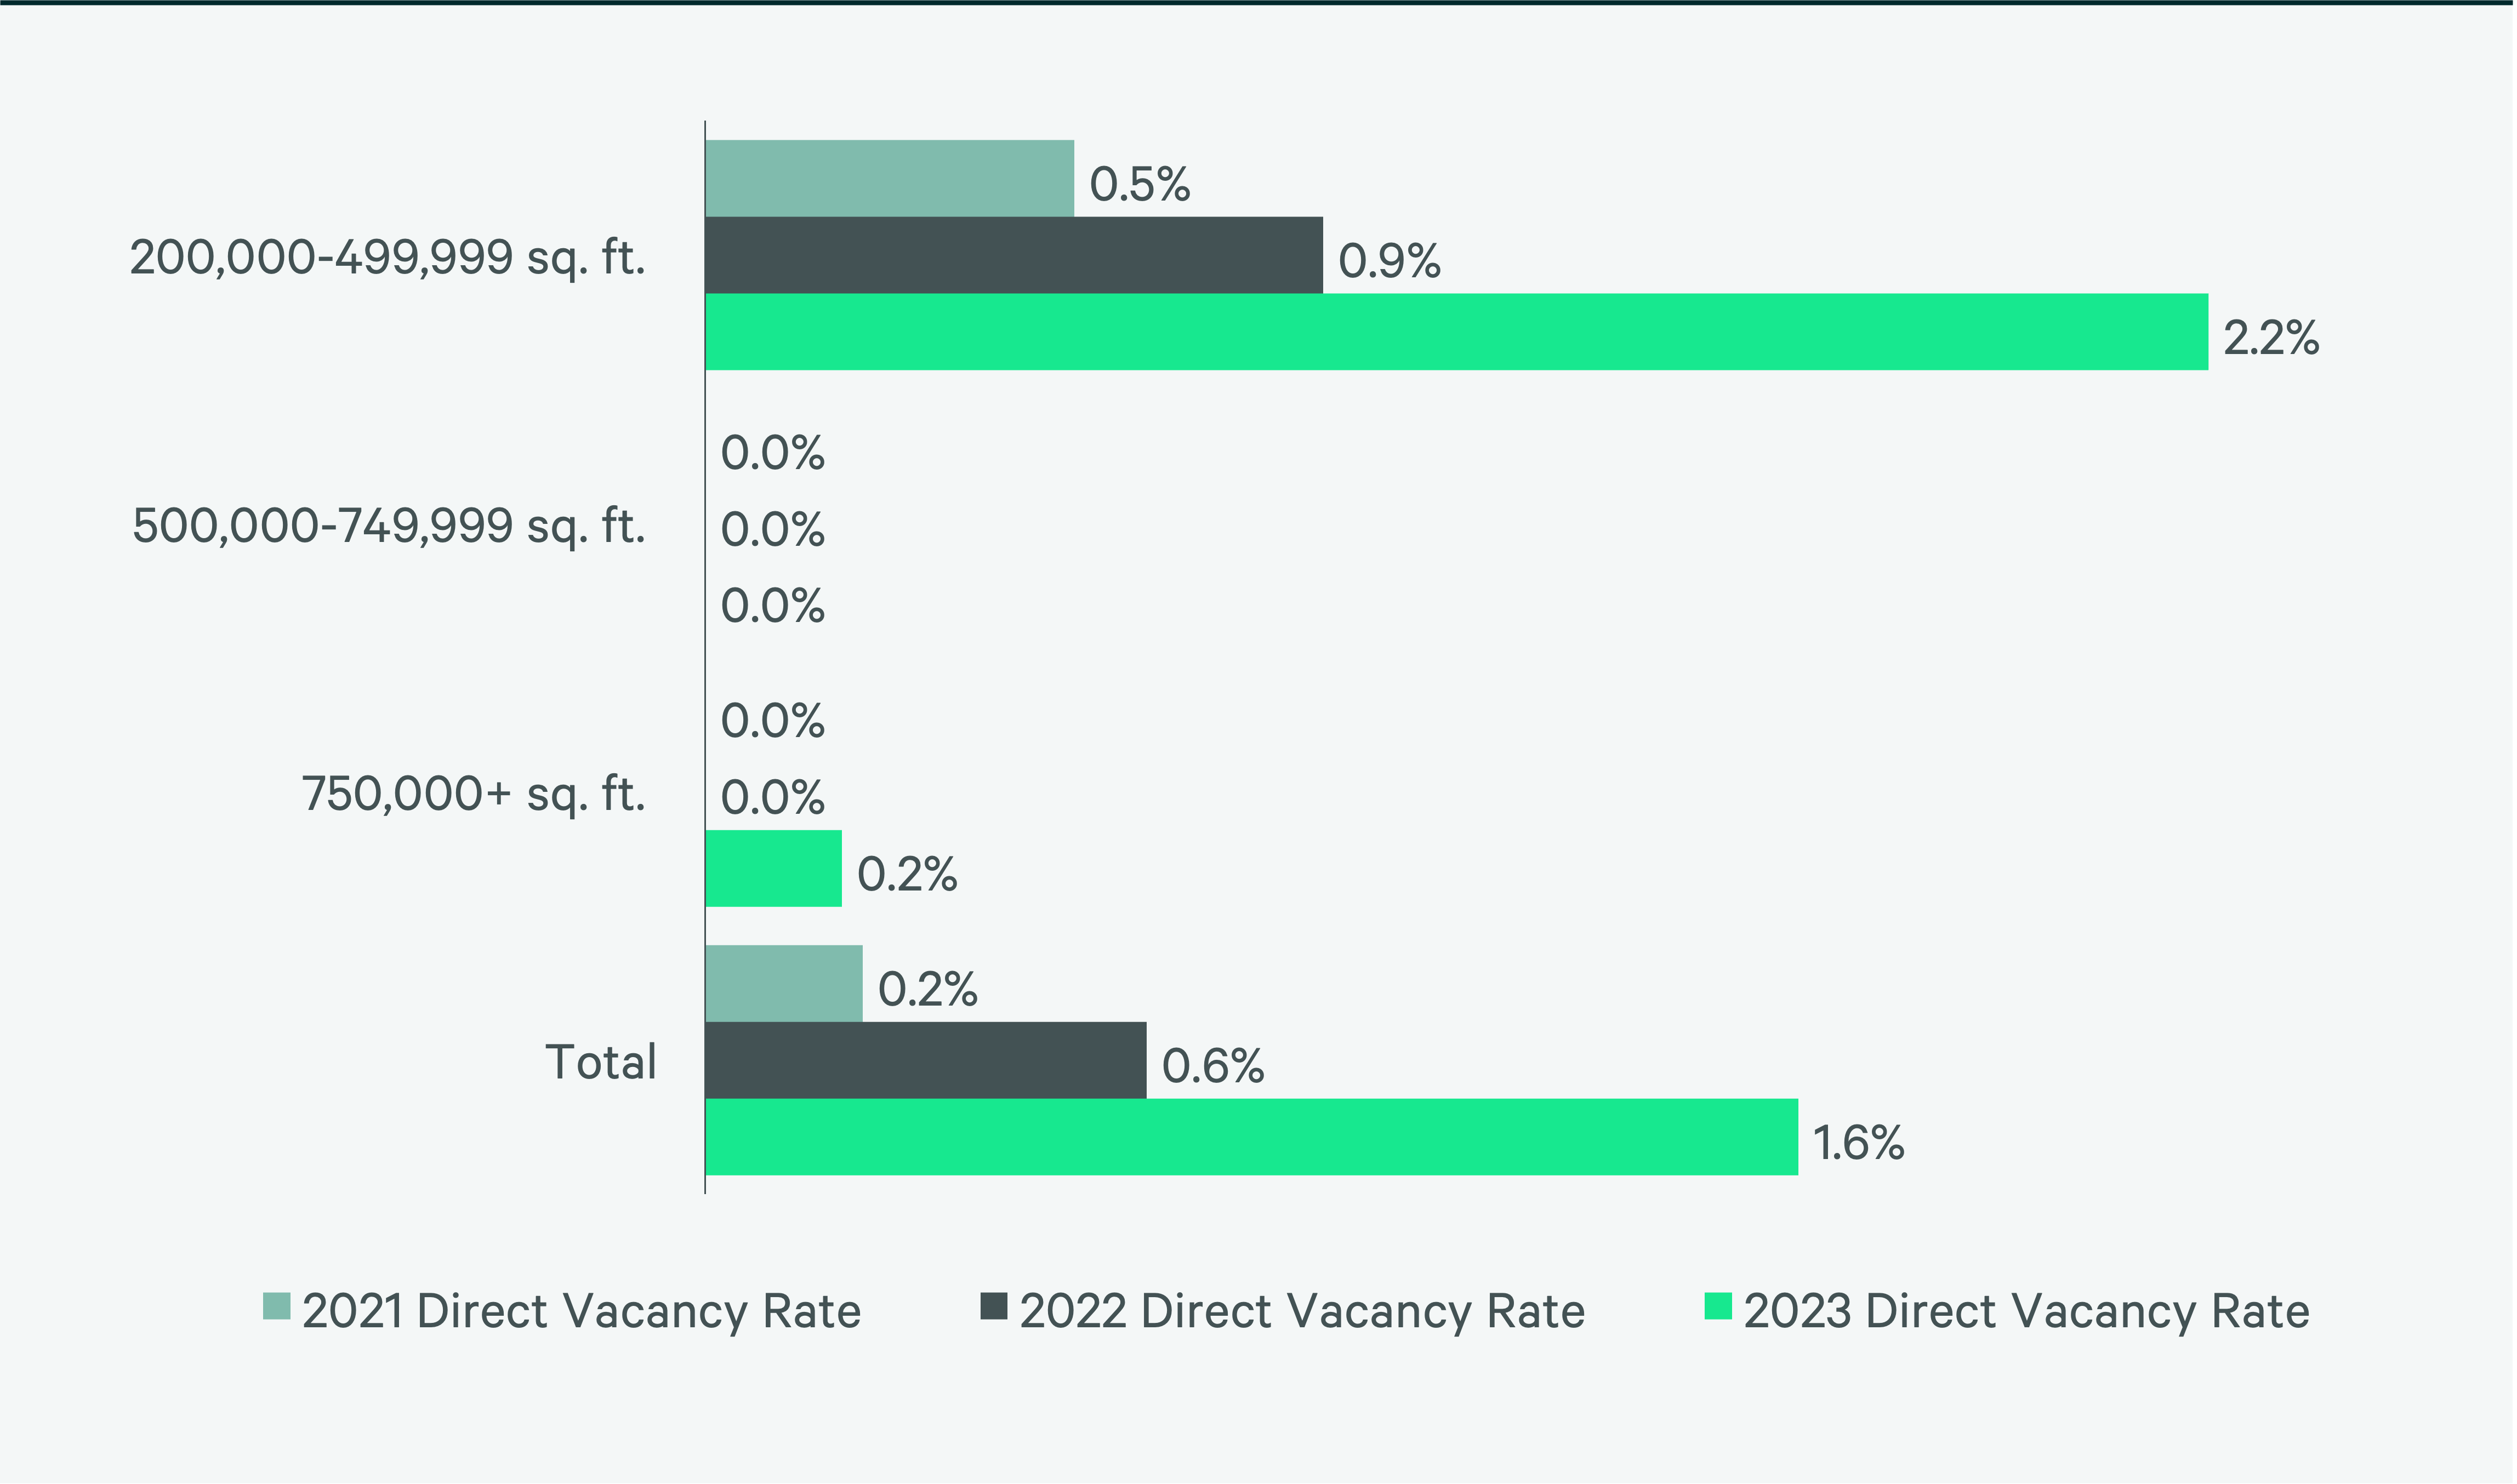
Figure 8: Under Construction & Percentage Preleased
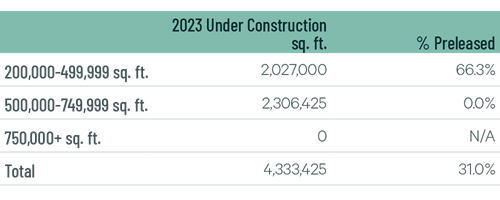
Figure 9: First Year Taking Rents (psf/yr)
Source: CBRE Research.
Explore Big-Box Insights by Market
Industrial & Logistics Research
James Breeze
Vice President, Global Industrial and Retail Research

John Morris
President, Americas Industrial & Logistics, Advisory Services