Future Cities
Cincinnati Market
2025 North America Industrial Big-Box Review & Outlook
April 16, 2025 5 Minute Read

Supply & Demand
Big-box leasing concluded 2023 with 7.5 million sq. ft., a 4.3% year-over-year increase but far below 2021’s record 16.8 million sq. ft. General retail & wholesale occupiers dominated leasing, accounting for 44.2% of transaction volume. Despite more leasing, vacancy rates tripled year-over-year, to 7.0%, due to reduced positive net absorption and a record 7.9 million sq. ft. in construction completions. However, despite higher vacancies, taking rents grew 28.5% annually to $5.63 psf/yr, largely driven by a nearly $2.00 psf/year increase in rents in the under-500,000 sq. ft. size range.
Challenges in the construction finance markets and increased vacancies virtually halted big-box ground-breakings in Cincinnati, with only 1.3 million sq. ft. under construction by year-end. This construction slowdown will allow the market time to absorb the available space, which should result in lower vacancies by this year’s end.
Figure 4: Share of 2023 Leasing by Occupier Type
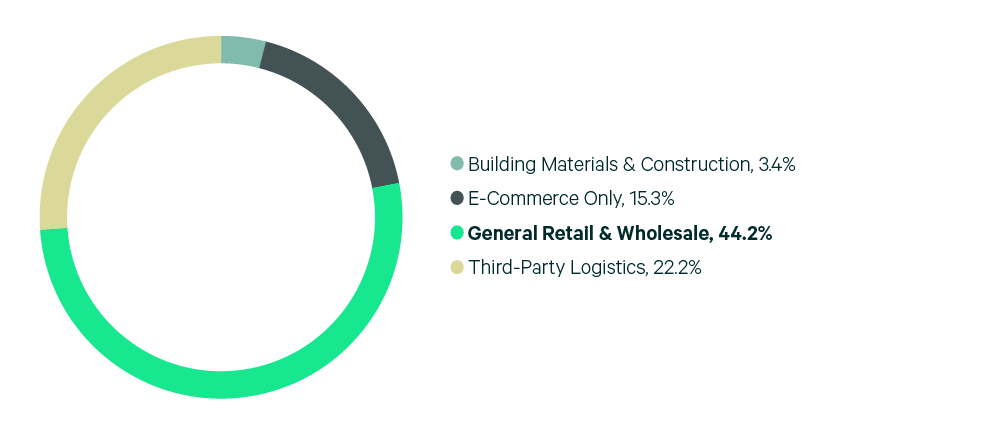
Source: CBRE Research.
Figure 5: Lease Transaction Volume by Size Range
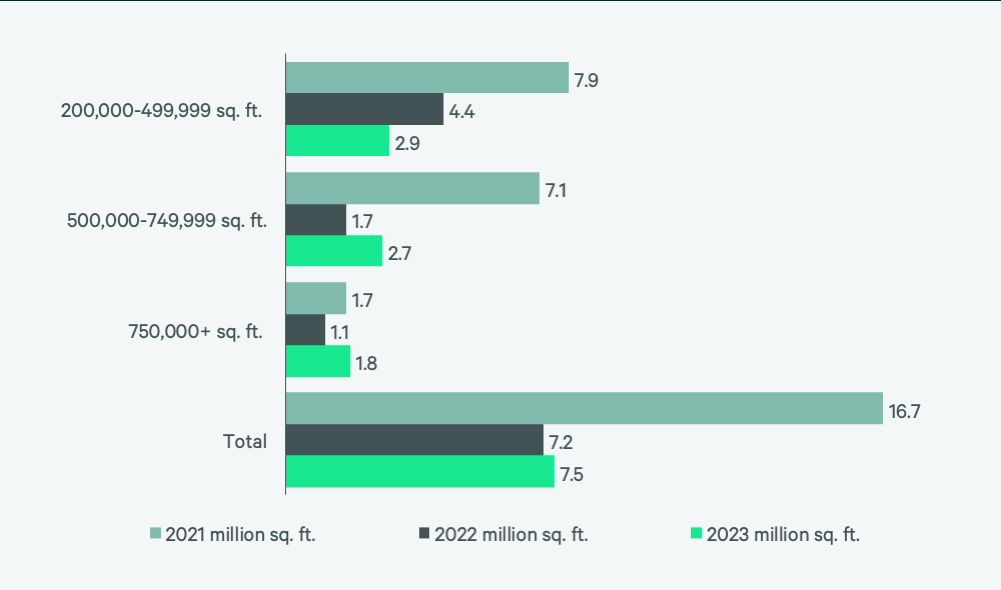
Source: CBRE Research.
Figure 6: 2023 Construction Completions vs. Overall Net Absorption by Size Range
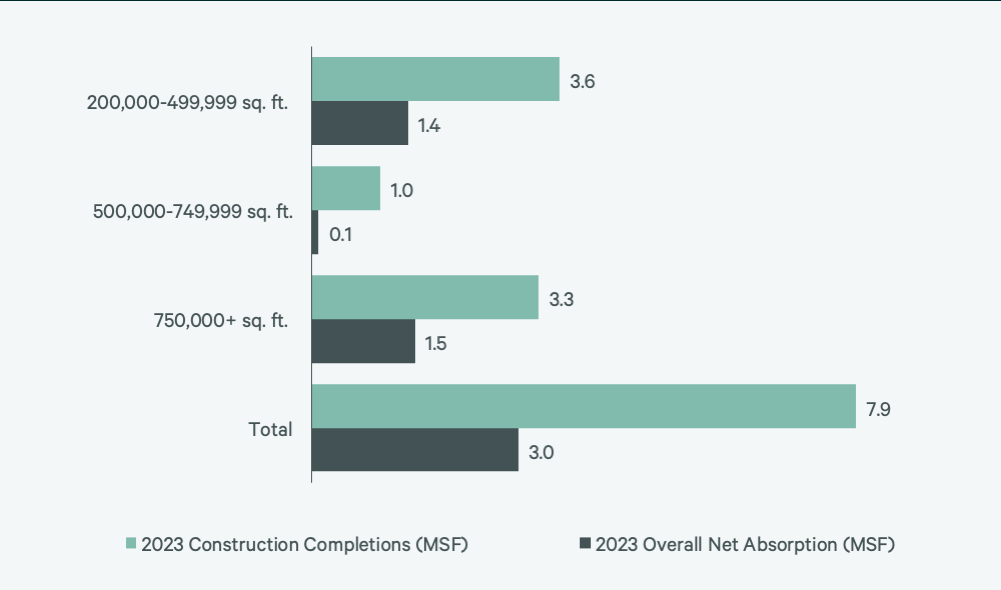
Figure 7: Direct Vacancy Rate by Size Range
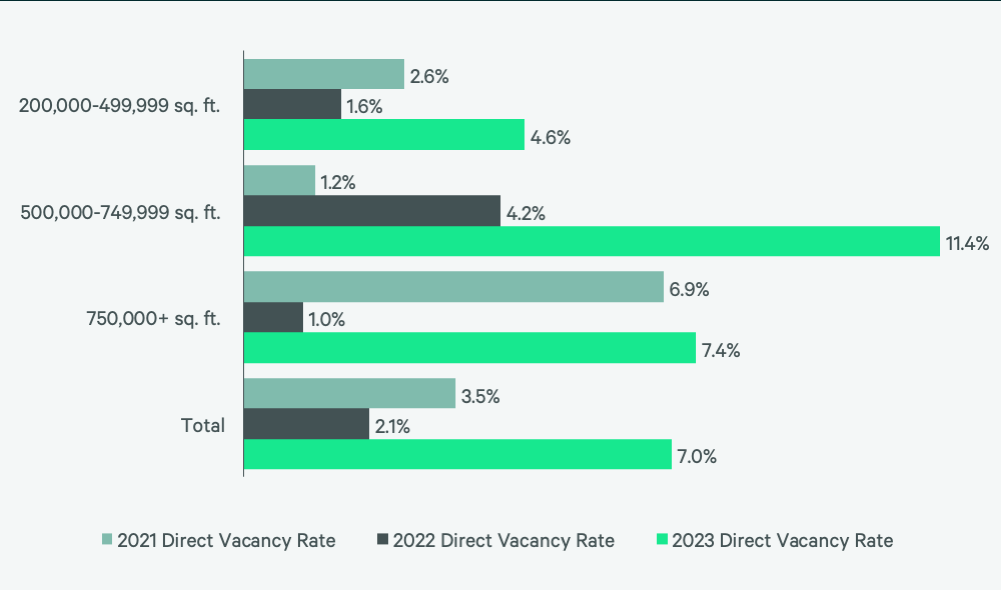
Figure 8: Under Construction & Percentage Preleased
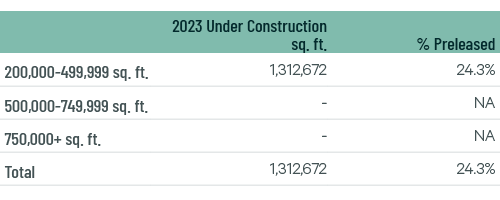
Figure 9: First Year Taking Rents (psf/yr)
Source: CBRE Research.