Future Cities
Central Florida Market
2025 North America Industrial Big-Box Review & Outlook
May 22, 2024 5 Minute Read

Demographics
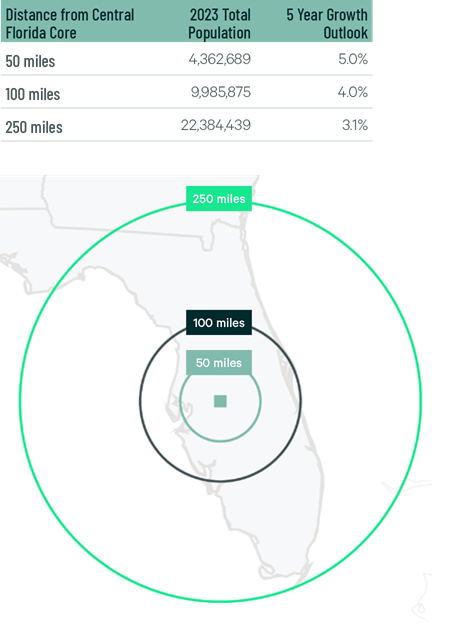
Over 4 million people live within 50 miles of the market’s core, with a 5% expected five-year growth rate—the second-highest of any region in the Southeast. Within 250 miles, occupiers can reach 22 million people or 8.6 million households.
Figure 1: Central Florida Population Analysis
The local warehouse labor force of 99,042 is expected to grow by 10.8% by 2034, according to CBRE Labor Analytics. The average wage for a non-supervisory warehouse worker in Central Florida is $17.52 per hour, 1.2% lower than the U.S. average and the lowest for any U.S. market in this report.
Figure 2: Central Florida Warehouse & Storage Labor Fundamentals

*Median wage (1 year experience); non-supervisory warehouse material handlers.
Location Incentives
Over the past five years, there have been over 250 economic incentives deals totaling more than $210 million for an average of $4,700 per new job in metro Tampa and Orlando combined, according to fDi Intelligence.
CBRE’s Location Incentives Group reports that top incentive programs offered in metro Tampa and Orlando include the Quick Response Training grant, offering funding for new full-time employee training. This grant typically goes to businesses in high-skill industries that produce exportable goods and services, with wages 125% above the state or local average.
Another program available in Florida is the Capital Investment Tax Credit (CITC) and High Impact Performance Incentive (HIPI). CITC is a corporate income tax credit for businesses that make a minimum investment of $25 million and create at least 100 new high-paying jobs. HIPI is a cash grant for businesses that make a minimum investment of $50 million and create at least 50 new high-paying jobs.
Figure 3: Central Florida Top Incentive Programs
Note: The extent, if any, of state and local incentive offerings depends on location and scope of the operation.
Logistics Driver
Central Florida provides many logistics advantages to reach the entire state of Florida and beyond. The region hosts two international airports (Tampa and Orlando) with growing air cargo capabilities. Work has been completed on the I-4 Ultimate Project, which will improve truck flow throughout the region. The region’s biggest logistics advantage is its rail capabilities. CSX Central Florida ILC is an innovative facility that can process 300,000 containers annually and can increase capacity.

The region hosts two international airports (Tampa and Orlando) with growing air cargo capabilities.
Supply & Demand
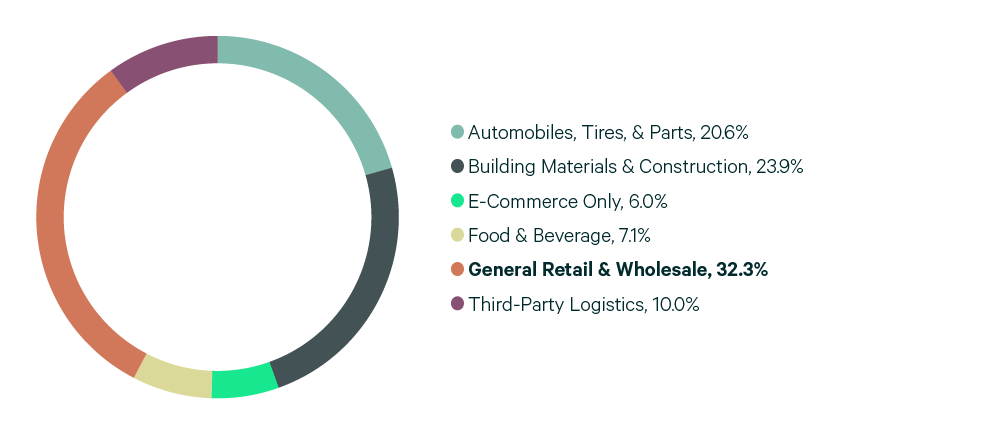
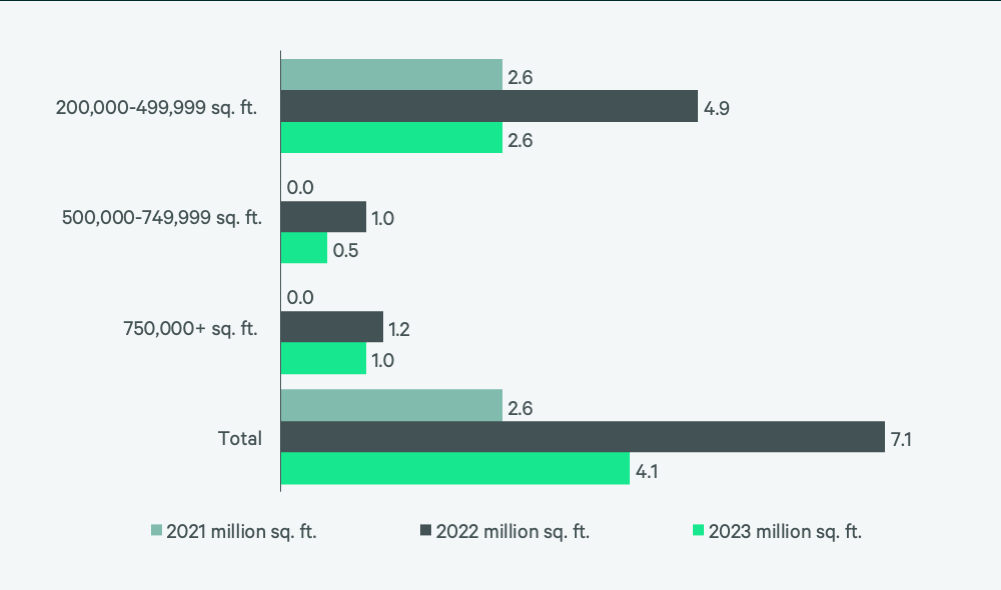
Central Florida contains 119 million sq. ft. of big-box inventory, with 60% in facilities under 500,000 sq. ft. Sixty-three percent of total lease volume was in this size range, at 4.1 million sq. ft., which is a decline from 2022. Lower leasing and a record 11.2 million sq. ft. of construction completions doubled the vacancy rate to 10.2%. The average rental rate in 2023 was $7.74 psf/yr, a 26.5% year-over-year increase. General retail & wholesale was the most active occupier with 32.3% of lease volume but the building & construction materials (23.9%), and automobile (20.6%) sectors were also active.
Over 7 million sq. ft. was under construction by year-end 2023, a year-over-year decline of 5 million sq. ft. Thirty-eight percent was preleased. Less construction may lead to a 50% lower construction completion rate than in the year prior. The region’s population growth and affordable labor should lead to increased lease transaction volume this year. The mix of less construction and more leasing should stabilize and potentially decrease big-box vacancies by year-end.
Figure 4: Share of 2023 Leasing by Occupier Type
Source: CBRE Research.
Figure 5: Lease Transaction Volume by Size Range
Source: CBRE Research.
Figure 6: 2023 Construction Completions vs. Overall Net Absorption by Size Range
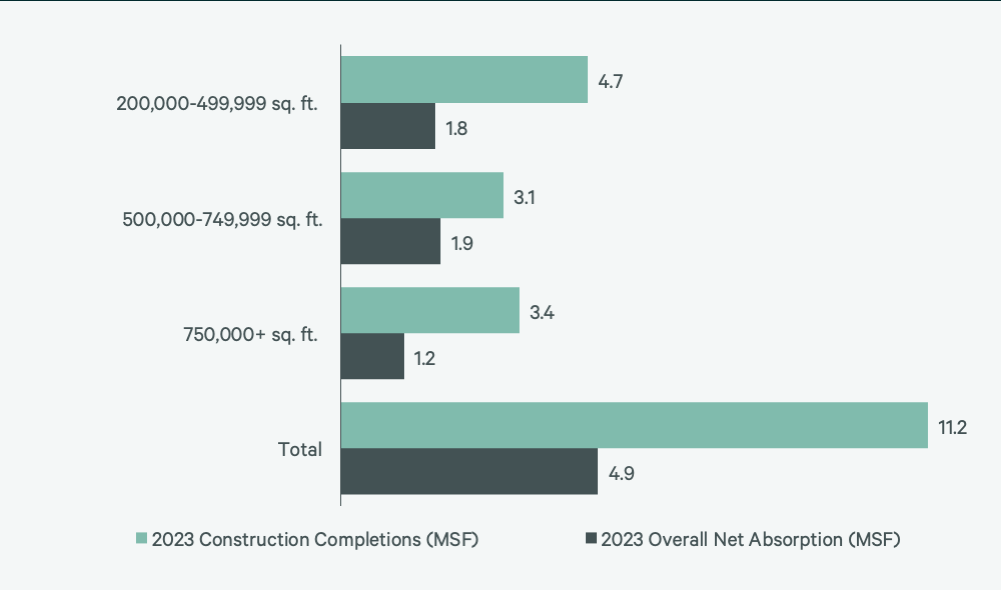
Figure 7: Direct Vacancy Rate by Size Range
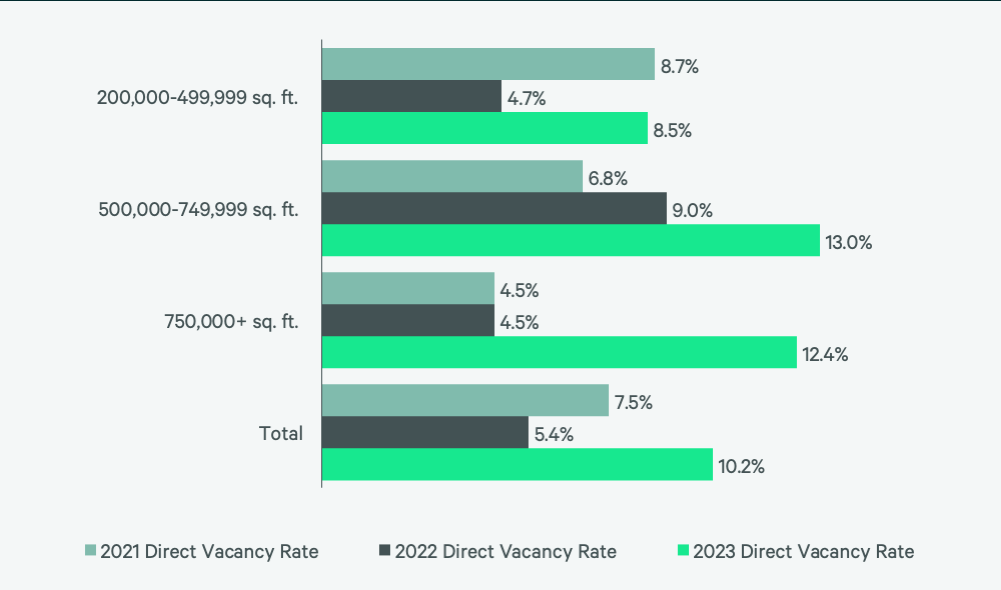
Figure 8: Under Construction & Percentage Preleased
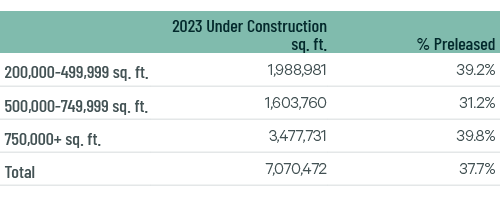
Figure 9: First Year Taking Rents (psf/yr)
Source: CBRE Research.
Explore Big-Box Insights by Market
Industrial & Logistics Research
James Breeze
Vice President, Global Industrial and Retail Research

John Morris
President, Americas Industrial & Logistics, Advisory Services


