Future Cities
2022 North America Industrial Big Box Review & Outlook: St. Louis
March 11, 2022 5 Minute Read

St. Louis’ central location provides quick access to a large portion of the U.S., making the region a desirable distribution hub. Facing a lack of land sites, developers are pursuing fringe sites to meet the continued tenant demand, particularly from e-commerce companies and automobile and aerospace industry suppliers. As the market tightens due to a lack of new supply, rents are expected to increase.
Demographics
Nearly 3 million people live within 50 miles of St Louis, with a 1.1% expected growth rate over the next five years. Within 250 miles, occupiers can reach nearly 23 million people and 9 million households.
Figure 1: St. Louis Population Analysis
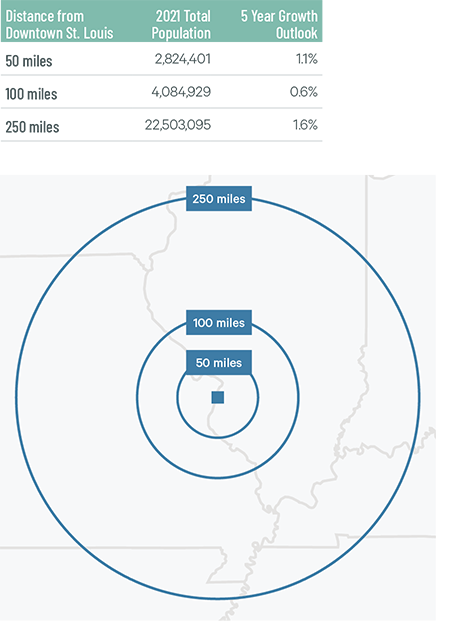
Source: CBRE Location Intelligence.
According to CBRE Labor Analytics, the local warehouse labor force of 38,593 is expected to grow 7.9% by 2030. The average wage for a non-supervisory warehouse worker is $15.38 per hour, 3.2% higher than the national average.
Figure 2: St. Louis Warehouse & Storage Labor Fundamentals
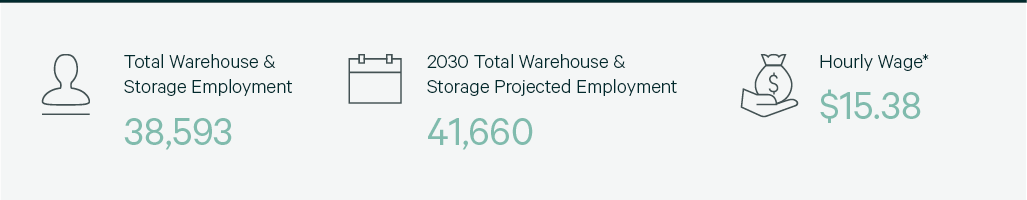
Source: CBRE Labor Analytics.
*Median wage (1 year experience); non-supervisory warehouse material handlers.
Location Incentives
Over the past five years, there have been 116 economic incentives deals totaling more than $190 million at an average of $21,079 per new job in the St. Louis metropolitan area, according to Wavteq.
According to CBRE’s Location Incentives Group, among the top incentive programs offered in metro St. Louis is the Missouri Works Program, which provides payroll rebates and discretionary income tax credits for new jobs. To qualify, at least two full-time jobs must be created with wages exceeding 80% of the average county wage.
Among the top incentive programs offered in neighboring Illinois is the Economic Development for a Growing Economy Program (EDGE), which provides nonrefundable, discretionary tax credits for corporate income taxes for up to 10 years. These credits equal up to 50% of new income tax withholdings generated by a project’s new job creation. To qualify, companies with more than 100 employees worldwide must invest a minimum of $2.5 million and create new jobs equal to 10% of the company’s total employment. Companies with less than 100 employees worldwide must create new jobs equal to 5% of the company’s total employment.
For a summary of the incentive programs available for projects that are in bordering Illinois, please refer to the incentives market commentary for Chicago. The extent of state and local incentives for industrial projects in metro St. Louis depends on location and scope of the operation.
Figure 3: St. Louis Top Incentive Programs
Source: CBRE Location Incentives Group.
Note: The extent, if any, of state and local incentive offerings depends on location and scope of the operation.
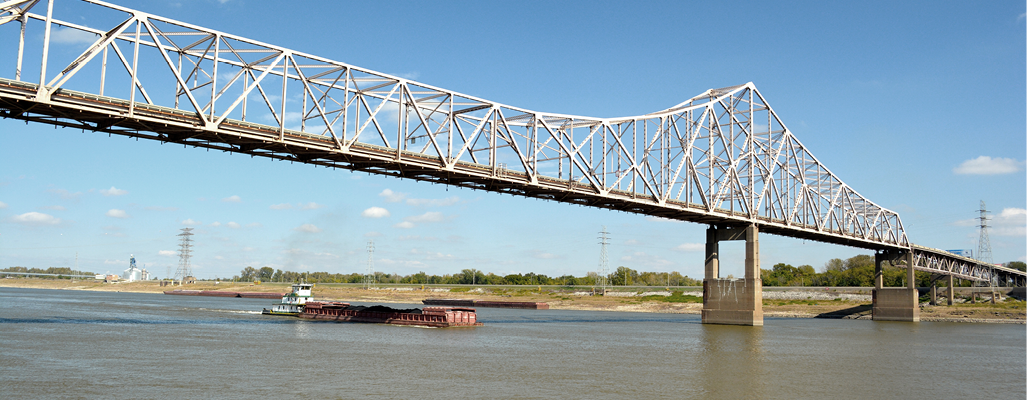
Logistics Driver
The Port of Metropolitan St. Louis encompasses 70 miles and includes both sides of the Mississippi River. It is the northernmost ice- and lock-free port on the Mississippi and is served by six Class 1 railroads, seven interstate highways and two international airports. Nearly one-third of the U.S. population is located within 500 miles of the port. St. Louis Lambert International Airport is a growing cargo hub, with total cargo volume increasing by more than 5% over the past two years.
Nearly one-third of the U.S. population is located within 500 miles of the port of St. Louis.
Capital Markets
St. Louis is a major distribution hub for many industries. The market's core cap rate compressed by more than 50 basis points year-over-year in 2021 and its spread between those of similar strategic U.S markets is disproportionately wide. Further cap rate compression is expected in 2022.
Figure 4: Cap Rate Comparison

Source: CBRE Research.
Supply & Demand
The St. Louis big-box market posted a solid year of activity in 2021, with leasing activity totaling 9 million sq. ft., 67% higher than 2020. Robust leasing quickly depleted available supply, dropping the vacancy rate to 3.0%, with no vacant blocks of 750,000 sq. ft. or more. 3PLs looking to take advantage of the market’s central location and inland ports accounted for 44% of the total lease activity in 2021.
The market absorbed 5.7 million sq. ft. in 2021, up by 62% from 2020. Despite strong activity and low vacancies, rent growth was minimal at 3.2%, with the average taking rent at $3.48 per sq. ft.—the second lowest in North America. Despite rent growth below the North American average, the under-construction pipeline increased to 7.2 million sq. ft., including 2.9 million sq. ft. in facilities 750,000 sq. ft. and larger. The plethora of speculative construction slated to hit the market in 2022 will give occupiers looking to expand into St. Louis plenty of options. Given the high interest from occupiers, new development should lead to increased leasing activity in the coming year.
Figure 5: Share of 2021 Leasing Activity by Occupier Type

Note: Includes new leases and renewals 200,000 sq. ft. and above.
Source: CBRE Research.
Figure 6: Leasing Activity
Note: Includes new leases and renewals 200,000 sq. ft. and above.
Source: CBRE Research.
Figure 7: 2021 Construction Completions vs. Overall Net Absorption
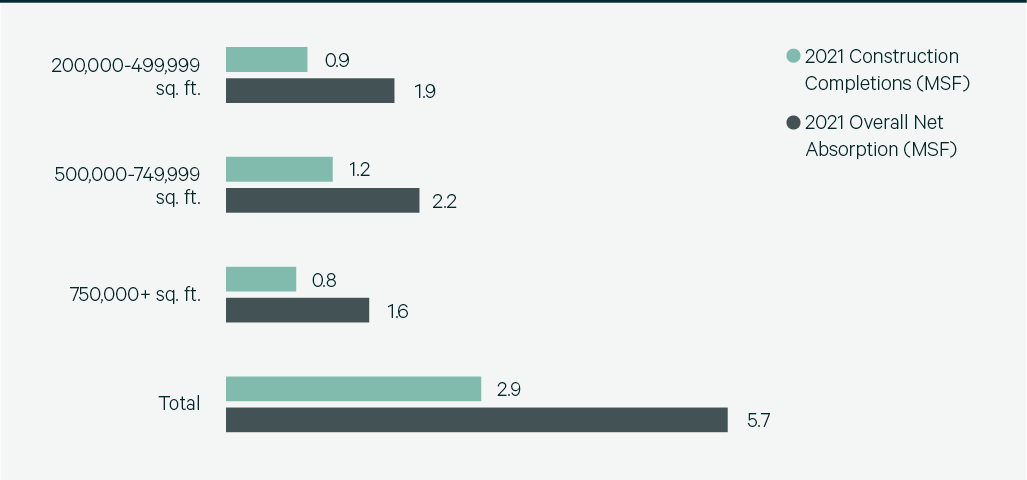
Source: CBRE Research.
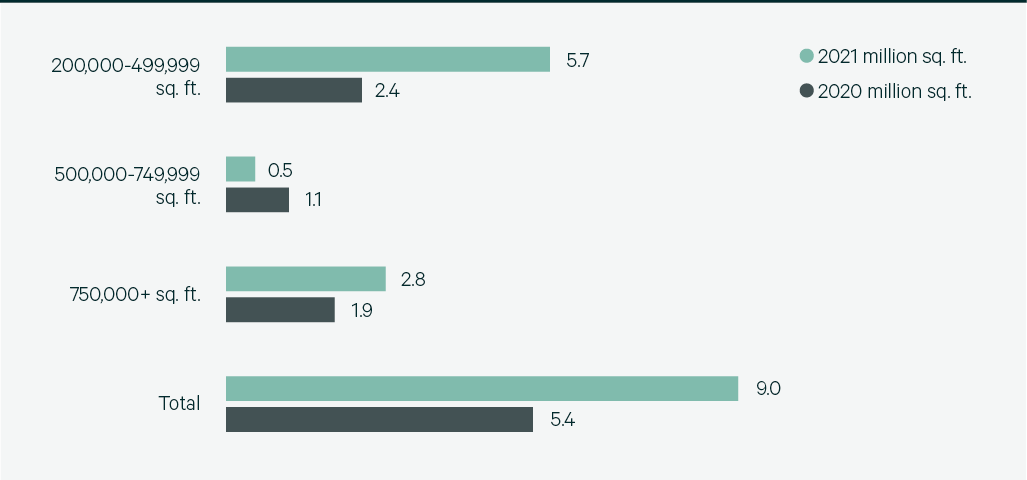
Figure 8: Direct Vacancy Rate by Size Range
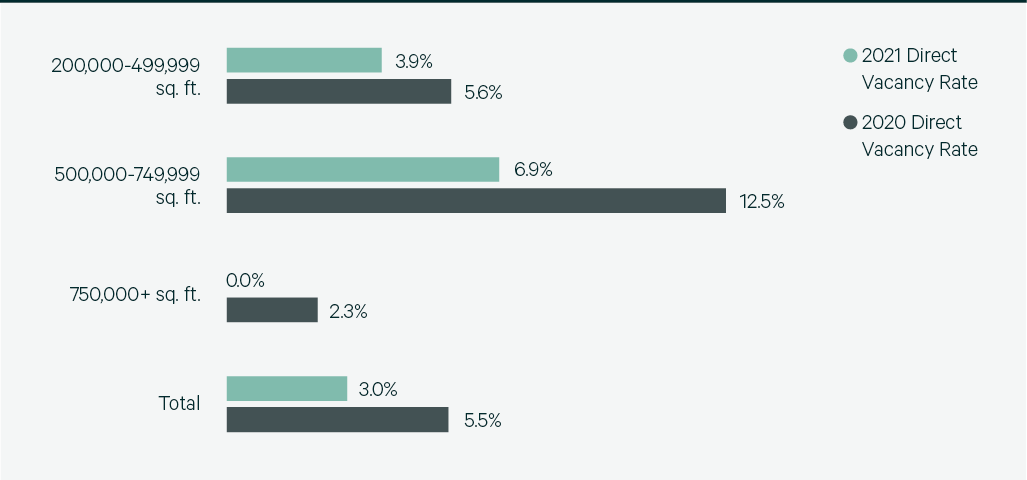
Source: CBRE Research.
Figure 9: Under Construction & Percentage Preleased
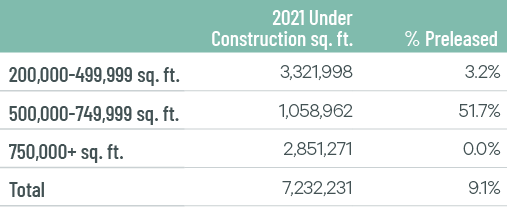
Source: CBRE Research.
Figure 10: Historical First Year Taking Rents (psf/yr)
Note: Includes first year taking rents for leases 200,000 sq. ft. and above.
Source: CBRE Research.
Explore Big Box Insights by Market

Chicago’s central location and plethora of logistics capabilities make it one of the most in-demand big-box markets in the country.

Memphis has the nation’s busiest cargo airport, five Class I railroads and a location within a two-day drive to 70% of the U.S.

Kansas City is one of the fastest-growing U.S. industrial markets, with developers delivering over 70 million sq. ft. of Class A space over the past decade.
Contacts
James Breeze
Vice President, Global Industrial and Retail Research

John Morris
President, Americas Industrial & Logistics, Advisory Services