Future Cities
2022 North America Industrial Big Box Review & Outlook: Chicago
March 11, 2022 5 Minute Read

Chicago’s central location and plethora of logistics capabilities make it one of the most in-demand big-box markets in the country. A flurry of activity because of the large increase in e-commerce sales significantly lowered available inventory, giving occupiers minimal options in the latter part of the year. Speculative development increased in 2021, but so did preleasing, leaving little available first-generation space on the market. Low availability will increase the rate of rent growth in 2022.
Demographics
More than 9 million people live within 50 miles of the market core. Chicago is one of the few major markets in the country with minimal population growth; the 50-mile region is expected to decrease by 0.1% over the next five years. An expanded radius of 250 miles reaches 37.5 million people with a projected growth rate of 1.0% over the next five years.
Figure 1: Chicago Population Analysis
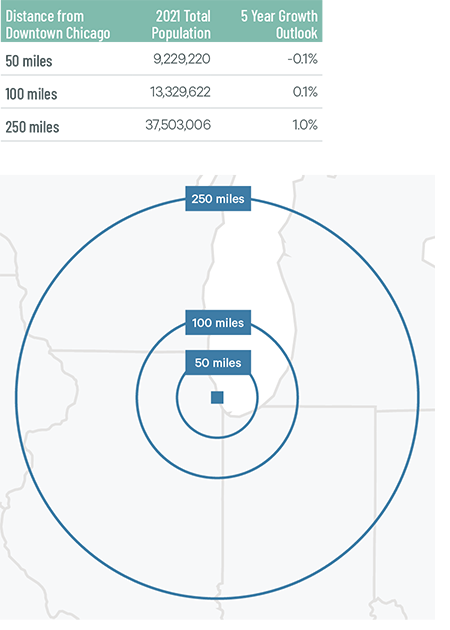
Source: CBRE Location Intelligence.
According to CBRE Labor Analytics, Chicago’s warehouse labor force of 203,000 is the third largest in the nation. The average wage for a non-supervisory warehouse employee is $16.61 per hour, 11% higher than the national average.
Figure 2: Chicago Warehouse & Storage Labor Fundamentals
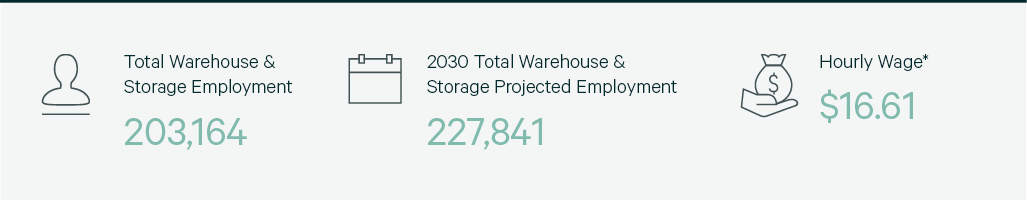
Source: CBRE Labor Analytics.
*Median wage (1 year experience); non-supervisory warehouse material handlers.
Location Incentives
Over the past five years, there have been 194 economic incentives deals totaling over $462 million at an average of $23,228 per new job in the Chicago metropolitan area, according to Wavteq. A portion of the Chicago industrial market is located in Indiana. Indiana location incentives can be found in the Indianapolis section of this report.
According to CBRE’s Location Incentives Group, among the top incentive programs offered in metro Chicago is the Economic Development for a Growing Economy Program (EDGE), which provides non-refundable discretionary tax credits for corporate income taxes for up to 10 years. These credits equal up to 50% of new income tax withholdings generated by a project’s new job creation. To qualify, companies with more than 100 employees worldwide must invest a minimum of $2.5 million and create new jobs equal to 10% of the company’s total employment. Companies with less than 100 employees worldwide must create new jobs equal to 5% of the company’s total employment.
Figure 3: Chicago Top Incentive Programs
Source: CBRE Location Incentives Group.
Note: The extent, if any, of state and local incentive offerings depends on location and scope of the operation.
Logistics Driver
Chicago is the rail hub of the U.S. The region is home to seven Class 1 rail carriers. More than 1,300 freight, passenger and commuter trains pass through the Chicago region every day, according to the Journal of Commerce. Illinois has the third-highest total of interstate routes and mileage. The two longest, I-90 and I-80, provide east/west access. Two key routes to the Gulf States, I-55 and I-65, end in the Chicago area. Along with access to I-57, I-70 and I-94, an Illinois driver can reach almost every population center in the nation by using one interchange.
Chicago O’Hare International Airport is one of the largest air cargo gateways in the world. O’Hare processes just under 2 million metric tons of cargo per year worth more than $200 billion. Chicago Rockford International is one of the top five fastest-growing cargo airports in the world, which grew its cargo volume by 15% in 2020 (most recent data available), according to the Federal Aviation Administration.
More than 1,300 freight, passenger and commuter trains pass through the Chicago region every day.

Capital Markets
Chicago is one of the largest industrial hubs in the U.S. and consistently leads the nation in investment sales volume. Big-box rents have increased by more than 25% in the past two years, as the big-box vacancy rate fell by 100 basis points. These positive market fundamentals have helped propel sales prices and create record-low cap rates, down by 25 basis points last year. Increased investment volume and continued compression of Class A big-box cap rates are expected in 2021.
Figure 4: Cap Rate Comparison

Source: CBRE National Partners.
Supply & Demand
With 573 million sq. ft. of total inventory, Chicago is the largest big-box market in North America and leased the most space in 2021 at 59.4 million sq. ft., 10 million sq. ft. more than the Inland Empire. Chicago did well in all size ranges, particularly in the mega big-box (750,000 sq. ft. and above) sector. Chicago led the U.S. in most transactions in the 100 largest deals of 2021 with 12; 3PLs were the most active occupier with a market share of 32.6%.
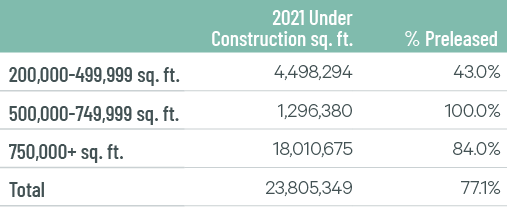
Construction completions increased to 21.1 million sq. ft. in 2021 but had no effect on the direct vacancy rate, which finished the year at 3.0%—down by 1 percentage point from 2020. There are no signs of overbuilding in Chicago despite 23.8 million sq. ft. under construction, as 77.1% is preleased. Chicago should remain one of the most in-demand big-box markets in 2022. Vacancies will remain low, which should lead to rent growth of more than 10% this year.
Figure 5: Share of 2021 Leasing Activity by Occupier Type
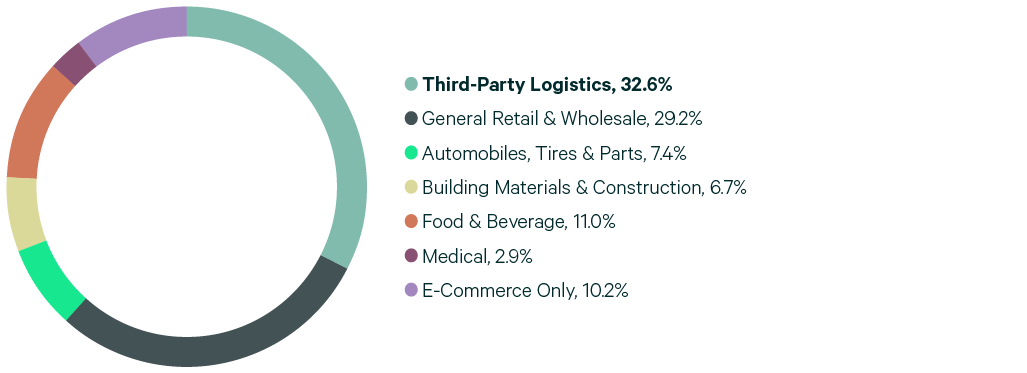
Note: Includes new leases and renewals 200,000 sq. ft. and above.
Source: CBRE Research.
Figure 6: Leasing Activity
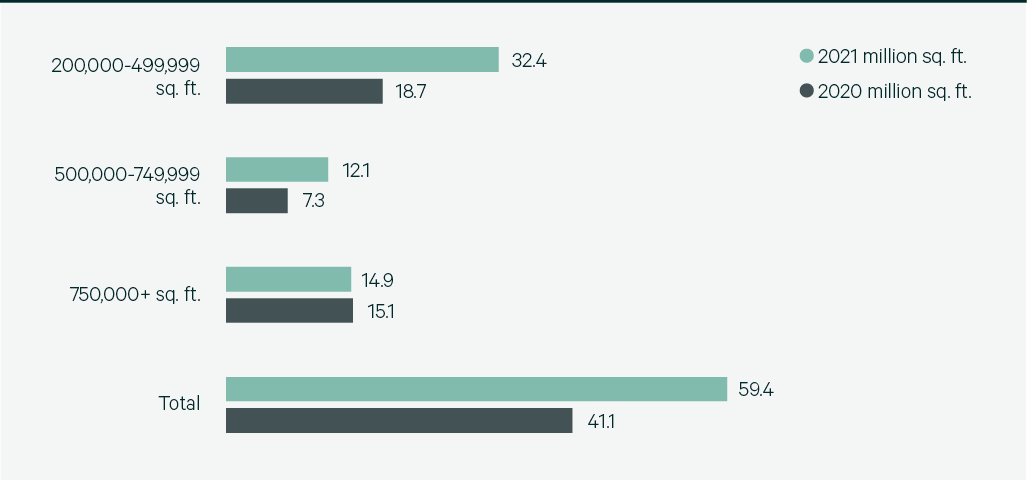
Note: Includes new leases and renewals 200,000 sq. ft. and above.
Source: CBRE Research.
Figure 7: 2021 Construction Completions vs. Overall Net Absorption

Source: CBRE Research.
Figure 8: Direct Vacancy Rate by Size Range

Source: CBRE Research.
Figure 9: Under Construction & Percentage Preleased
Source: CBRE Research.
Figure 10: Historical First Year Taking Rents (psf/yr)
Note: Includes first year taking rents for leases 200,000 sq. ft. and above.
Source: CBRE Research.
Explore Big Box Insights by Market

With excellent infrastructure, competitive economic incentives and a favorable business tax environment, Indianapolis checks all the site selection boxes.

St. Louis’s central location provides quick access to a large portion of the U.S., making the region a desirable distribution hub.

The Columbus industrial market's rapid growth is expected to continue in 2022, based on record levels of absorption, rent growth and land acquisitions.
Contacts
James Breeze
Vice President, Global Industrial and Retail Research

John Morris
President, Americas Industrial & Logistics, Advisory Services