Future Cities
2022 North America Industrial Big Box Review & Outlook: Kansas City
March 11, 2022 5 Minute Read

Kansas City is one of the fastest-growing industrial markets in the country, with developers delivering more than 70 million sq. ft. of Class A space over the past decade. Distributors are drawn to the market by its strategic interstate infrastructure, multiple intermodal facilities and aggressive state and local incentive programs.
Demographics
Kansas City’s biggest draw is its ability to easily reach a large portion of the country. More than 2.4 million people live within 50 miles of the market core and close to 15 million people or 6 million households are within 250 miles.
Figure 1: Kansas City Population Analysis

Source: CBRE Location Intelligence.
According to CBRE Labor Analytics, the local warehouse labor force of just over 33,000 is expected to grow by 5.7% by 2030. The average wage for a non-supervisory warehouse employee is $15.25 per hour, 2.3% higher than the national average.
Figure 2: Kansas City Warehouse & Storage Labor Fundamentals
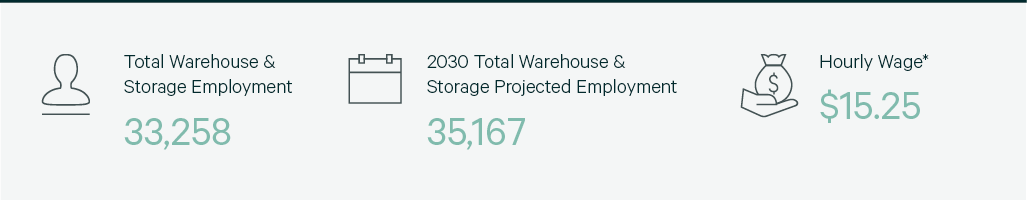
Source: CBRE Labor Analytics.
*Median wage (1 year experience); non-supervisory warehouse material handlers.
Location Incentives
Over the past five years, there have been 131 economic incentives deals totaling more than $359 million at an average of $24,362 per new job in the Kansas City metropolitan area, according to Wavteq.
According to CBRE’s Location Incentives Group, among the top incentive programs in Kansas is the High Performance Incentive Program (HPIP), which offers a 10% tax credit for capital investment totaling more than $1 million. To qualify, for-profit manufacturing companies must pay above-average wages and make a significant investment in employee training.
Among the top incentive programs in Missouri is the Missouri Works Program, which provides payroll rebates and discretionary income tax credits for new jobs. To qualify, at least two full-time jobs must be created with wages exceeding 80% of the average county wage.
Figure 3: Kansas City Top Incentive Programs
Source: CBRE Location Incentives Group.
Note: The extent, if any, of state and local incentive offerings depends on location and scope of the operation.
Logistics Driver
Kansas City’s central location gives it access to 85% of the U.S. population in two days. Numerous ground, air, water and rail transportation options make it one of the most logistics-friendly industrial markets in North America. Kansas City has five Class I rail lines intersecting the region (Kansas City Southern, Burlington Northern Santa Fe, Canadian Pacific, Norfolk Southern and Union Pacific), four of which have intermodal facilities.
Four major U.S. interstate highways (I-35, I-70, I-29 and I-49) intersect the region, which has 30% more interstate miles per capita than any other city in the nation. Kansas City also scores very low in traffic congestion.
Kansas City International Airport is one of the best locations in the U.S. for air cargo and distribution development. It moves more air cargo than any other airport in the six-state region and will add a new terminal in 2023.
Kansas City International Airport is one of the best locations in the U.S. for air cargo and distribution development. It moves more air cargo than any other airport in the six-state region and will add a new terminal in 2023.
Kansas City is on the Missouri River, the largest navigable inland waterway in the U.S. Port KC has more than 900 feet of shoreline that includes three load cells and docking structures for 14 barges. The port terminal has an annual capacity of 800,000 tons and provides rail and truck transfer, covered storage and product distribution.
Numerous ground, air, water and rail transportation options make Kansas City one of the most logistics-friendly industrial markets in North America.

Capital Markets
Robust development is expected in 2022, which will continue to attract new investors to the market. Kansas City ranked among the top 20 markets in the U.S. for rental rate growth in 2021. Cap rate compression of 50 to 75 bps for Class A big-box facilities is expected in 2022.
Figure 4: Cap Rate Comparison
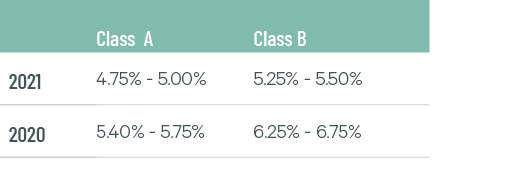
Source: CBRE National Partners.
Supply & Demand
Industrial leasing activity nearly doubled year-over-year to 9.2 million sq. ft., leading to a 30% increase in net absorption to 8.2 million sq. ft. The direct vacancy rate increased 90 bps to 5.6% as 5.2 million sq. ft. of construction completions added vacant space to the market. Another 7.0 million sq. ft. is currently under construction, 17% of which is preleased.
A diverse tenant mix contributed to robust leasing activity last year, with six occupier types posting market share over 10% and led by 3PL providers at 25%. Increased construction will give occupiers more first-generation space options; however, demand is high and this space will be quickly leased, which will lower the vacancy rate and further increase rents in 2022.
Figure 5: Share of 2021 Leasing Activity by Occupier Type

Note: Includes new leases and renewals 200,000 sq. ft. and above.
Source: CBRE Research.
Figure 6: Leasing Activity
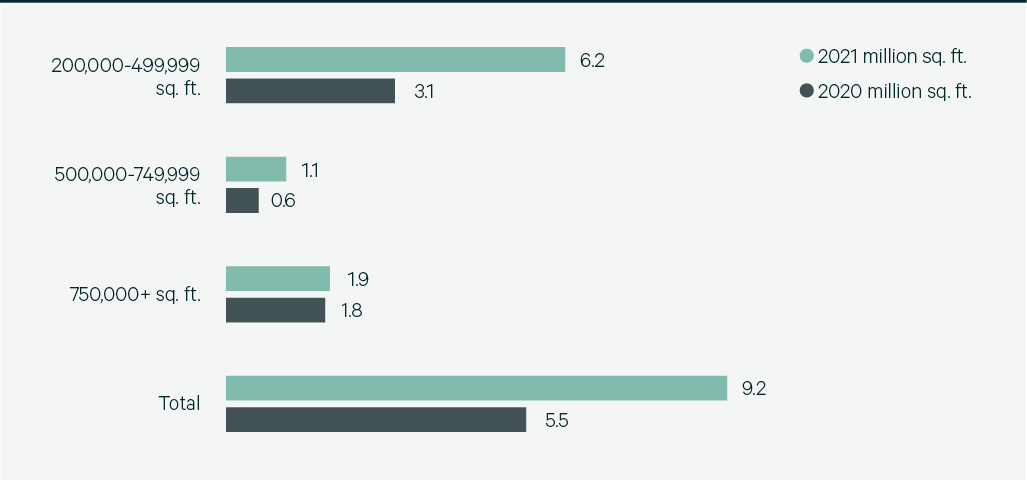
Note: Includes new leases and renewals 200,000 sq. ft. and above.
Source: CBRE Research.
Figure 7: 2021 Construction Completions vs. Overall Net Absorption
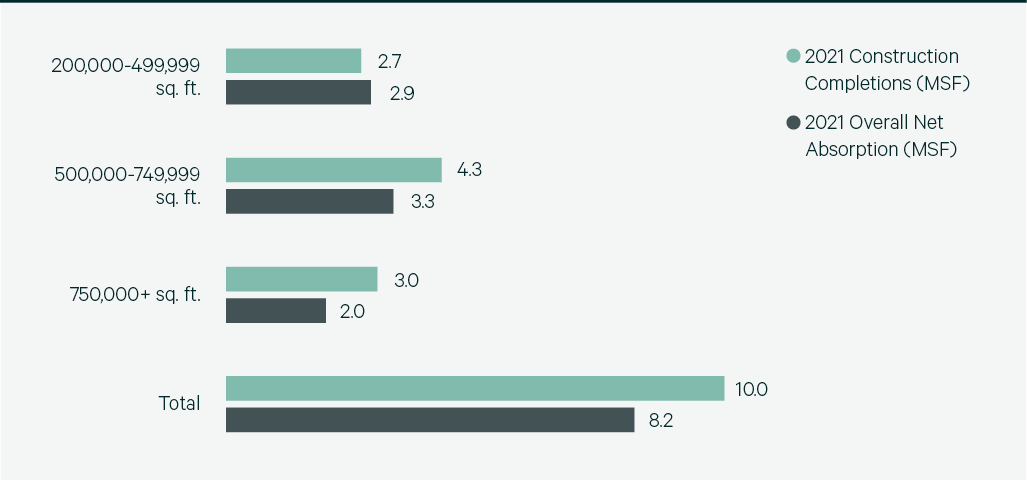
Source: CBRE Research.
Figure 8: Direct Vacancy Rate by Size Range

Source: CBRE Research.
Figure 9: Under Construction & Percentage Preleased
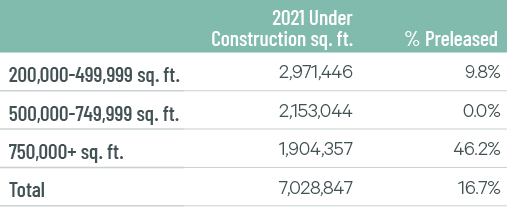
Source: CBRE Research.
Figure 10: Historical First Year Taking Rents (psf/yr)
Note: Includes first year taking rents for leases 200,000 sq. ft. and above.
Source: CBRE Research.
Explore Big Box Insights by Market

Memphis has the nation’s busiest cargo airport, five Class I railroads and a location within a two-day drive to 70% of the U.S.

St. Louis’s central location provides quick access to a large portion of the U.S., making the region a desirable distribution hub.

Chicago’s central location and plethora of logistics capabilities make it one of the most in-demand big-box markets in the country.
Contacts
Austin Baier
Executive Vice President

James Breeze
Vice President, Global Industrial and Retail Research

John Morris
President, Americas Industrial & Logistics, Advisory Services