Future Cities
2022 North America Industrial Big Box Review & Outlook: Memphis
March 11, 2022 5 Minute Read

Memphis has seen strong net absorption of big-box space for the past two years. Class A requirements are limited to only a handful of second-generation space, so new construction is the only option. Users continue to migrate to the Midsouth or expand organically due to Memphis having the nation’s busiest cargo airport, five Class I railroads and a location within a two-day truck drive to 70% of the U.S. population.
Demographics
Approximately 1.5 million people live within 50 miles of the market core, with an expected growth rate of 1.7% over the next five years. Within 250 miles, occupiers can reach 17.6 million people or 6.9 million households.
Figure 1: Memphis Population Analysis
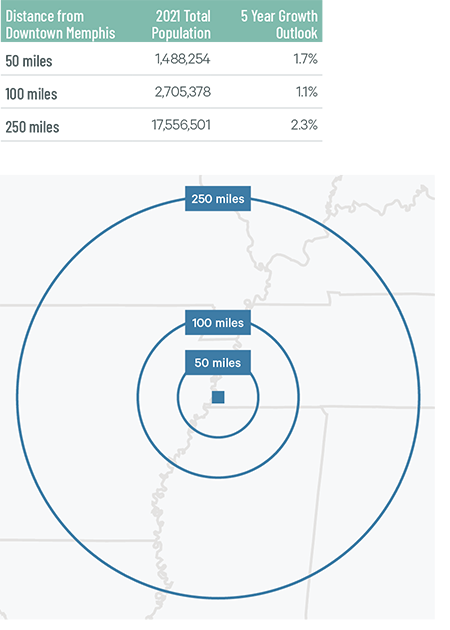
Source: CBRE Location Intelligence.
According to CBRE Labor Analytics, the local warehouse labor force of just over 53,000 is expected to grow by 22% by 2030. The average wage for non-supervisory employees is $14.74 per hour, 1.1% lower than the U.S. average.
Figure 2: Memphis Warehouse & Storage Labor Fundamentals

Source: CBRE Labor Analytics.
*Median wage (1 year experience); non-supervisory warehouse material handlers.
Location Incentives
Over the past five years, there have been 150 economic incentives deals totaling over $596 million at an average of $32,114 per new job in the Memphis metropolitan area, according to Wavteq.
According to CBRE’s Location Incentives Group, among the top incentive programs in Tennessee is the Job Tax Credit, which provides a one-time corporate income tax credit to companies that create at least 25 new jobs within three years and make a minimum capital investment of $500,000. The tax credit may offset up to 50% of franchise and excise taxes, and any unused credits may be carried forward for up to 15 years.
Among the top incentive programs in neighboring Mississippi is the Advantage Jobs Incentive Program, which provides a rebate for 90% of Mississippi payroll taxes withheld to companies that create at least 25 new quality jobs in the state. To qualify, the new jobs must pay at least 110% of the state or county average wage.
Figure 3: Memphis Top Incentive Programs
Source: CBRE Location Incentives Group.
Note: The extent, if any, of state and local incentive offerings depends on location and scope of the operation.
Logistics Driver
Memphis is one of the most logistics-friendly markets in North America. The region has an integrated transportation system of highways, rail mainlines, river ports and the second-busiest cargo airport in the world. More than 27,000 companies have operations in Memphis, including more than 400 trucking companies.
Memphis is one of only four U.S. cities served by five Class I railroads. Single-system shipment is available to all 48 contiguous states, Alaska, Canada and Mexico. Trucks leaving Memphis can reach 35% of the U.S. population overnight and 68% in two days. I-40 runs coast-to-coast, I-55 intersects Memphis and allows direct access from Chicago to Louisiana, and I-69 connects Canada to Mexico.
The Port of Memphis is 400 river miles from St. Louis and 600 from New Orleans, where cargo can be transferred to ocean liners. The No. 1 logistics advantage in the region is Memphis International Airport. Home to the largest FedEx hub in the world, Memphis International is the second most-active air hub in the world and by far the top in North America.
Memphis International is the second most-active air hub in the world and by far the top in North America.

Capital Markets
Memphis has seen tremendous cap rate compression of between 75 and 100 basis points over the past 12 months. Most investors view Memphis as a strong super-regional logistics hub, as the flow of new investment capital into the market continues to increase every quarter. This demand will not stop anytime soon due to the market’s plethora of logistics advantages.
Figure 4: Cap Rate Comparison

Source: CBRE Research.
Supply & Demand
Leasing activity totaled 14.5 million sq. ft. last year, the eighth highest in North America but slightly below 2020’s total. Annual absorption remained on par with 2020 at 9.6 million sq. ft. Despite robust demand, a large amount of new development bumped the vacancy up to 6.7%, which kept the average taking rent at $3.47 per sq. ft.—the lowest of any market in this report.
Memphis’s central location and air cargo capabilities make it a magnet for general retail & wholesale companies, which accounted for 51.7% of total leasing activity in 2021. Despite a higher vacancy rate, ground breakings increased in 2021 with 10.2 million sq. ft. under construction, 37% of which is preleased. More first-generation space will provide occupiers ample opportunity to expand within the market and will limit rent growth this year.
Figure 5: Share of 2021 Leasing Activity by Occupier Type

Note: Includes new leases and renewals 200,000 sq. ft. and above.
Source: CBRE Research.
Figure 6: Leasing Activity

Note: Includes new leases and renewals 200,000 sq. ft. and above.
Source: CBRE Research.
Figure 7: 2021 Construction Completions vs. Overall Net Absorption

Source: CBRE Research.
Figure 8: Direct Vacancy Rate by Size Range

Source: CBRE Research.
Figure 9: Under Construction & Percentage Preleased

Source: CBRE Research.
Figure 10: Historical First Year Taking Rents (psf/yr)
Note: Includes first year taking rents for leases 200,000 sq. ft. and above.
Source: CBRE Research.
Explore Big Box Insights by Market

St. Louis’s central location provides quick access to a large portion of the U.S., making the region a desirable distribution hub.

Nearly 30 million people—23% of them in the 18-to-34 age demographic—live within 250 miles of downtown Louisville.

Kansas City is one of the fastest-growing U.S. industrial markets, with developers delivering over 70 million sq. ft. of Class A space over the past decade.
Contacts
Patrick Walton, SIOR
Executive Vice President

James Breeze
Vice President, Global Industrial and Retail Research

John Morris
President, Americas Industrial & Logistics, Advisory Services