Future Cities
2022 North America Industrial Big Box Review & Outlook: Indianapolis
March 11, 2022 5 Minute Read

Indianapolis' proximity to population centers minimizes outbound shipping costs for distributors. The market also has a deep labor pool that matches the profile distributors demand. With robust speculative development, excellent infrastructure, highly competitive economic incentives packages, a favorable business tax environment and its location in a right-to-work state, Indianapolis checks all the site selection boxes.
Demographics
More than 2.6 million people live within a 50-mile radius of the urban core, with a 4.4% expected growth rate over five years. Solid population growth portends a sizeable labor pool for the foreseeable future. Indianapolis’s central location gives it access to more than 43 million people in a 250-mile radius, 6 million more than nearby Chicago.
Figure 1: Indianapolis Population Analysis

Source: CBRE Location Intelligence.
According to CBRE Labor Analytics, the local warehouse labor force of 62,128 is expected to grow by 18.0% by 2030. The average wage for a non-supervisory employee is $15.06 per hour, 1.0% higher than the national average.
Figure 2: Indianapolis Warehouse & Storage Labor Fundamentals
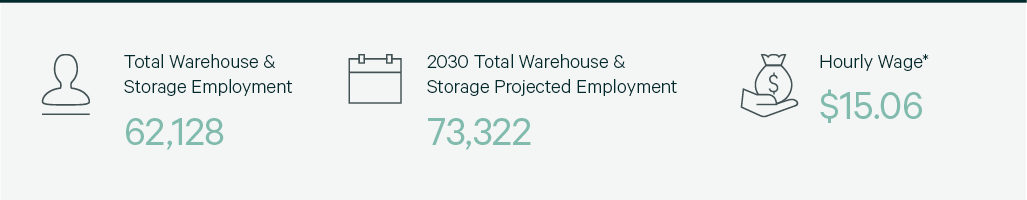
Source: CBRE Labor Analytics.
*Median wage (1 year experience); non-supervisory warehouse material handlers.
Location Incentives
Over the past five years, there have been 529 economic incentives deals totaling more than $979 million at an average of $17,123 per new job in the Indianapolis metropolitan area, according to Wavteq.
According to CBRE’s Location Incentives Group, among the top incentive programs offered in metro Indianapolis is the Economic Development for a Growing Economy (EDGE) Program, which provides refundable discretionary tax credits for corporate income taxes for up to 10 years. These credits equal up to 100% of new income tax withholdings generated by a project’s job creation.
Another incentive program available in metro Indianapolis is the Hoosier Business Investment Tax Credit Program, which offers a non-refundable tax credit to companies that create new jobs and make capital improvements to a business facility. The tax credits are calculated as a percentage of the capital investment made to support the project.
Figure 3: Indianapolis Top Incentive Programs
Source: CBRE Location Incentives Group.
Note: The extent, if any, of state and local incentive offerings depends on location and scope of the operation.
Logistics Driver
Greater Indianapolis offers a plethora of logistics advantages for industrial occupiers. The region is one of the best for trucking, with more national highway intersections than any other state. Under its “Major Moves” program, Indiana is investing $10 billion over 10 years to add 400 miles in new highways. Indianapolis is home to the second largest FedEx air hub in the world, helping Indianapolis International Airport consistently rank among the top five cargo airports in the U.S. Indiana also ranks third for total railroad miles in the country.
The region is one of the best for trucking, with more national highway intersections than any other state.

Capital Markets
Indianapolis' strong market fundamentals and rent growth have resulted in more institutional investors looking to acquire big-box assets in the market. 2021 sales volume set an annual record. Class A cap rates compressed more than anticipated in 2021 and currently stand in the low-4% range. Moderate cap rate compression is expected in 2022.
Figure 4: Cap Rate Comparison

Source: CBRE National Partners.
Supply & Demand
Another robust year of leasing volume has made Indianapolis a top-tier big-box market. Leasing volume totaled 18.2 million sq. ft. in 2021, on par with 2020. 3PL providers accounted for 36.6% of total leasing volume with food & beverage users taking 26%. Developers are adding new supply at a robust clip, with completions exceeding 10 million sq. ft. for the second consecutive year. As a result, the vacancy rate increased by 1.3 percentage points to 8.2%. Approximately 22 million sq. ft. is under construction, most of which is slated for delivery this year. Despite strong leasing activity, new development will keep the vacancy rate at its current level, with rents remaining well below the national average.
Figure 5: Share of 2021 Leasing Activity by Occupier Type
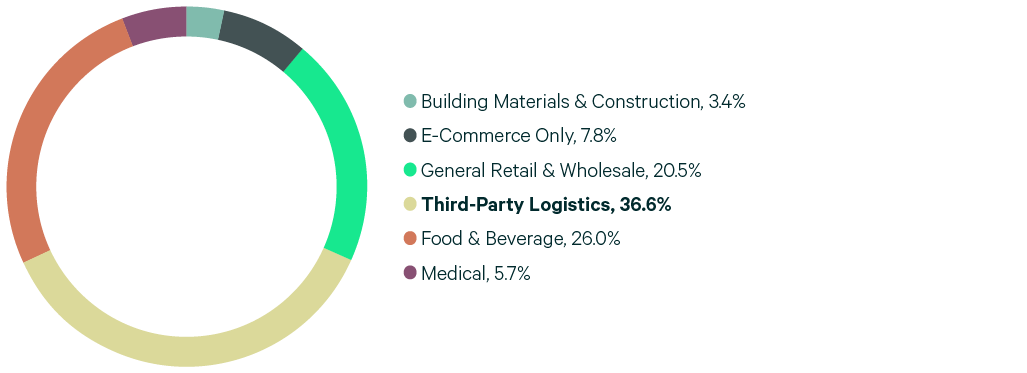
Note: Includes new leases and renewals 200,000 sq. ft. and above.
Source: CBRE Research.
Figure 6: Leasing Activity

Note: Includes new leases and renewals 200,000 sq. ft. and above.
Source: CBRE Research.
Figure 7: 2021 Construction Completions vs. Overall Net Absorption

Source: CBRE Research.
Figure 8: Direct Vacancy Rate by Size Range
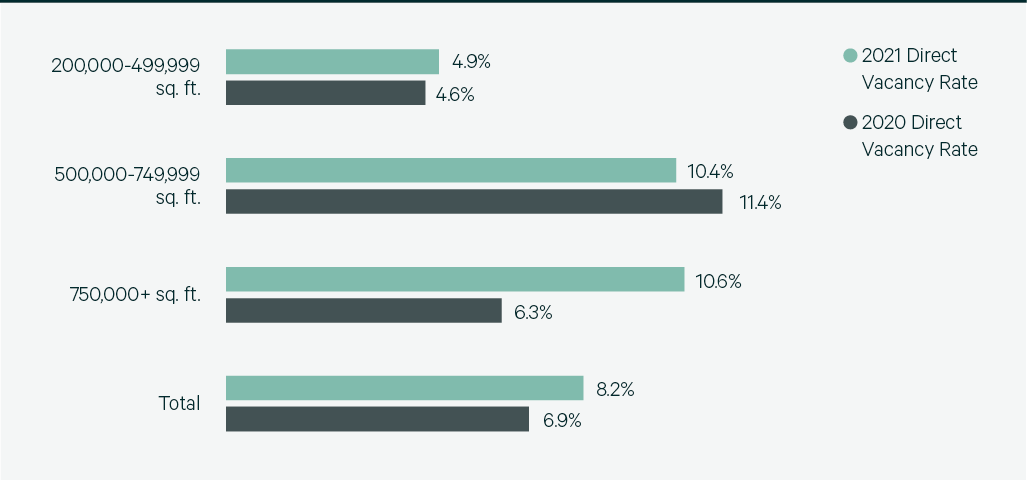
Source: CBRE Research.
Figure 9: Under Construction & Percentage Preleased
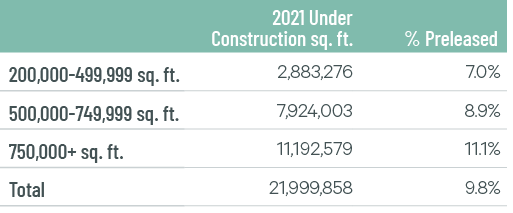
Source: CBRE Research.
Figure 10: Historical First Year Taking Rents (psf/yr)
Note: Includes first year taking rents for leases 200,000 sq. ft. and above.
Source: CBRE Research.
Explore Big Box Insights by Market

Cincinnati is among the top-performing markets in the Midwest, with a large foreign and domestic buyer pool.

St. Louis’s central location provides quick access to a large portion of the U.S., making the region a desirable distribution hub.

The Columbus industrial market's rapid growth is expected to continue in 2022, based on record levels of absorption, rent growth and land acquisitions.
Contacts
Jeremy Woods
Executive Vice President

James Breeze
Vice President, Global Industrial and Retail Research

John Morris
President, Americas Industrial & Logistics, Advisory Services