Future Cities
2022 North America Industrial Big Box Review & Outlook: Columbus
March 11, 2022 5 Minute Read

The Columbus industrial market's rapid growth is expected to continue in 2022, based on record levels of absorption, rent growth and land acquisitions. Landlords are increasing rental rates on lease renewals and are unlikely to negotiate more than nine to 12 months in advance. With several million square feet of speculative development scheduled for delivery over the next six quarters, tenants will have more options to meet their demand for immediate occupancy. Landlords, in turn, will factor in increased construction costs to their asking rents.
Demographics
More than 2.5 million people live within 50 miles of the market core, with a projected growth rate of 4.3% over the next five years—the highest of any major Midwest city. As home to one of the largest public universities in the country, nearly 25% of the city’s 50-mile-radius population is within the 18-to-34 age demographic.
Figure 1: Columbus Population Analysis
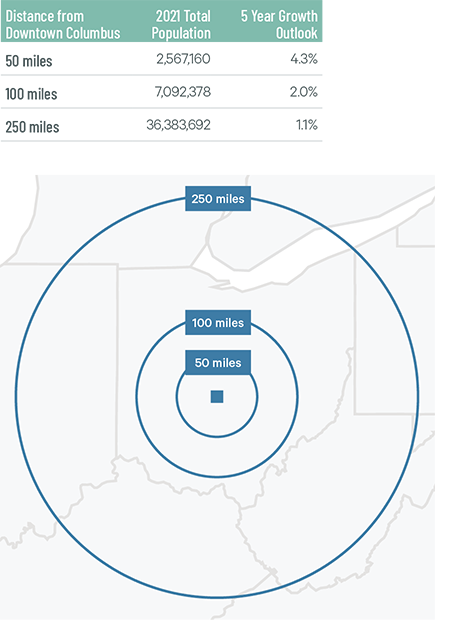
Source: CBRE Location Intelligence.
According to CBRE Labor Analytics, the region’s warehouse labor force of 50,294 is expected to grow 12.8% by 2030. The average wage for a non-supervisory employee is $15.26 per hour, 2.3% above the national average.
Figure 2: Columbus Warehouse & Storage Labor Fundamentals
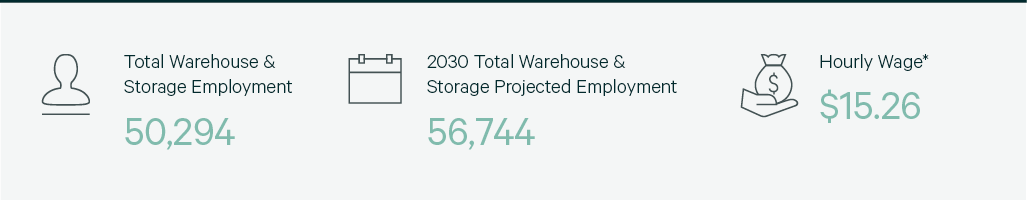
Source: CBRE Labor Analytics.
*Median wage (1 year experience); non-supervisory warehouse material handlers.
Location Incentives
Over the past five years, there have been 219 economic incentives deals totaling $525 million at an average of $22,595 per new job in the Columbus metropolitan area, according to Wavteq.
According to CBRE’s Location Incentives Group, among the top incentive programs offered in metro Columbus is the Job Creation Tax Credit (JCTC) program, which provides a refundable and performance-based tax credit that is calculated as a percent of created payroll and is applied toward a company’s commercial activity tax liability. JCTC was designed to create a more competitive business climate in Ohio by incentivizing companies that are considering doing business elsewhere.
Another incentive program available in metro Columbus is the Economic Development Grant, which is a discretionary cash grant intended to promote job creation and business expansion. The grant is typically awarded based on fixed-asset and infrastructure investments by companies, as well as substantial job creation.
Figure 3: Columbus Top Incentive Programs
Source: CBRE Location Incentives Group.
Note: The extent, if any, of state and local incentive offerings depends on location and scope of the operation.
Logistics Driver
The Rickenbacker Inland Port is one of the fastest growing inland ports in the country and is the epicenter of Columbus air, rail and ground transportation. The port is anchored by Rickenbacker International, one of the only cargo-dedicated airports in the world, with direct flights to Europe, Asia and the Middle East. Both Norfolk Southern and CSX have rail hubs within the port, giving the region direct rail access to major East Coast seaports. Interstate 70 passes through Columbus, giving direct highway access to a large part of the U.S. population.
Rickenbacker International is one of the only cargo-dedicated airports in the world, with direct flights to Europe, Asia and the Middle East.

Capital Markets
Columbus is the fastest-growing metropolitan area in the Midwest in terms of population and GDP, leading to a boom in investment sales and bulk e-commerce distribution activity over the past five years. Class A cap rates decreased by more than 1 percentage point to the high 3% range for Class A assets in 2021. User demand and rent growth have remained robust and show no signs of slowing down. The market should see cap rates compress 25 bps for Class A bulk and will continue to attract both domestic and foreign capital in 2022.
Figure 4: Cap Rate Comparison

Source: CBRE National Partners.
Supply & Demand
Columbus is one of the top emerging markets in North America, with record-breaking leasing activity and net absorption. Leasing activity totaled 19.8 million sq. ft. in 2021, the sixth highest in North America and nearly double the 11.7 million sq. ft in 2020. Net absorption of 13.1 million sq. ft. pushed the industrial vacancy rate to a record-low 1.7% last year. Developers have responded with 12.1 million sq. ft. currently under construction, 30% of which is preleased.
Demand was led by general retail & wholesalers and 3PLs, each accounting for a 30% market share. Despite robust activity, rents remain much below the national average at $3.97 per sq. ft. per year. These comparatively low rental rates and an increase in available first-generation product could lead big-box occupiers looking to expand in the Midwest to choose Columbus.
Figure 5: Share of 2021 Leasing Activity by Occupier Type

Note: Includes new leases and renewals 200,000 sq. ft. and above.
Source: CBRE Research.
Figure 6: Leasing Activity
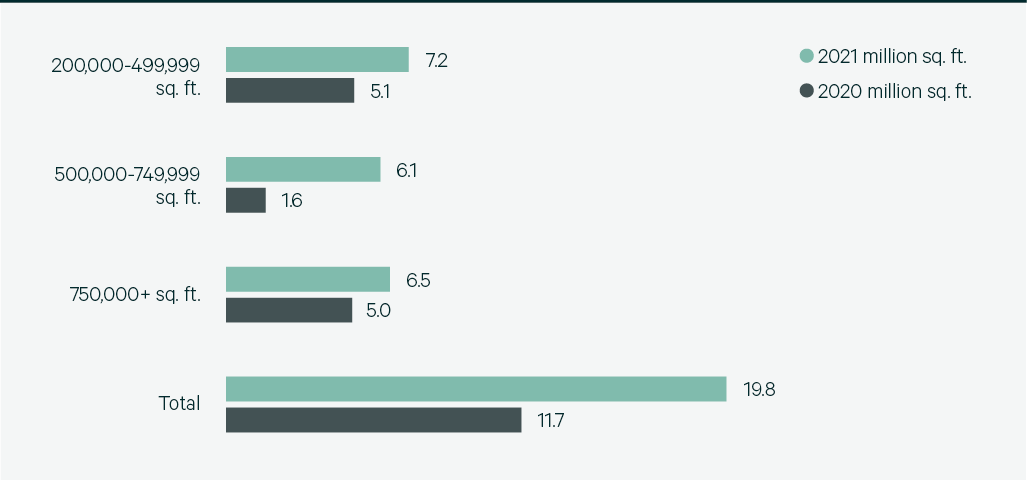
Note: Includes new leases and renewals 200,000 sq. ft. and above.
Source: CBRE Research.
Figure 7: 2021 Construction Completions vs. Overall Net Absorption
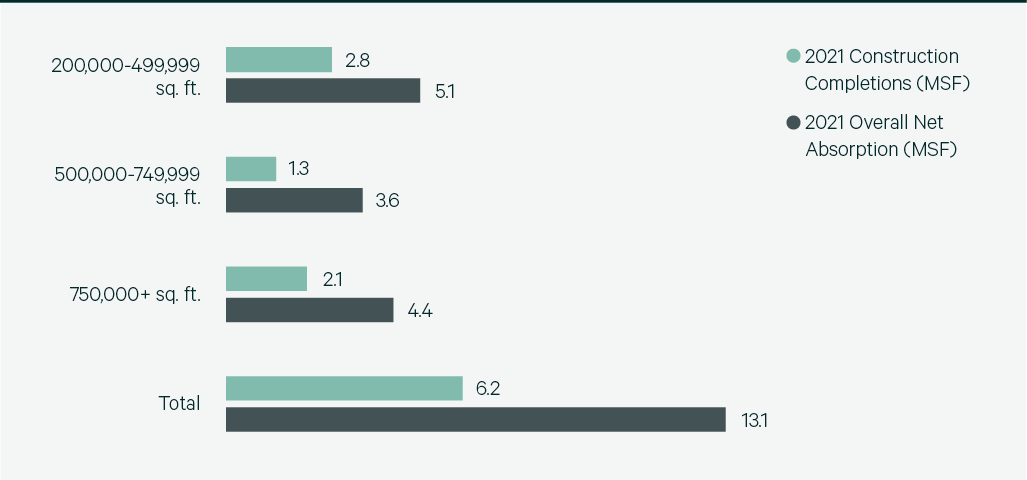
Source: CBRE Research.
Figure 8: Direct Vacancy Rate by Size Range
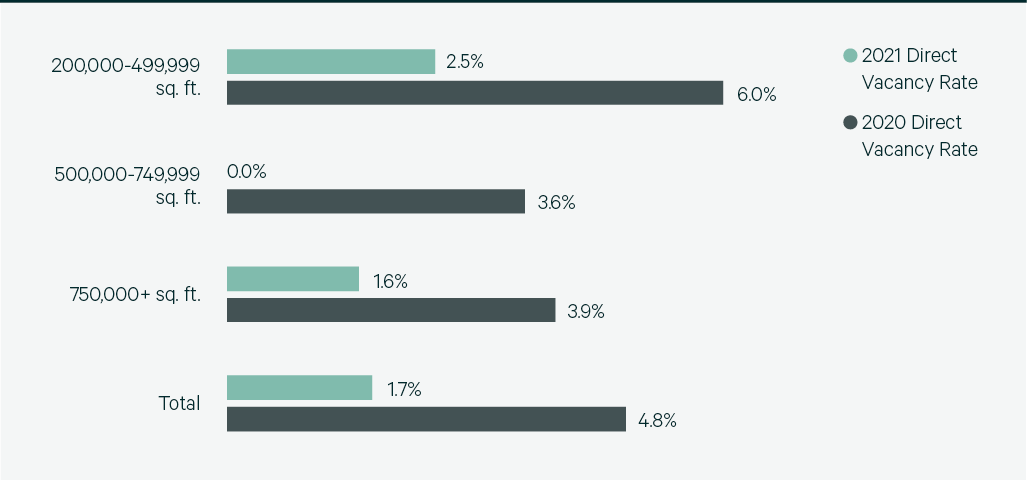
Source: CBRE Research.
Figure 9: Under Construction & Percentage Preleased
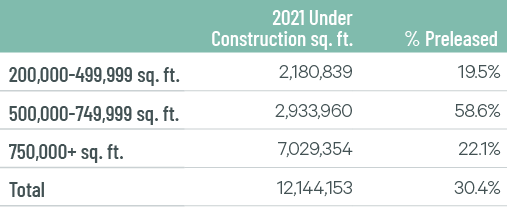
Source: CBRE Research.
Figure 10: Historical First Year Taking Rents (psf/yr)
Note: Includes first year taking rents for leases 200,000 sq. ft. and above.
Source: CBRE Research.
Explore Big Box Insights by Market

Nearly 30 million people—23% of them in the 18-to-34 age demographic—live within 250 miles of downtown Louisville.

Cincinnati is among the top-performing markets in the Midwest, with a large foreign and domestic buyer pool.

With excellent infrastructure, competitive economic incentives and a favorable business tax environment, Indianapolis checks all the site selection boxes.
Contacts
James Breeze
Vice President, Global Industrial and Retail Research

John Morris
President, Americas Industrial & Logistics, Advisory Services