Chapter 6
Regional Office Insights
2023–2024 CBRE Global Workplace & Occupancy Insights
5 Minute Read
Figure 27: Data Set Size
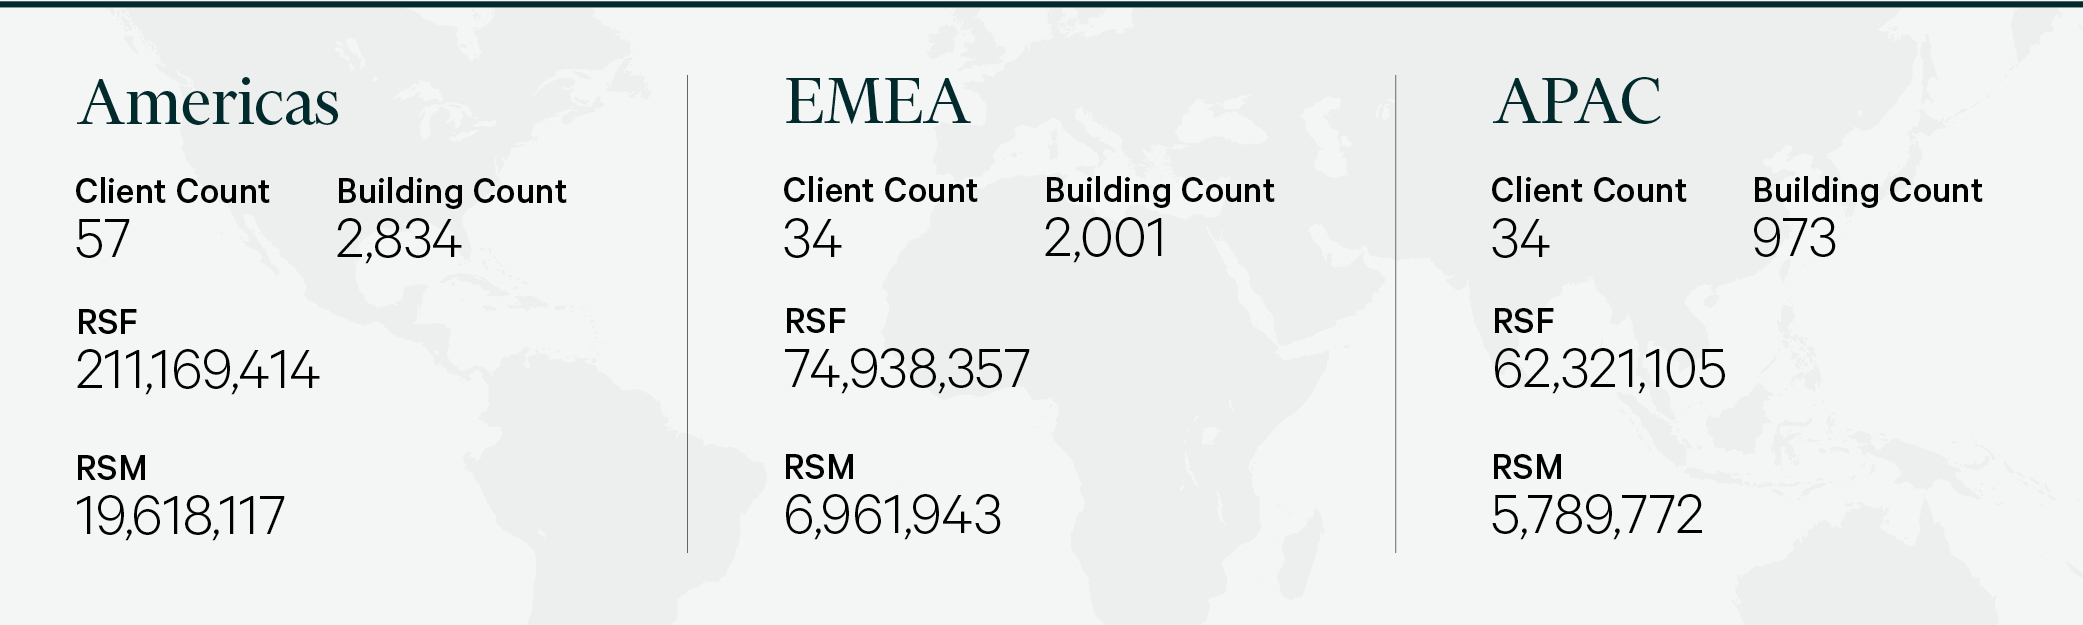
Portfolio Changes 2020-2026
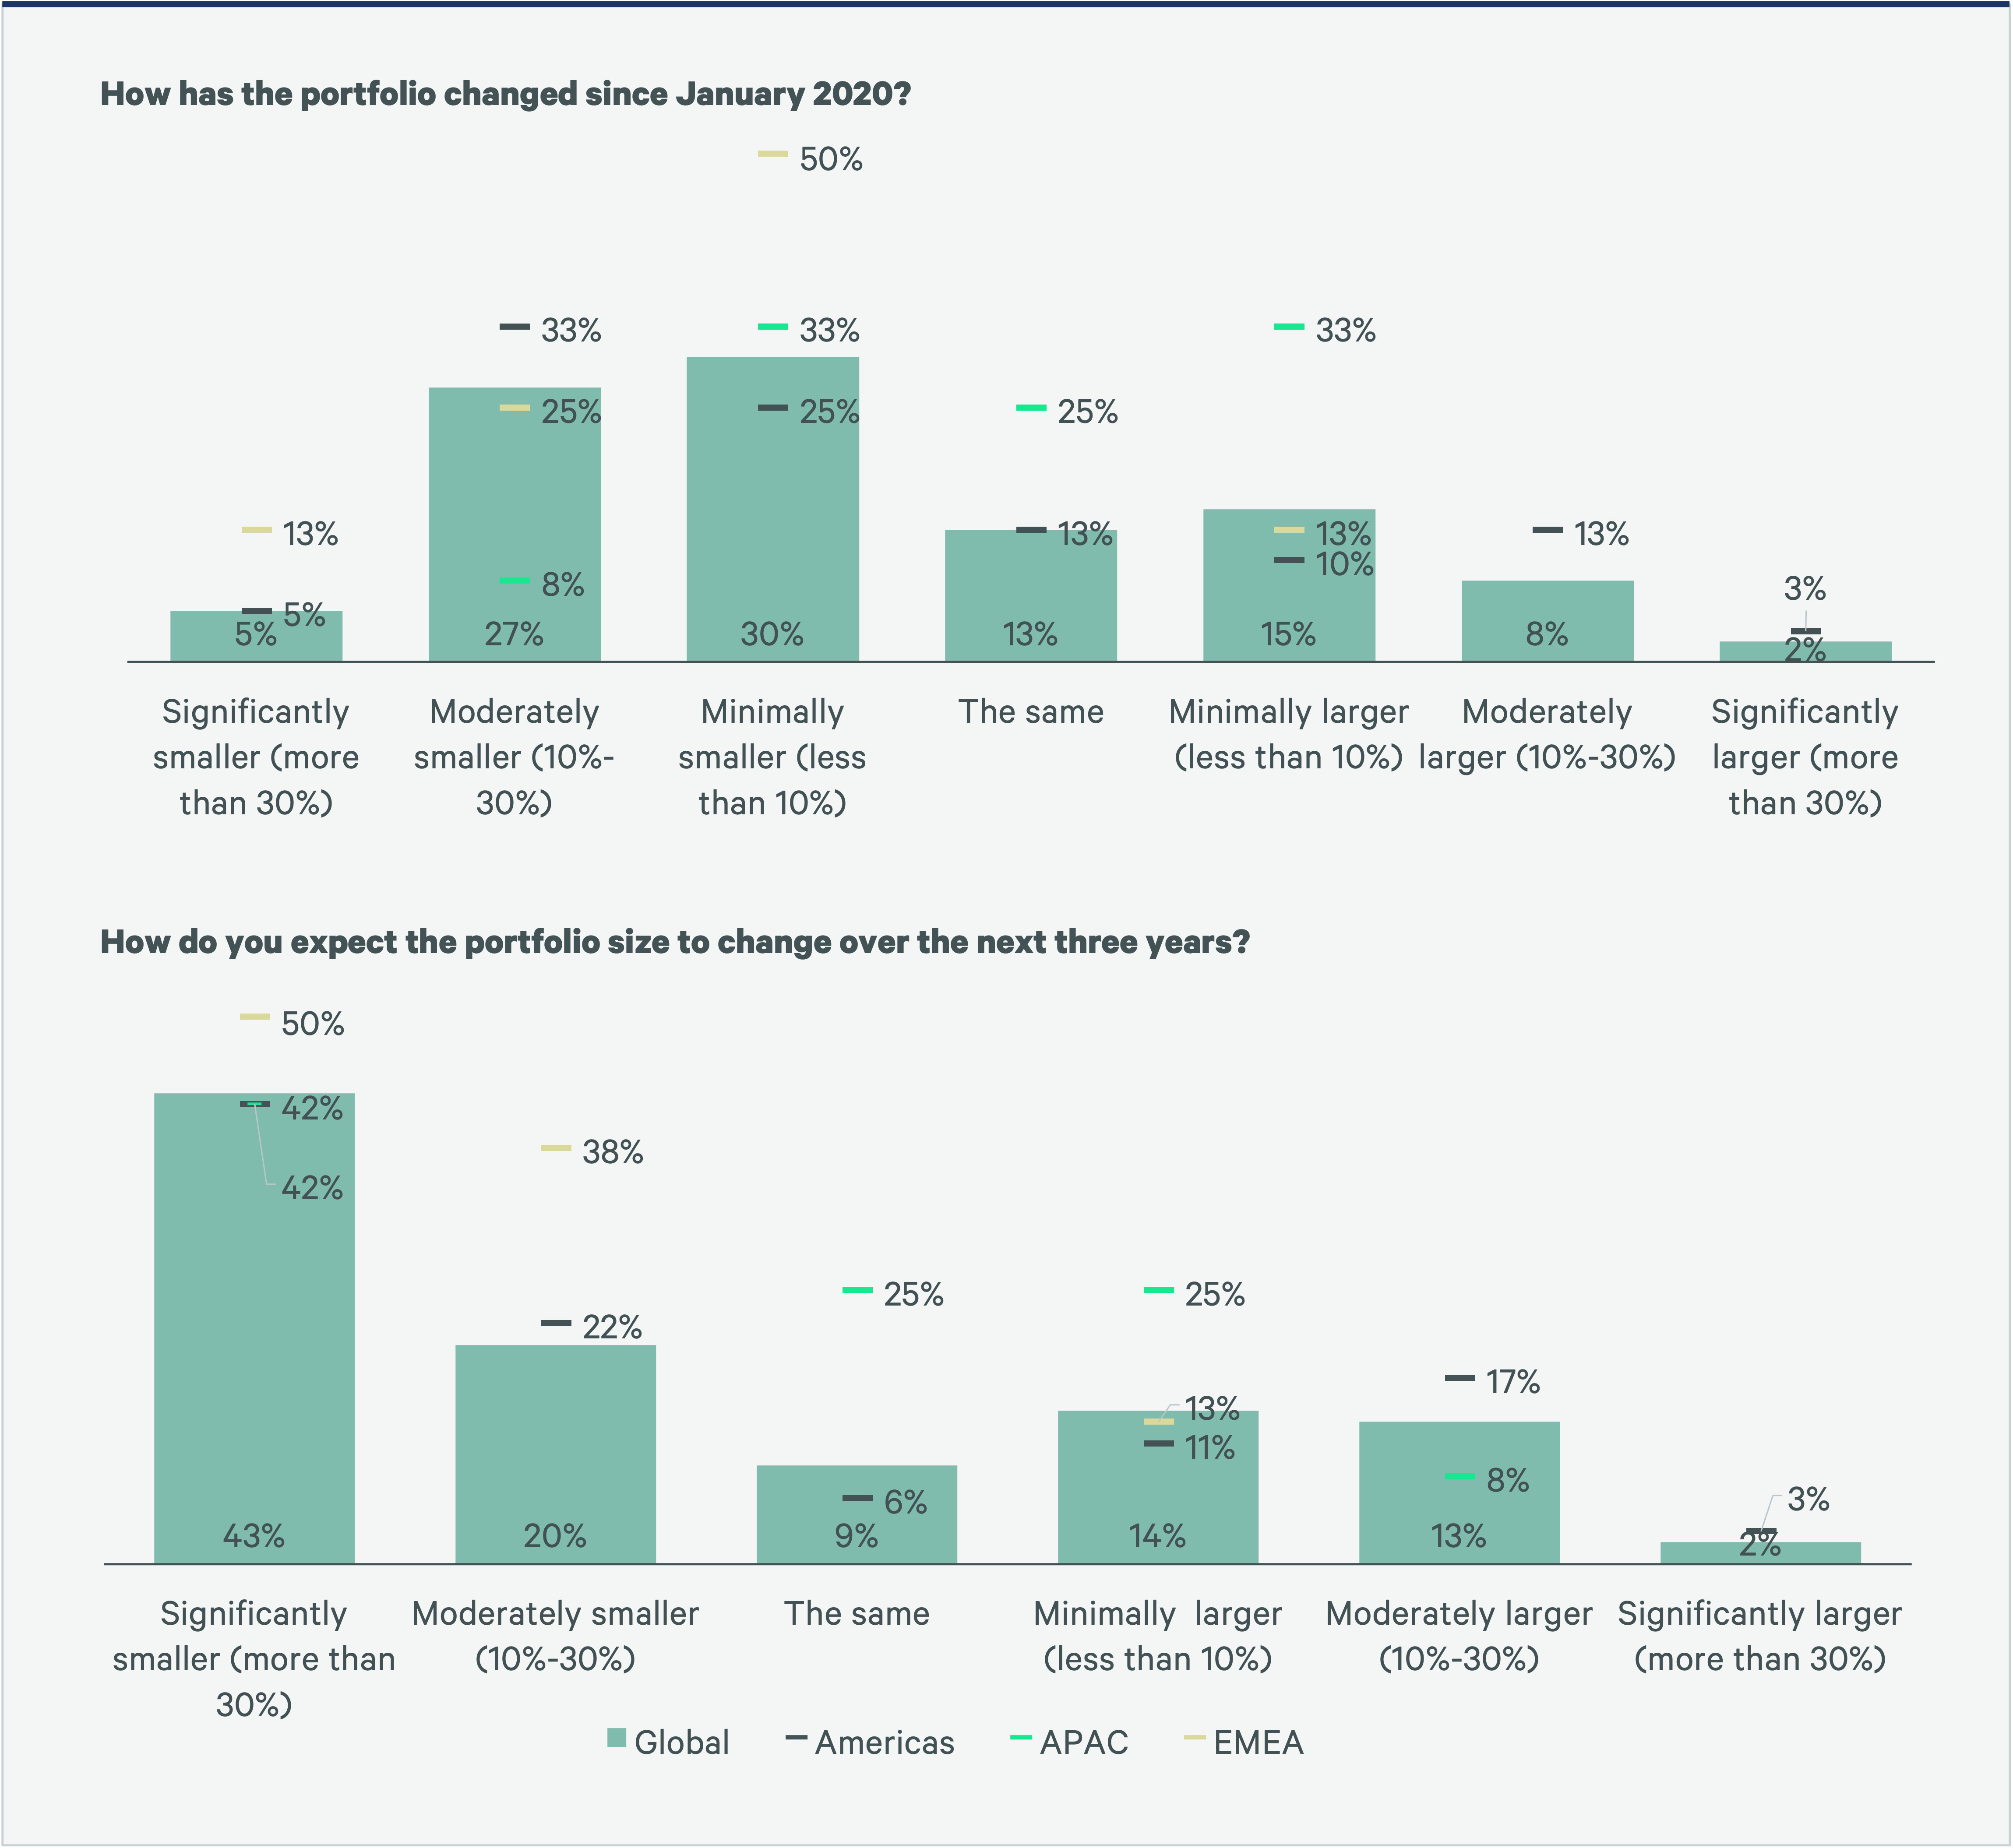
Americas: 63% of Americas participants reduced their portfolio size between 2020 and 2023. 64% of participants expect further portfolio reductions by 2026. 31% of participants plan to expand their portfolios over the next three years.
APAC: The majority of Asia-Pacific participants (92%) saw minimal (around 10%) or no change to portfolio size since January 2020. While no participants reported significant portfolio reductions (-30%) yet, about 2 out of 5 still expect this magnitude of reduction taking place within the next three years.
In addition, 33% of Asia-Pacific participants expect portfolio size to increase—the highest percentage among all regions.
EMEA: 75% of EMEA participants have experienced portfolio reductions since the beginning of 2020, in part enabled by increased space-sharing. With utilization rates still significantly below pre-pandemic levels and the widespread acceptance of hybrid working, 88% of participants expect further contraction over the next three years, with 50% expecting their portfolio to be significantly smaller in the future.
Figure 28: Portfolio changes 2020-2026
Key Office Metrics
Americas: Despite an average office occupancy rate of 81%, average office utilization in Americas was 31%—the lowest of all regions. Decreases in sq. ft./sq. m. per person (4%) and sq. ft./sq. m. per seat (10%) combined with a 12% increase in occupancy rates, prove that portfolio optimization efforts have made office designs more efficient since 2021.
APAC: All three key office metrics indicate Asia-Pacific has the most efficient office space globally, and increasingly so over the last three years. In 2023, occupancy rates are at 125% (37% increase from 2021), utilization rates are at 40%—the highest among all regions—and density metrics are at 126 sq. ft./12 sq. m. per seat and 101 sq. ft/9 sq. m. per person (34% reduction from 2021).
EMEA: While average office utilization in EMEA was 36%, it is expected to rise given that 66% of organizations now have some form of attendance requirement in place. Although utilization levels are still considerably lower than pre-pandemic levels, 55% of participants in EMEA feel they have found a steady state in terms of occupancy levels, indicating further office consolidation as organizations right size their portfolios.
Figure 29A: Average Office Utilization Rates from Q2 2022- Q2 2023
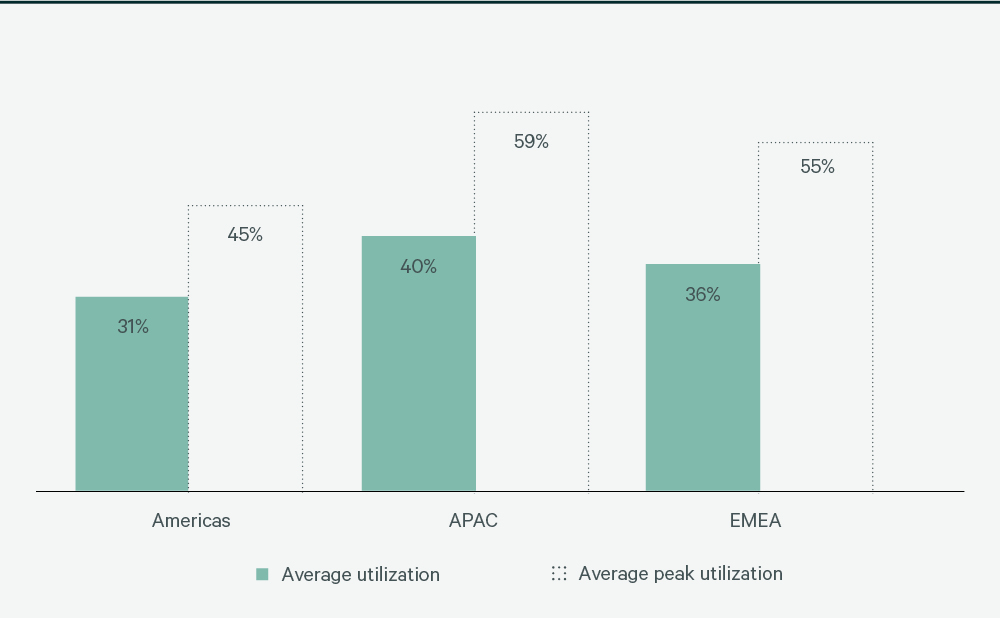
Figure 29B: Average office occupancy rates from Q2 2022- Q2 2023
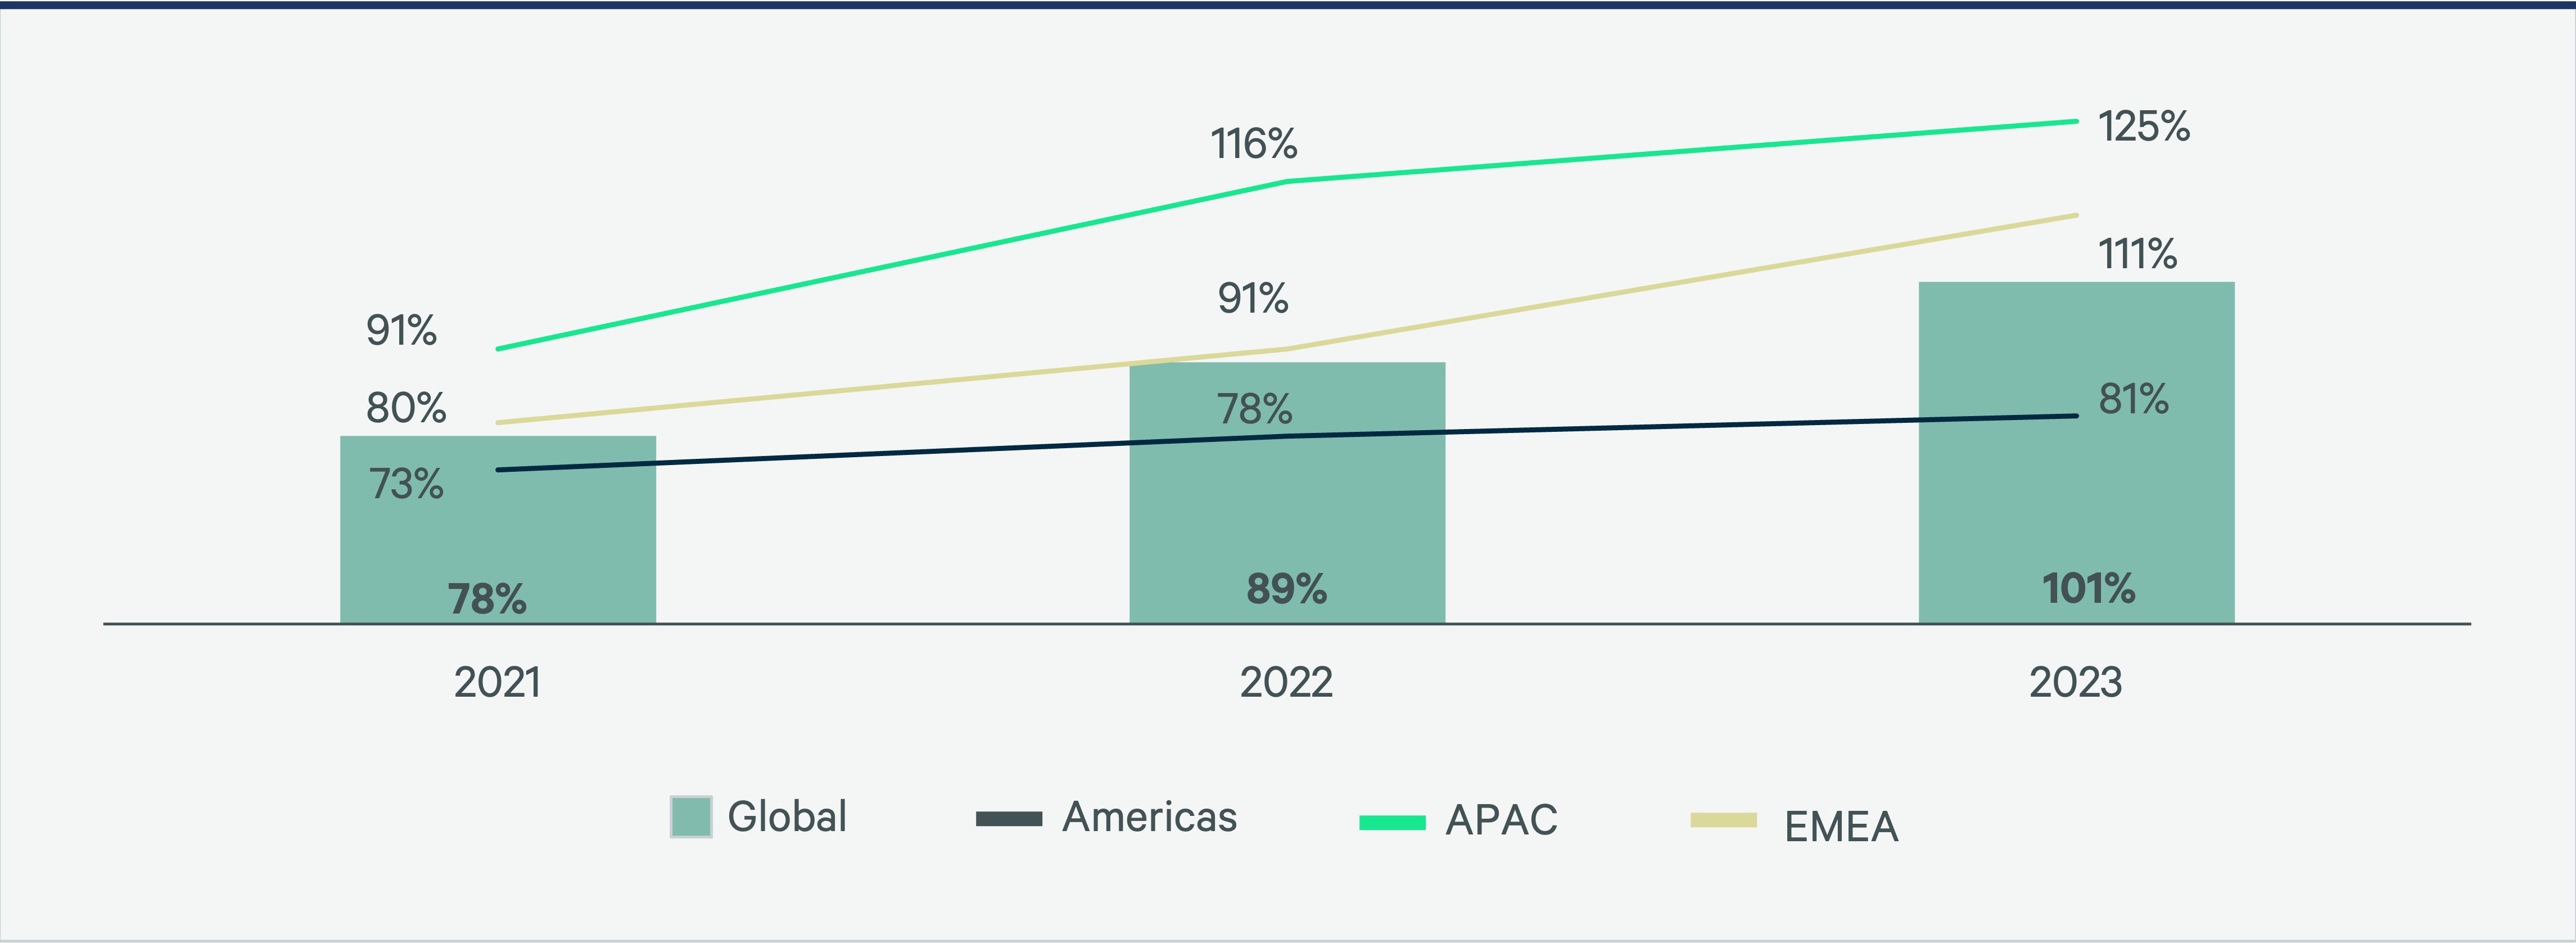
Figure 29C: Average SF per person 2021-2023
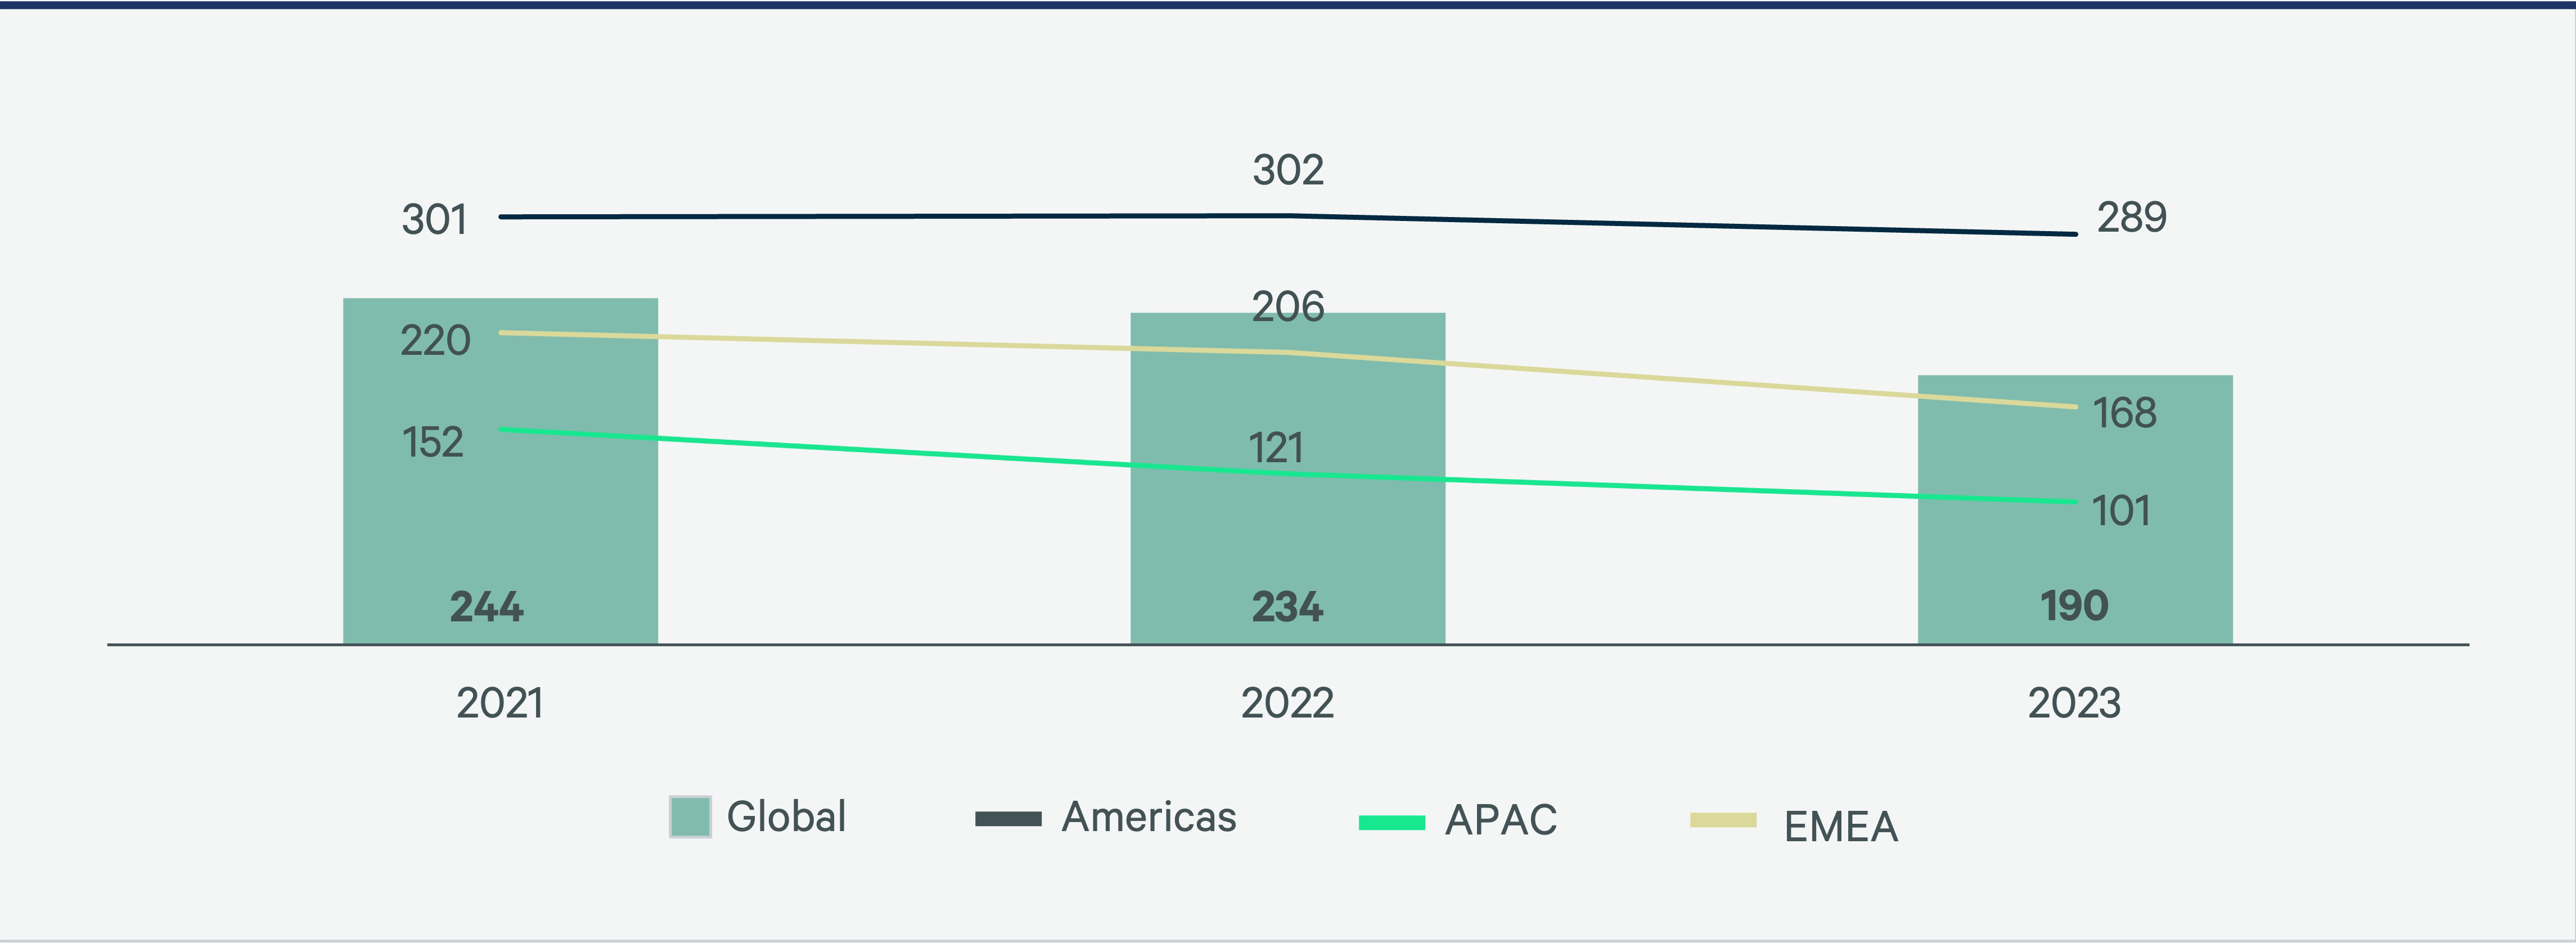
Figure 29D: Average SM per person 2021-2023
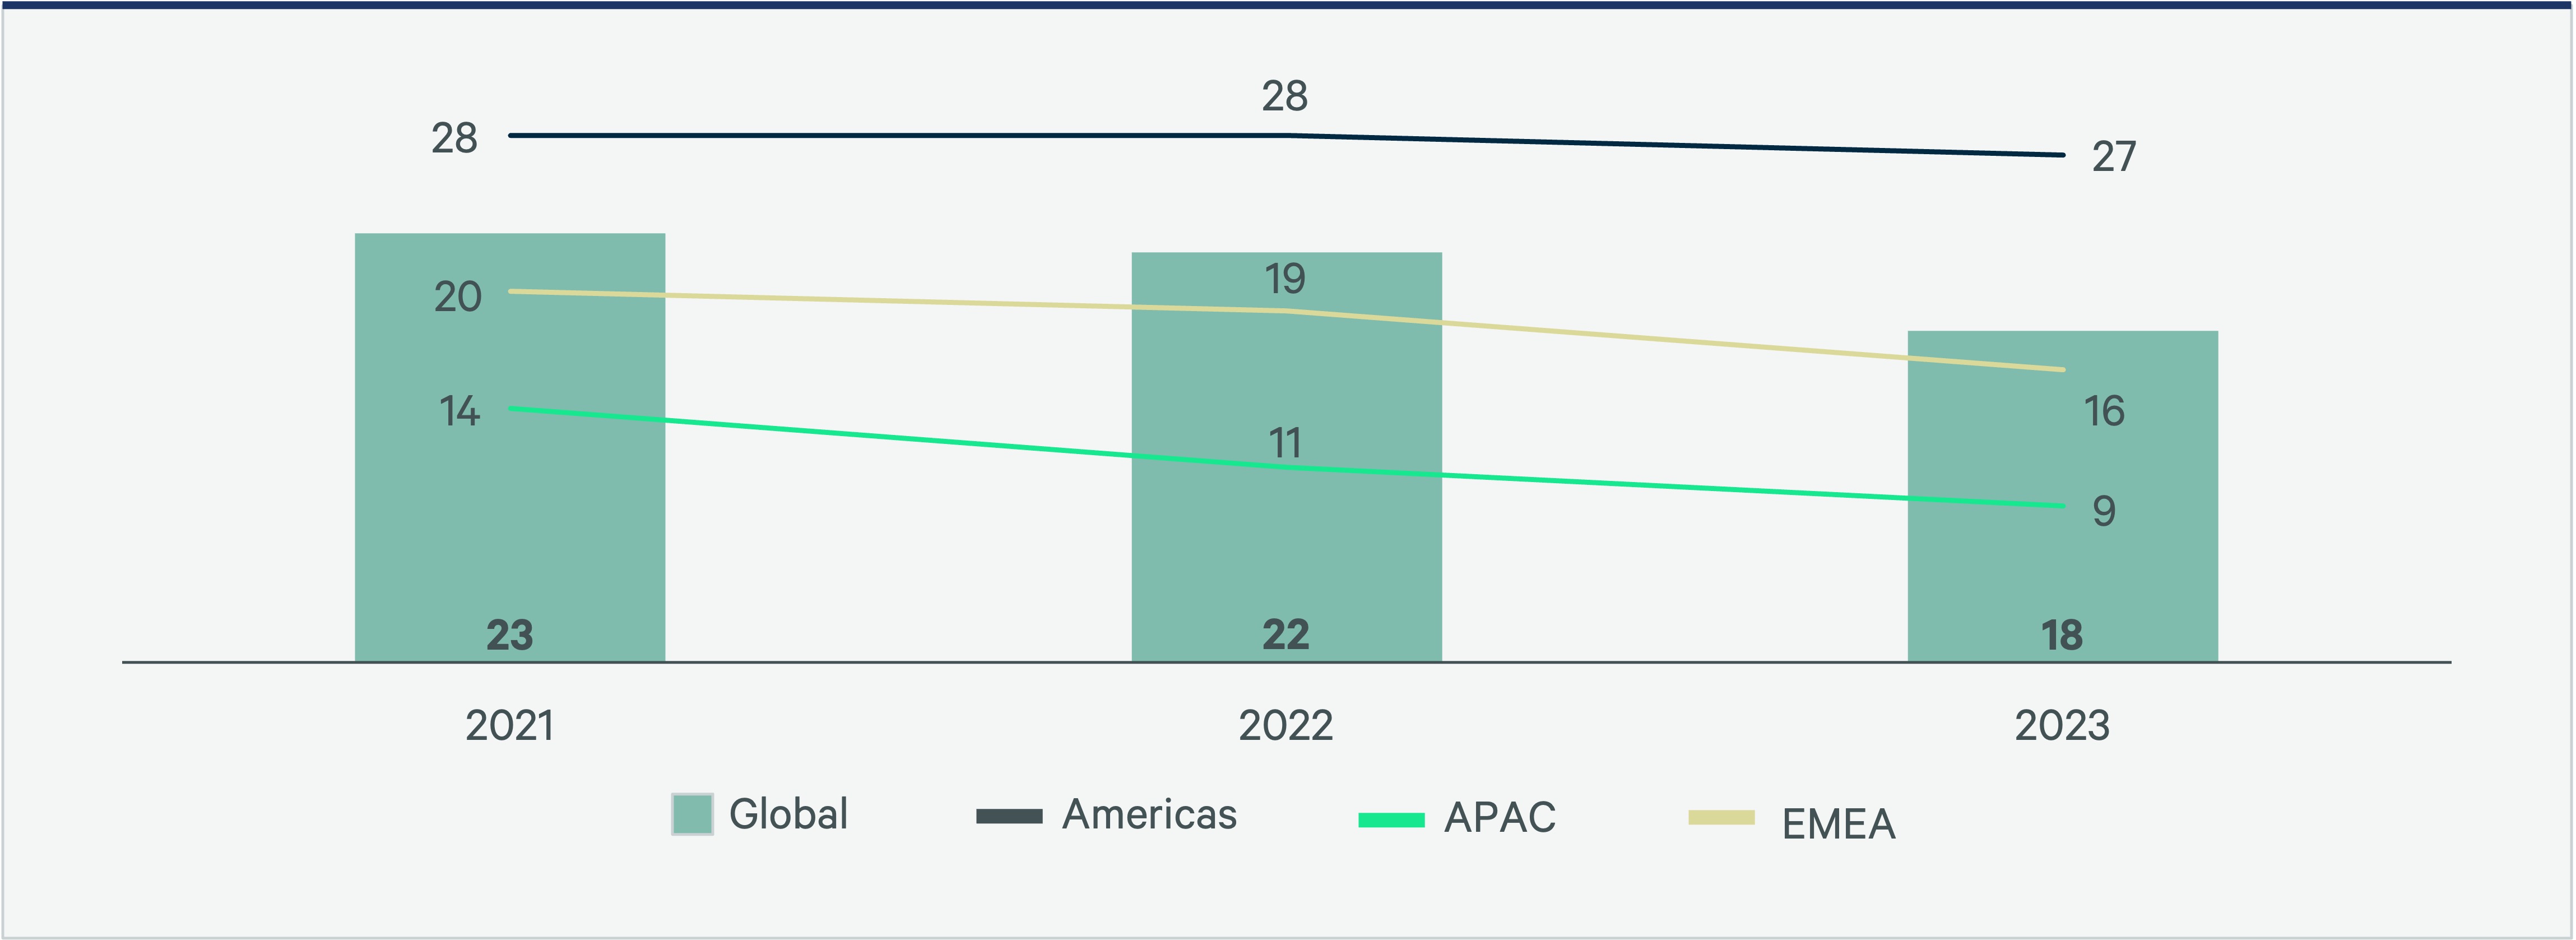
Figure 29E: Average SF per seat 2021-2023
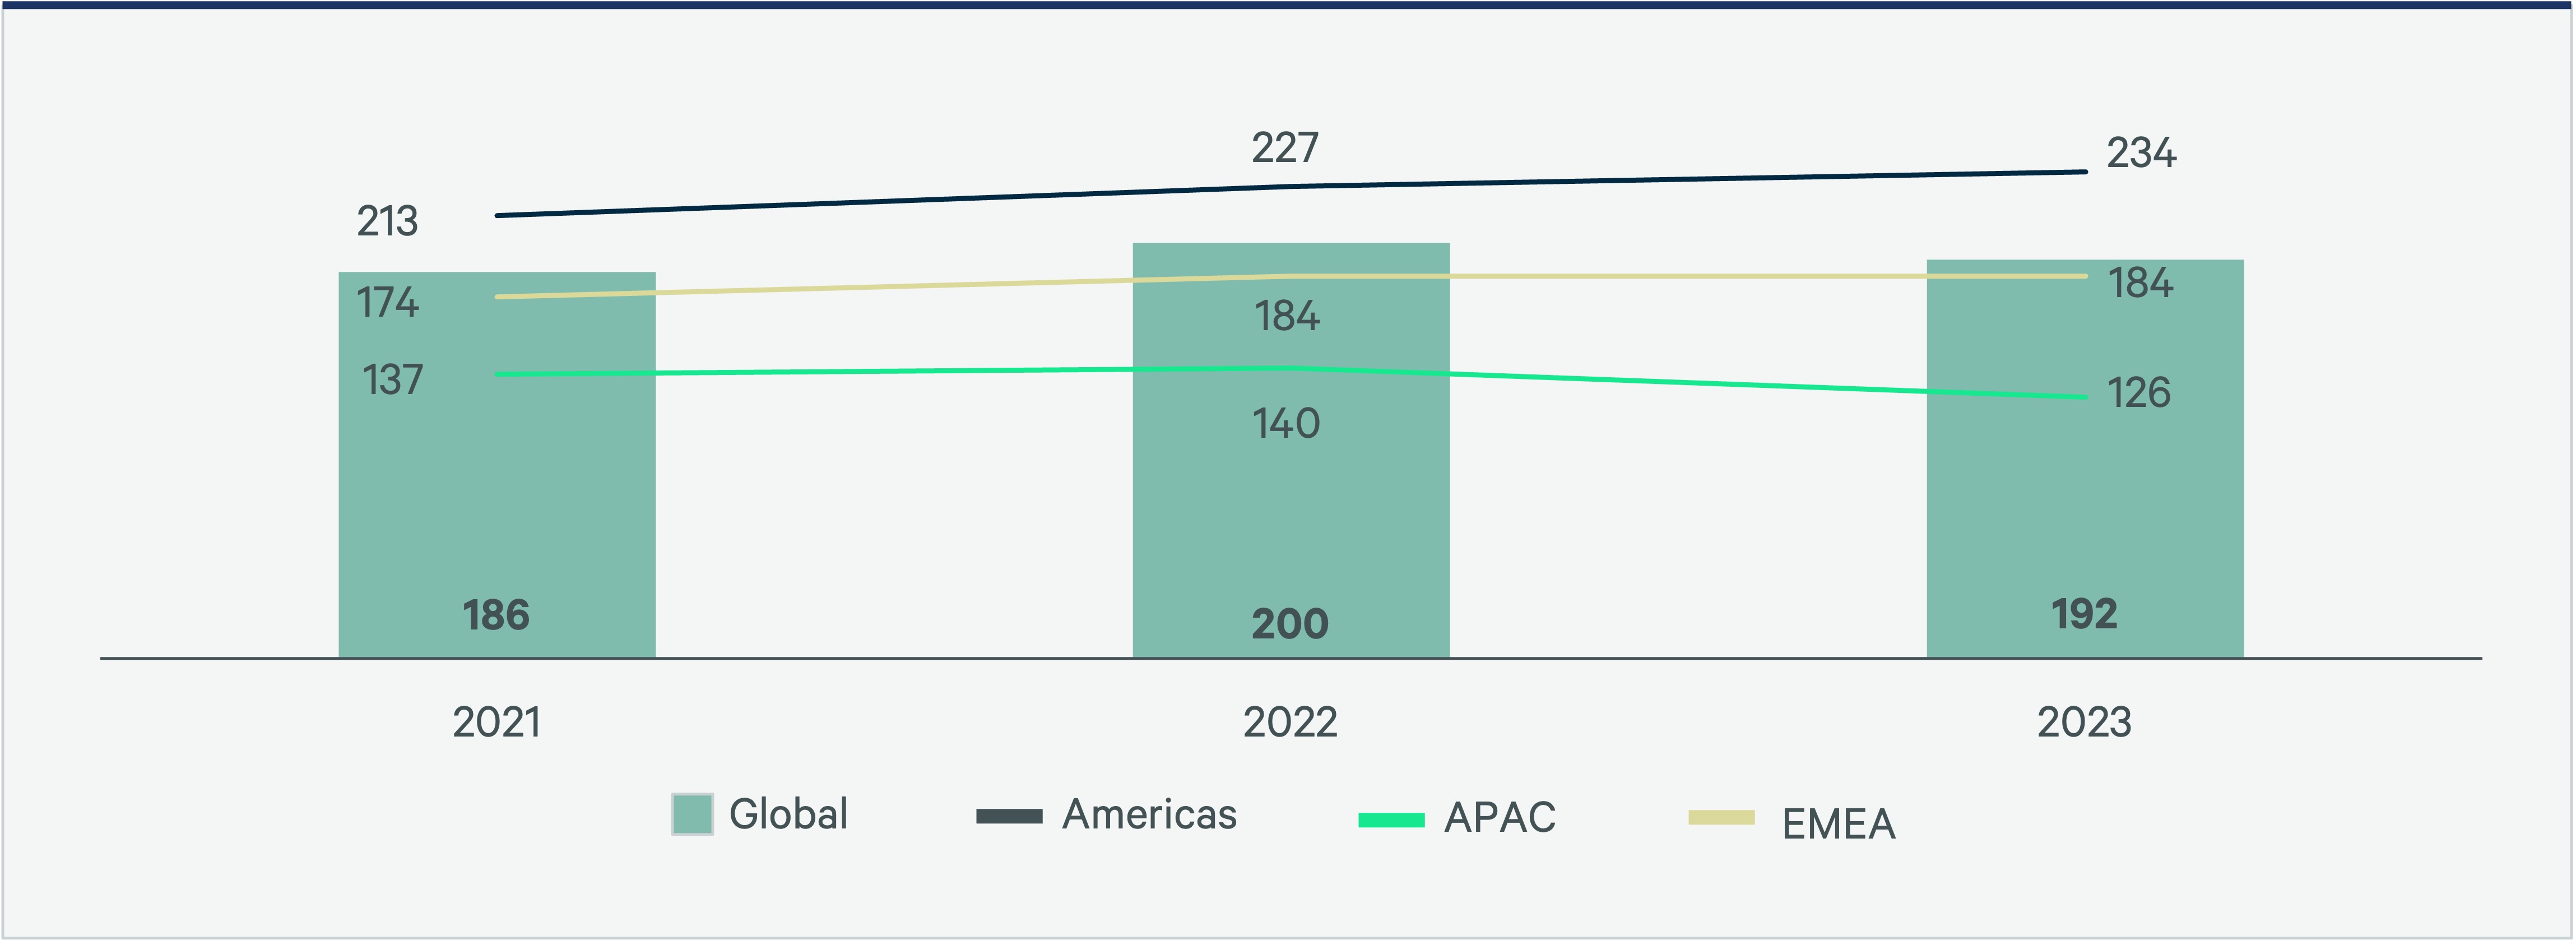
Figure 29F: Average SM per seat 2021-2023
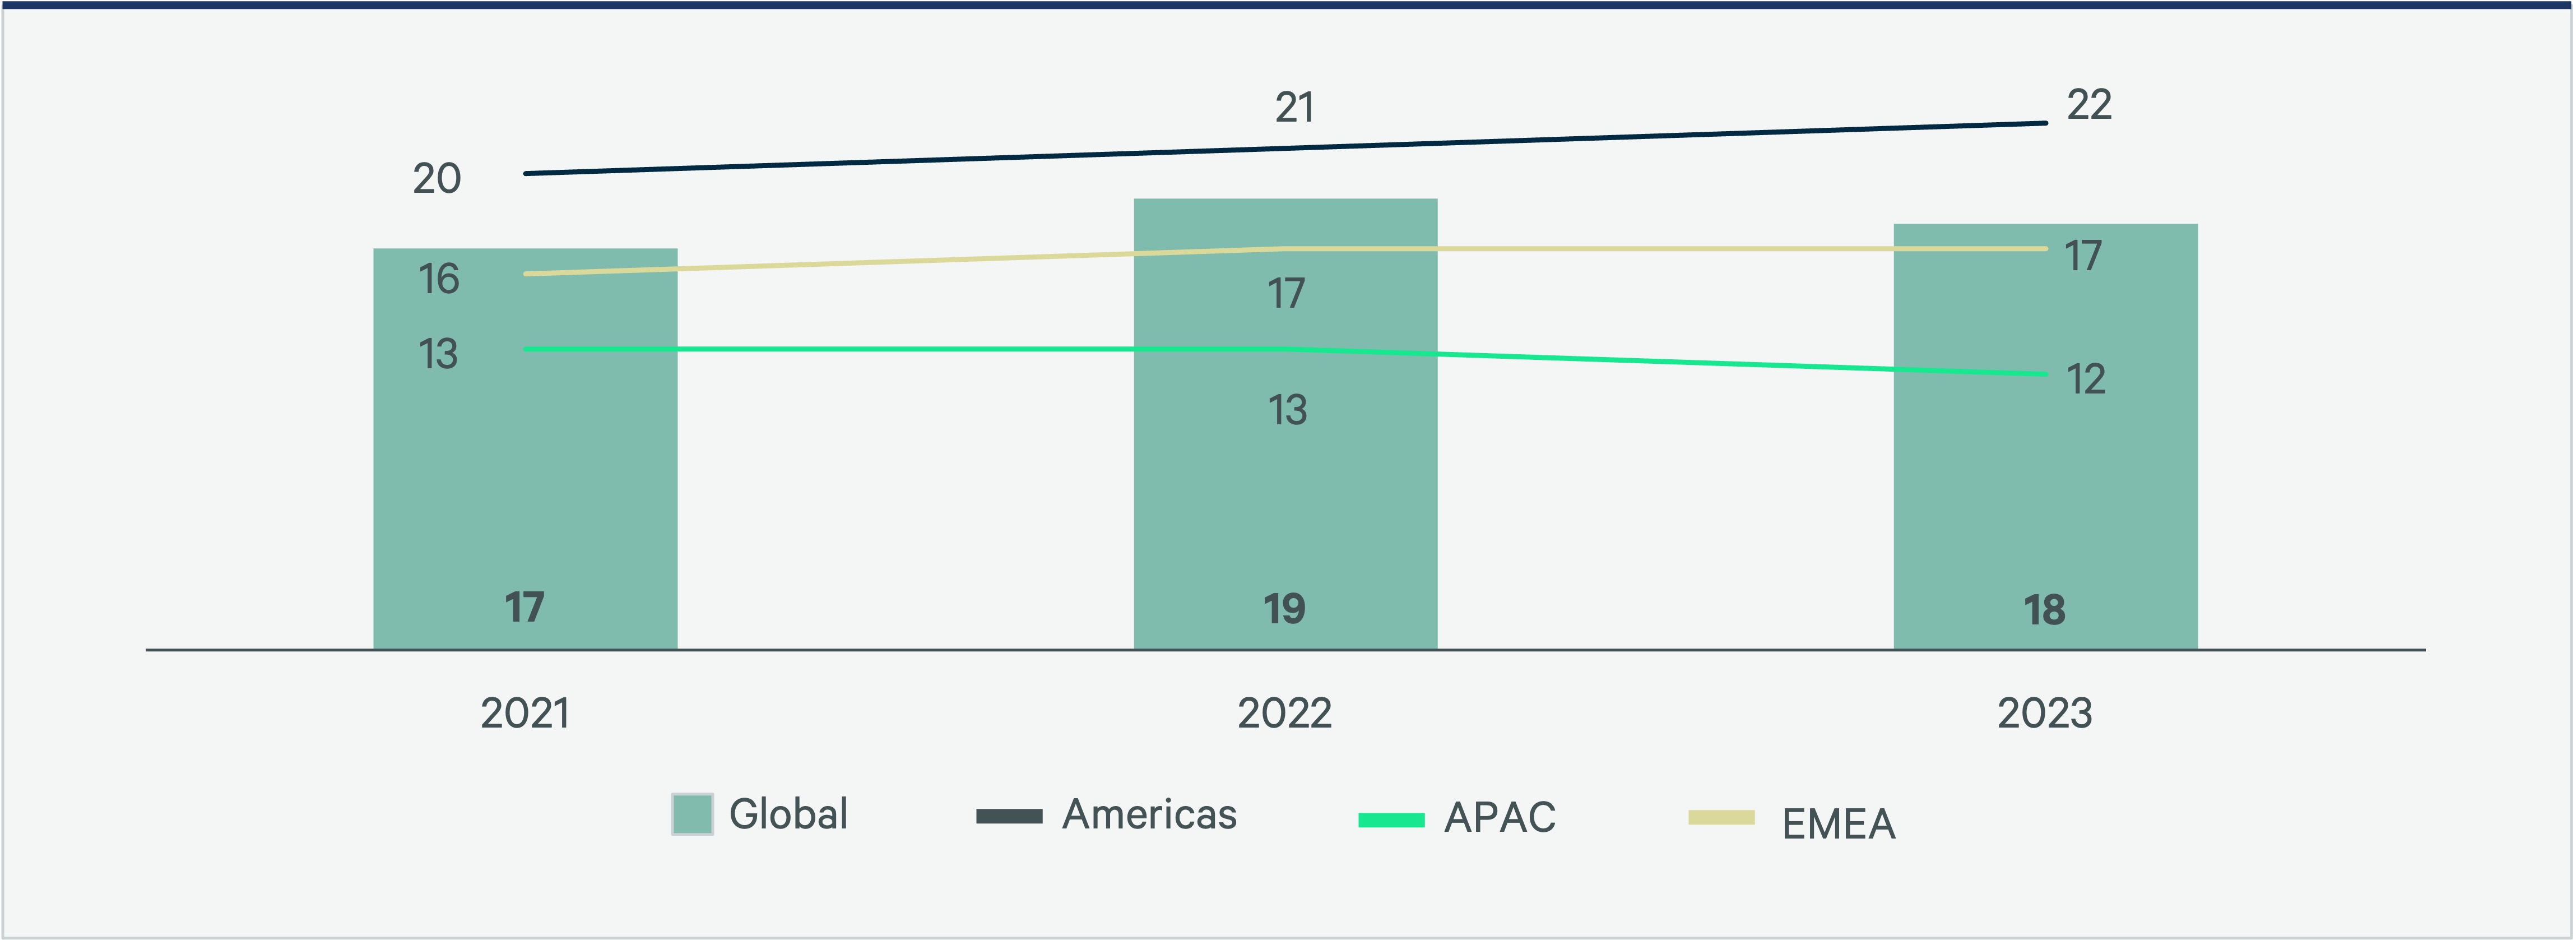
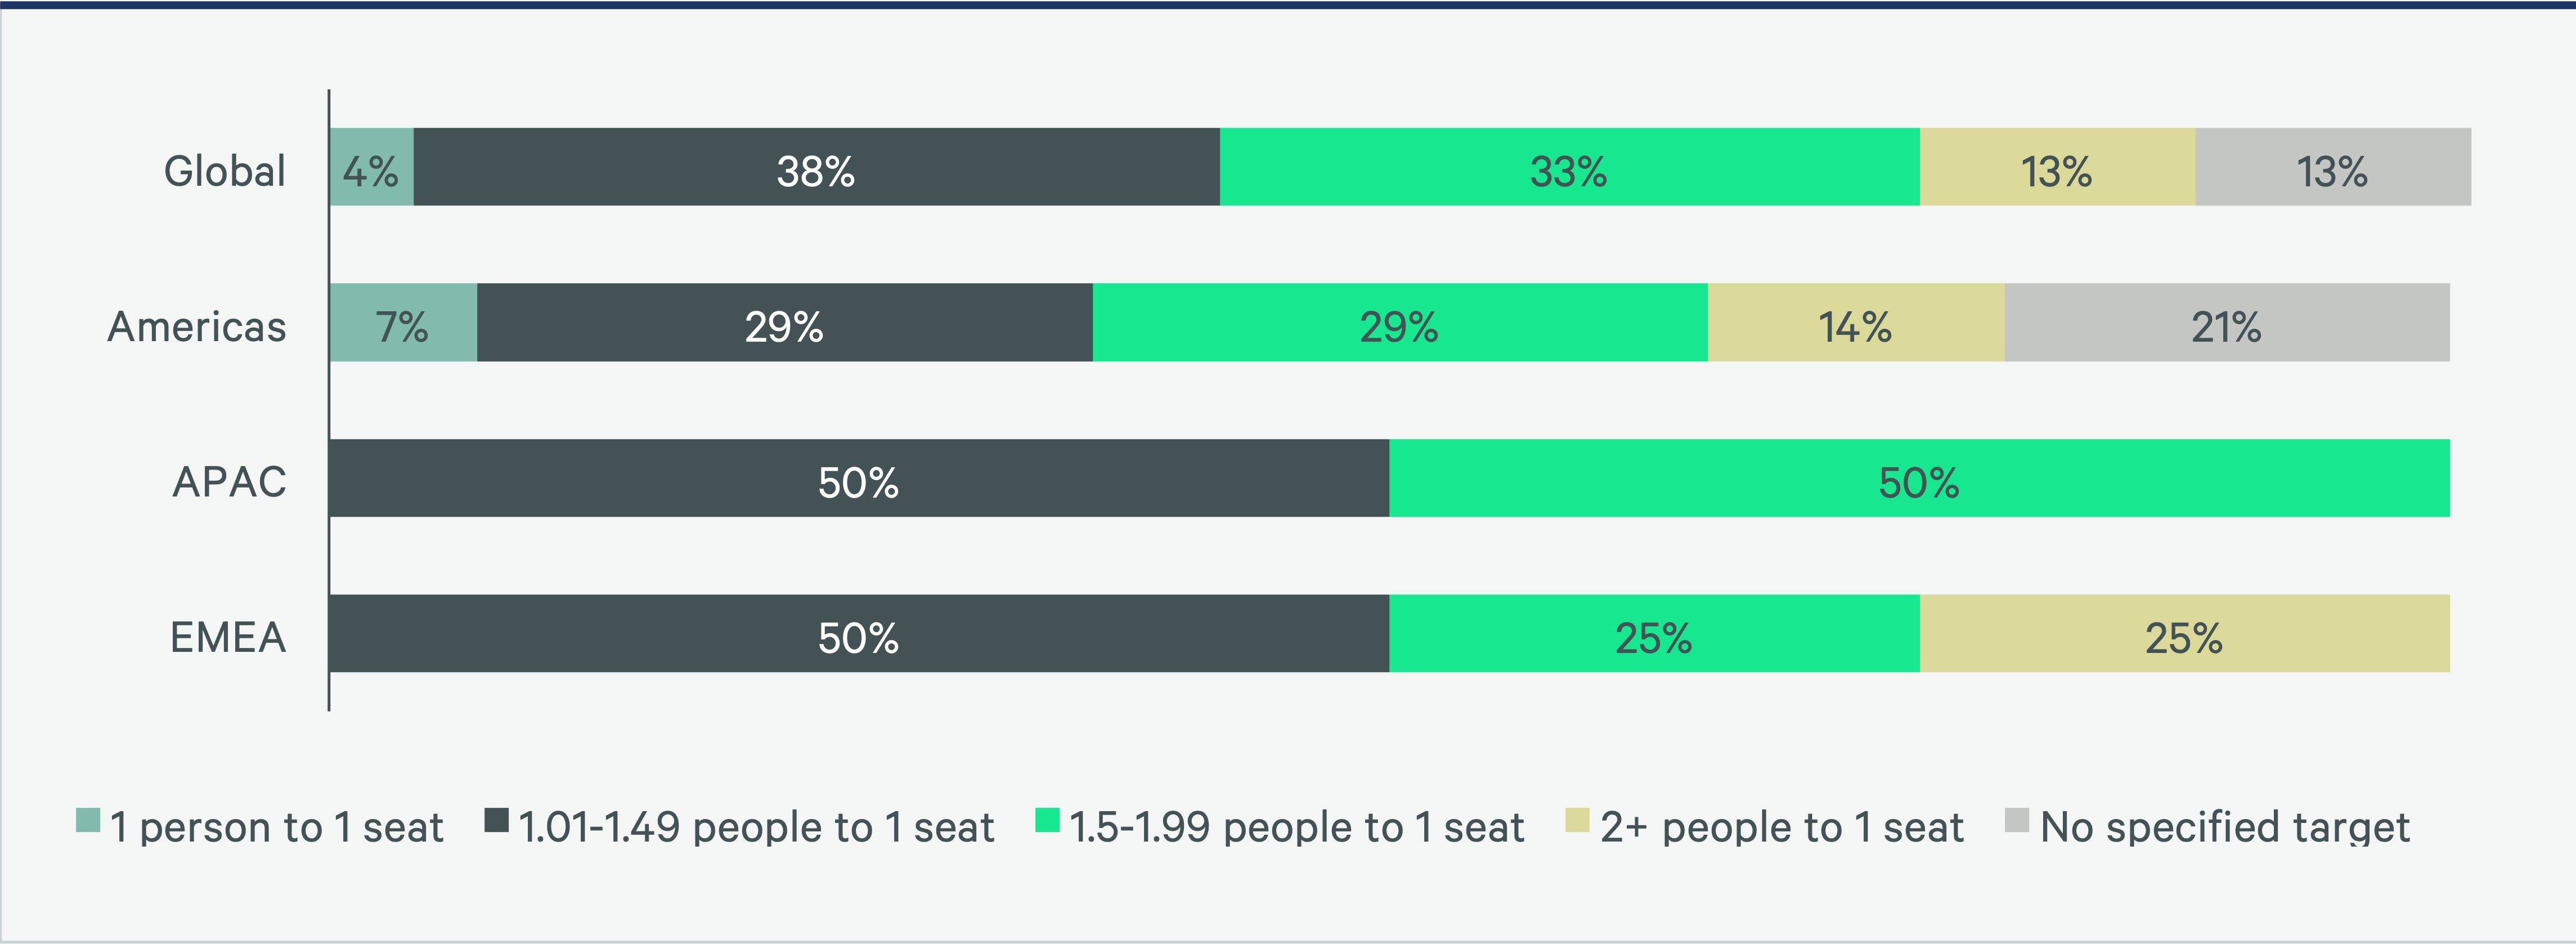
Figure 29G: 2023 Office Target Sharing Ratios
Office Space Composition
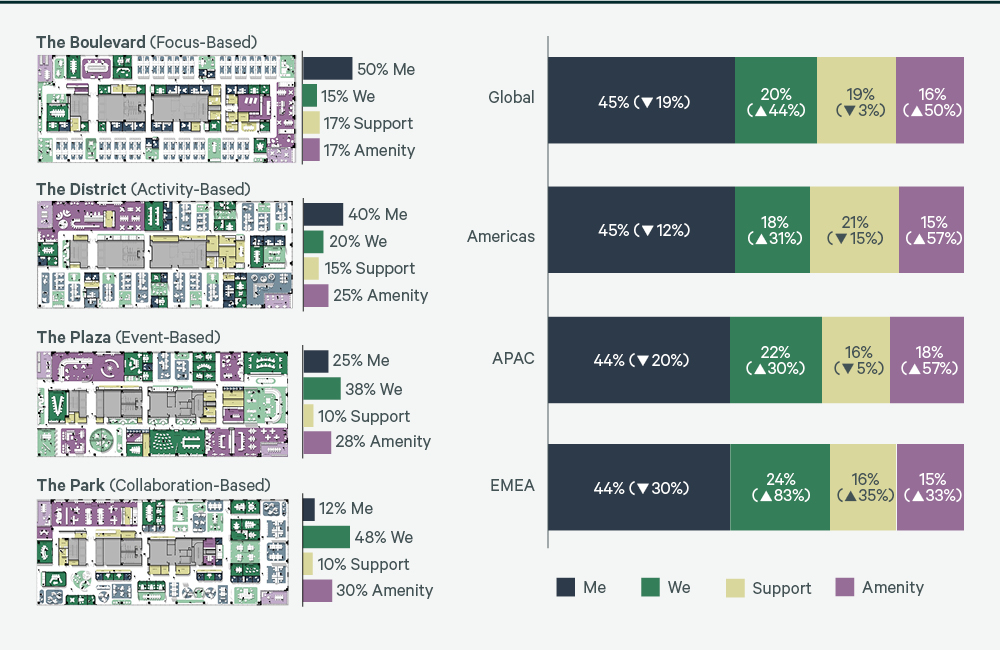
Americas: Since 2021, the Americas region has increased collaboration or “we” space by 30% while decreasing private or “me” space 12% to support hybrid work styles. As a result, we see the space composition in the Americas fall between CBRE’s recommendations for “focus-based” work and “activity- based” work but with an excess of support and deficit of amenity space. Compared to other regions, the Americas has less collaboration and more support space than both APAC and EMEA.
APAC: Asia-Pacific continues to have a slightly-lower-than-global-average proportion of Me space (44% vs. 45%), with this proportion decreasing by 20% from 2021 and now equal to EMEA. Compared to global averages, APAC saw a higher increase in amenity space, with the proportion of support space (16%) lower than the global average (19%).
EMEA: EMEA has seen the most change in spatial composition when compared with the other regions. Me space decreased by 30% and the amount of collaboration (+83%), support (+35%) and amenity space (+33%) all saw significant increases over the last 3 years reflecting the changes in the type of work people are performing in the office.
Figure 30: Office Space Composition Changes Since 2021
Sources of Utilization Data
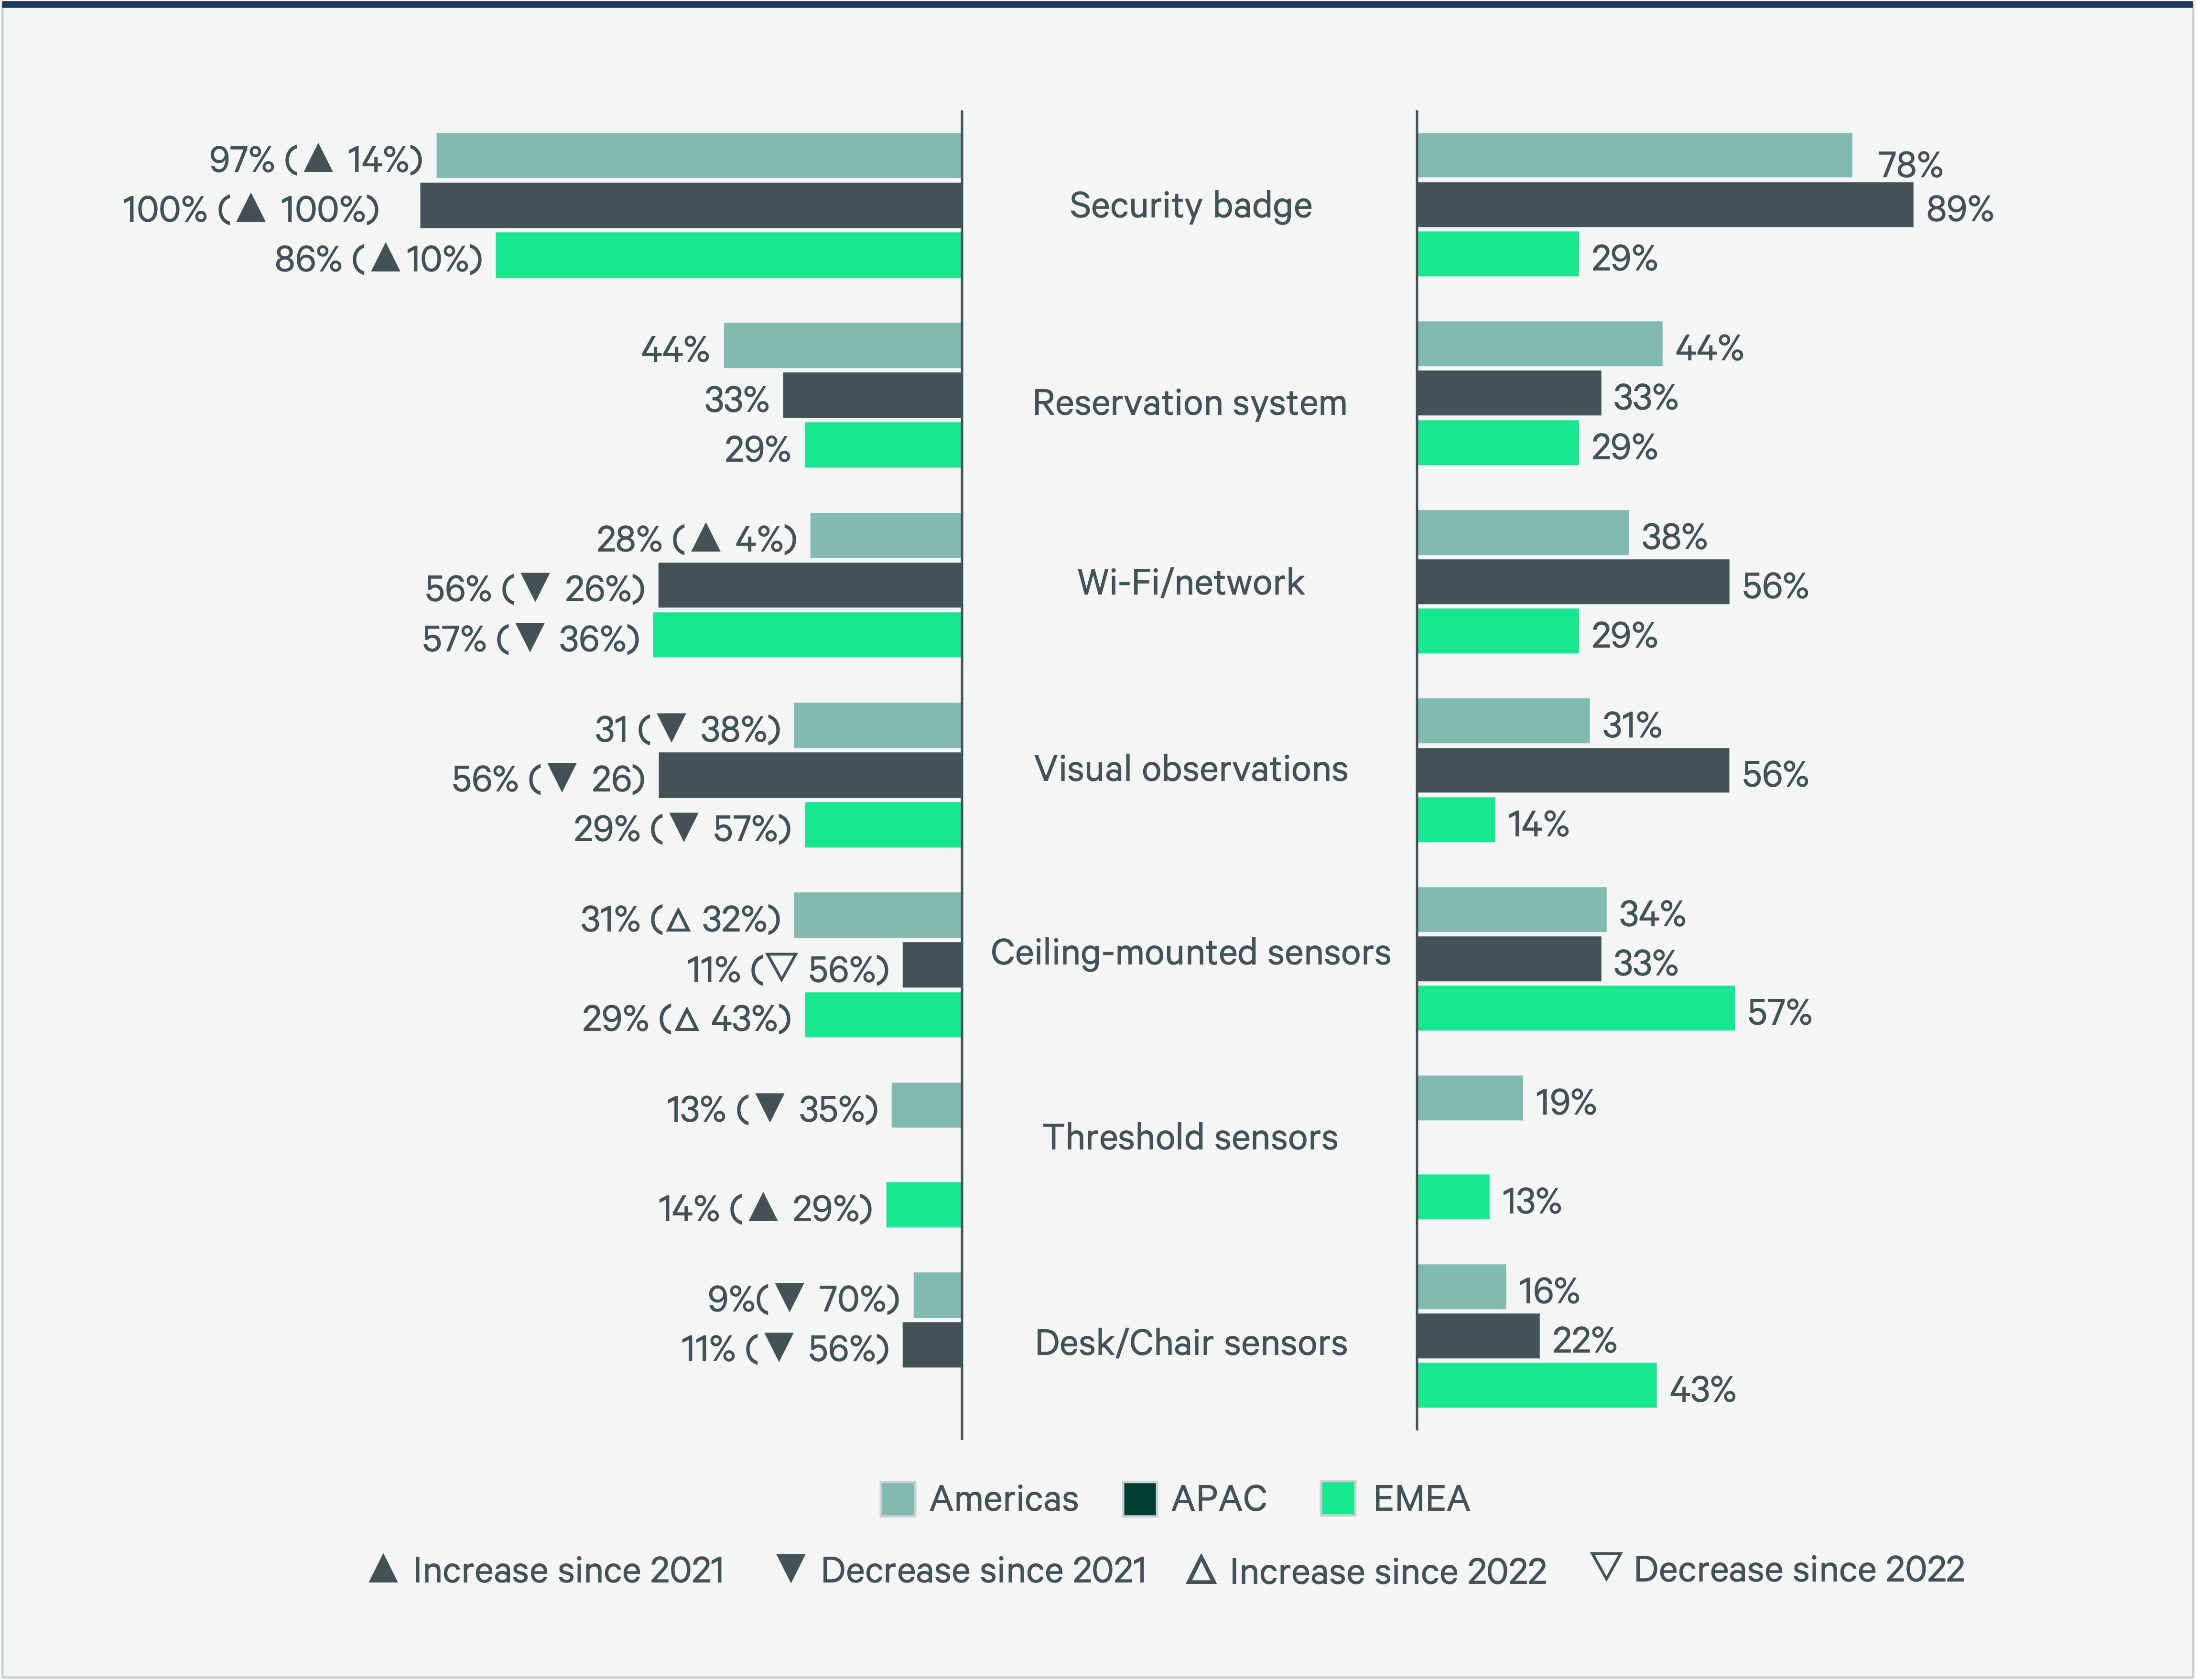
Americas: Although 97% of participants in the Americas use badge data to measure space utilization today, only 78% plan to use it in the future. Decreased use of visual observations and plans to increase the use of Wi-Fi/network and sensor data suggests that micro level utilization data is needed for further portfolio optimization, cost reduction and employee experience initiatives.
APAC: 100% of Asia-Pacific use security badge data to understand space utilization, with most also rely on data from Wi-Fi/network activity and visual observations. While this will remain fairly constant in the future, we expect to see a slight decrease in the use of badge data, balanced with an increase in the use of ceiling-mounted area sensors and desk/chair sensors.
EMEA: Organizations in EMEA plan to decrease the use of badge data by over 60% and increase the use of ceiling-mounted area sensors by 96% in the future. If these plans come to fruition, ceiling-mounted area sensors, desk/chair sensors, and Wi-Fi/network data will be the top three most used data sources in EMEA in the future, demonstrating a significant commitment to high quality, micro level space utilization data.
Figure 31: Sources of Utilization Data Now and in the Future
Hybrid Work
Americas: In 2023, 93% of workplace policies in the Americas offered some level of hybrid work, a 21% increase from 77% in 2021. The Americas region requires the least amount of time in office, with only 69% of organizations asking employees to be in the office for 2.5-4 days per week. 7% of respondents support remote work for 3 days or more per week, making the Americas the only region to do so.
APAC: Asia-Pacific has achieved the highest alignment of leader expectations to employee behaviors: 50%, vs global average of 19%. This may be because APAC also has the highest rate of tracking employee attendance (67%) and enforcing consequences for not following policy.
EMEA: EMEA has the highest proportion of participants (14%) not offering hybrid working to their employees with leaders choosing to prioritize in office work. 71% of participants in EMEA have a formal hybrid working program in place with manager discretion and job function being used to determine eligibility for hybrid or remote working. EMEA is the only region not to require employees to work in the office full time, reflecting a commitment to offering employees flexible work solutions.
Figure 32: Organizations with hybrid working programs, 2021-2023
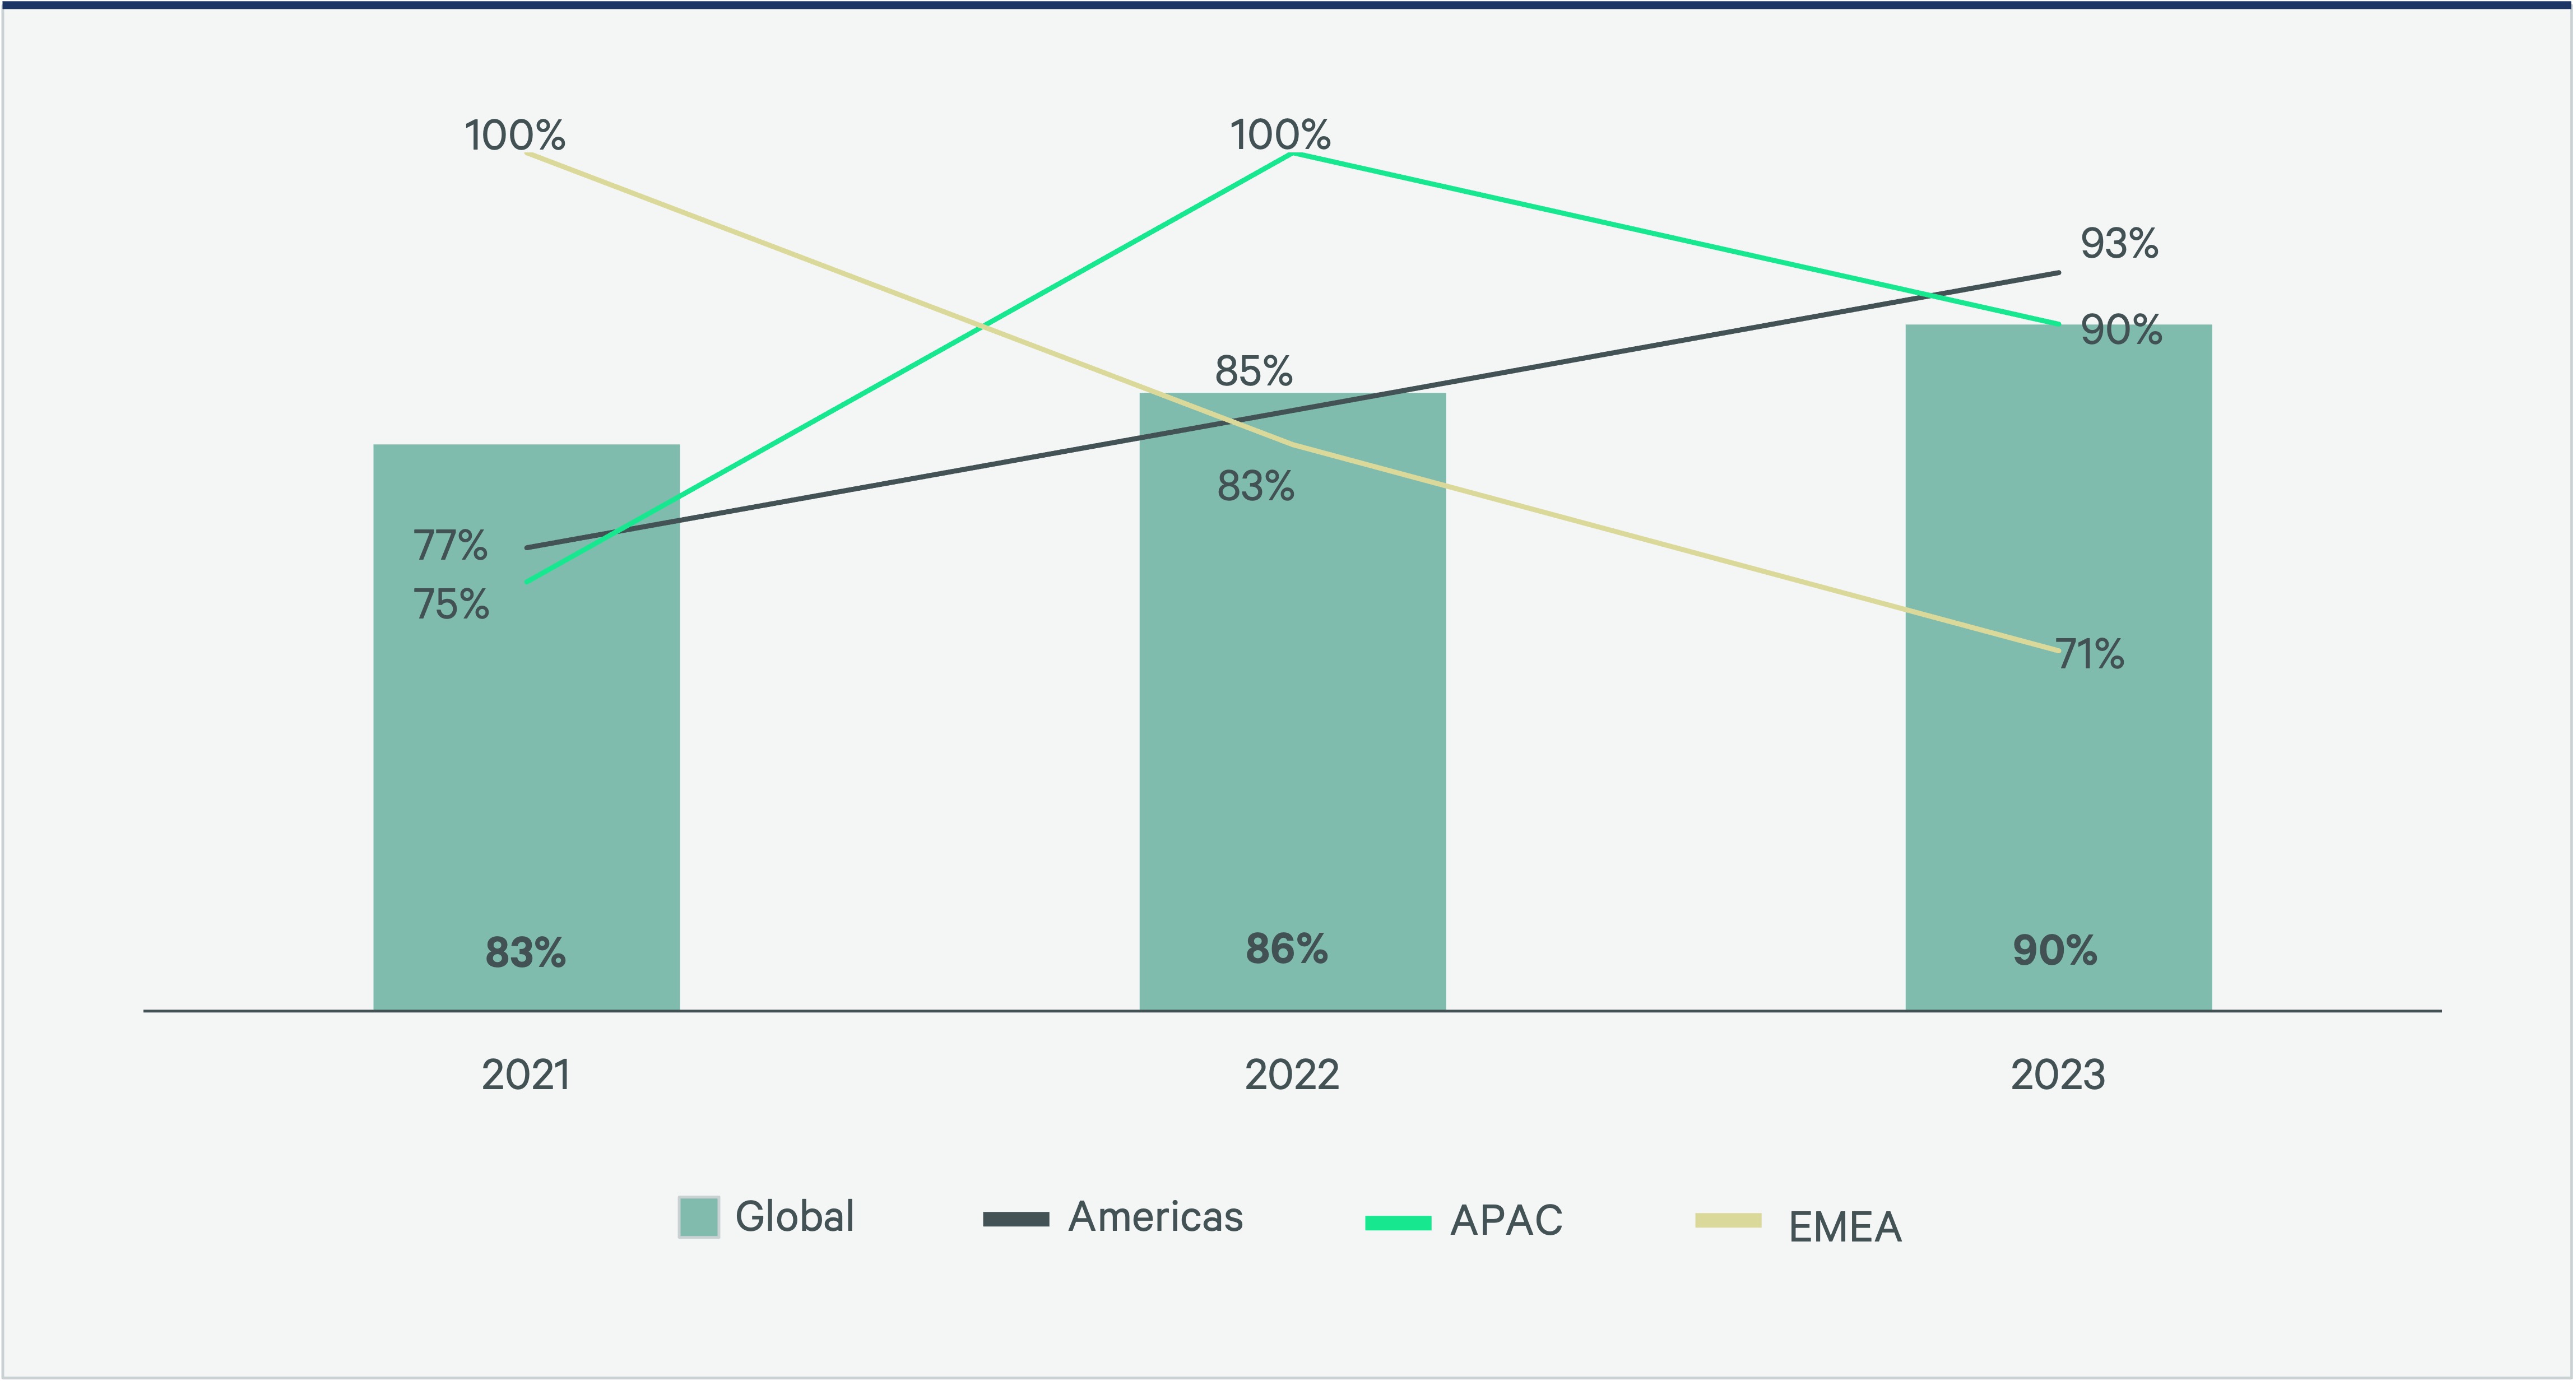
Figure 33: Which best describes the workplace policy that has been communicated?
Figure 34: If your hybrid policy requires employees work in the office, is employees’ office attendance tracked?
Figure 35: Are there are consequences for employees who do not follow hybrid policy requirements?
Figure 36: Are the hybrid work expectations of leaders and employee behaviors in sync?
Related Services
Leverage occupancy data to empower, anticipate and unlock opportunities within your portfolio.
- Plan, Lease & Occupy
Workplace Consulting
Build resilience, attract and retain talent, and foster connection and collaboration in your workplace.
- Transform Business Outcomes
Consulting
Gain comprehensive guidance on insightful, executable real estate strategies for both investors and occupiers.
- Plan, Lease & Occupy
Organizational Change & Transformation
Enabling organizations to achieve outcomes, improve performance and create change-ready cultures.
Related Insights
-

Q3 findings indicate that most companies now require some in-office work, and a company’s stated attendance policy may influence turnover rates and time to hire.
-
Brief | Creating Resilience
Three Office Occupancy Trends That Are Impacting Portfolio Strategy
September 1, 2023

CBRE’s 2023 Workplace & Occupancy Benchmarking Program has identified three trends across Occupancy Management clients.
-

The conventional narrative that knowledge workers are abandoning high-cost major U.S. markets is not the complete story.
-
Podcast | Adaptive Spaces
Where It’s At: Expert takes on creating the ideal office experience
June 27, 2023

Want a more engaged, productive workforce in the age of hybrid work? The key is rethinking the office with new design approaches, flexible space and an abundance of practical amenities. So say three workplace strategy experts—Industrious CEO Jamie Hodari and CBRE’s Lenny Beaudoin and John Stephens—in a discussion about the future of cities.
Authors
Susan Wasmund
Executive Managing Director, Americas Consulting | Global Occupancy Management