Creating Resilience
Three Office Occupancy Trends That Are Impacting Portfolio Strategy
Metrics That Matter From CBRE's 2023 Global Workplace & Occupancy Management Benchmarking Program
September 1, 2023 3 Minute Read

Office Occupancy Management Benchmarks Dashboard
Explore the office occupancy benchmarks that matter to our clients
CBRE’s 2023 Workplace & Occupancy Benchmarking Program has identified three trends across Occupancy Management clients:
- The rise of space sharing has increased global office occupancy rates (defined as the allocation of people to seats).
- This space planning efficiency has helped to enable a reduction in global office portfolios.
- Despite these efforts, average office utilization (defined as the number of people using the space) remained under 40% through the first half of 2023.
Since January 2020, space planning efficiencies have increased global office occupancy rates by approximately 20%, enabling the majority of benchmarking study participants to reduce their portfolio size by up to 30%. Despite these widespread reductions in portfolio size and higher occupancy rates, 64% of global office space remains underutilized. The operational and financial impacts of underutilized space remains a top concern for corporate real estate (CRE) leaders in 2023, illustrating the growing reliance on workplace performance metrics such as “utilization rate” over traditional occupancy planning metrics such as “occupancy rate.”
Figure 1: Portfolio Changes Since January 2020

Source: CBRE 2023 Workplace & Occupancy Benchmarking Program.
The difference between planning and performance metrics
Planning metrics measure how space is intended to be used, while performance metrics measure how space is actually used. Challenged by economic uncertainty and low office utilization, CRE leaders increasingly rely on performance metrics to drive portfolio rationalization and space optimization efforts.
Figure 2: Occupancy Metrics—Planning vs Performing
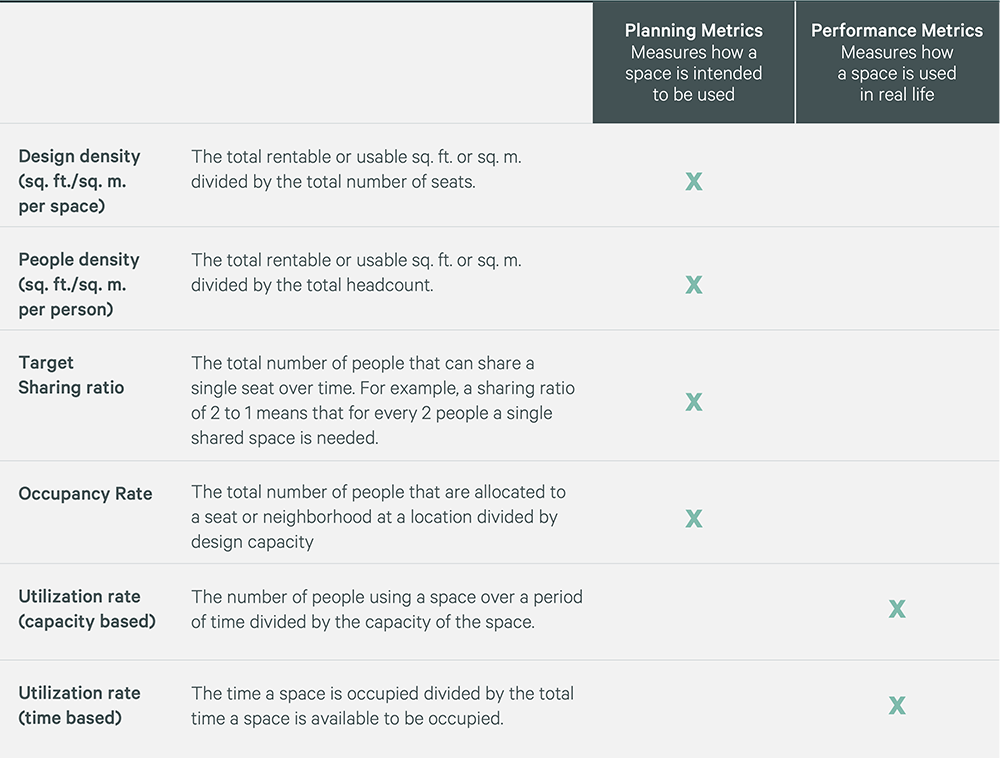
Source: CBRE Workplace & Occupancy Management.
Occupancy rates have increased in the past year, reflecting the rise of space sharing
From Q2 2022 to Q2 2023 the global average occupancy rate was 101% (81% Americas, 125% Asia-Pacific, and 111% EMEA) roughly a 29% increase over 2021 levels (+12% Americas, +37% Asia-Pacific, and +40% EMEA). Figure 3 illustrates how occupancy rates have changed since 2021 across specific business sectors.
Figure 3: Average Occupancy Rate by Sector
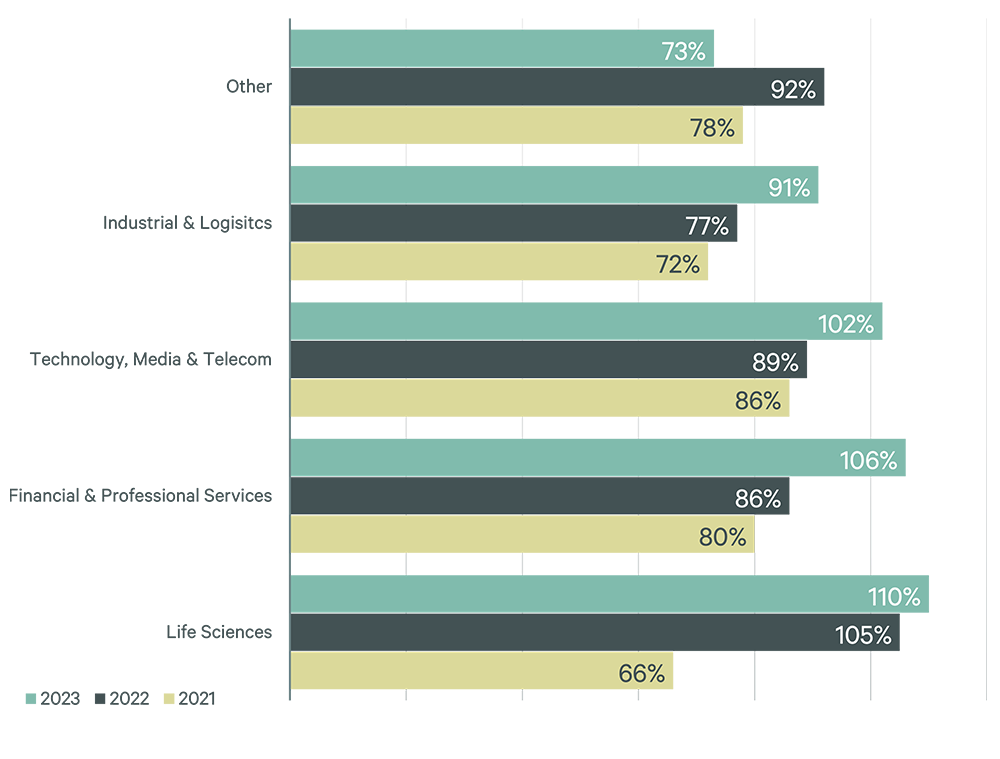
Source: CBRE 2023 Workplace & Occupancy Benchmarking Program.
Occupancy rates over 100% can be achieved when organizations allocate workspace at a sharing ratio greater than one person for every one workspace (1:1). This creates a more efficient occupancy plan that supports hybrid workstyles. Because occupancy rates measure the allocation—not actual usage—of space, occupancy rates are best used to measure portfolio- planning efficiency rather than portfolio performance.
Average office utilization remained under 40%
From Q2 2022 to Q2 2023, global average office utilization was 35% (31% Americas, 40% Asia-Pacific, and 36% EMEA), which is a 45% decrease from the pre-pandemic global average of 64%. Figure 4 illustrates how average global utilization varied across business sectors during that time.
Figure 4: Average Utilization Rate by Sector (Q2 2022-Q2 2023)

Source: CBRE 2023 Workplace & Occupancy Benchmarking Program.
To increase space utilization rates, companies should further focus on portfolio right-sizing to repurpose underutilized space and employee experience initiatives to attract employees to the office .
Explore these Occupancy Metrics and more in CBRE’s new Office Occupancy Management Benchmarks dashboard.
Contacts
Susan Wasmund
Executive Managing Director, Americas Consulting | Global Occupancy Management

Related Insights
-

The 2023-2024 Global Workplace & Occupancy Insights report summarizes three years of office benchmarking and client sentiment surveys to identify how CBRE clients are creating efficient portfolios and effective work experiences in the wake of the pandemic.
Related Service
Leverage occupancy data to empower, anticipate and unlock opportunities within your portfolio.