Chapter 3
Rebalancing Space Supply & Demand
2023–2024 CBRE Global Workplace & Occupancy Insights
7 Minute Read
Hybrid Work Has Changed the Demand for Office Space
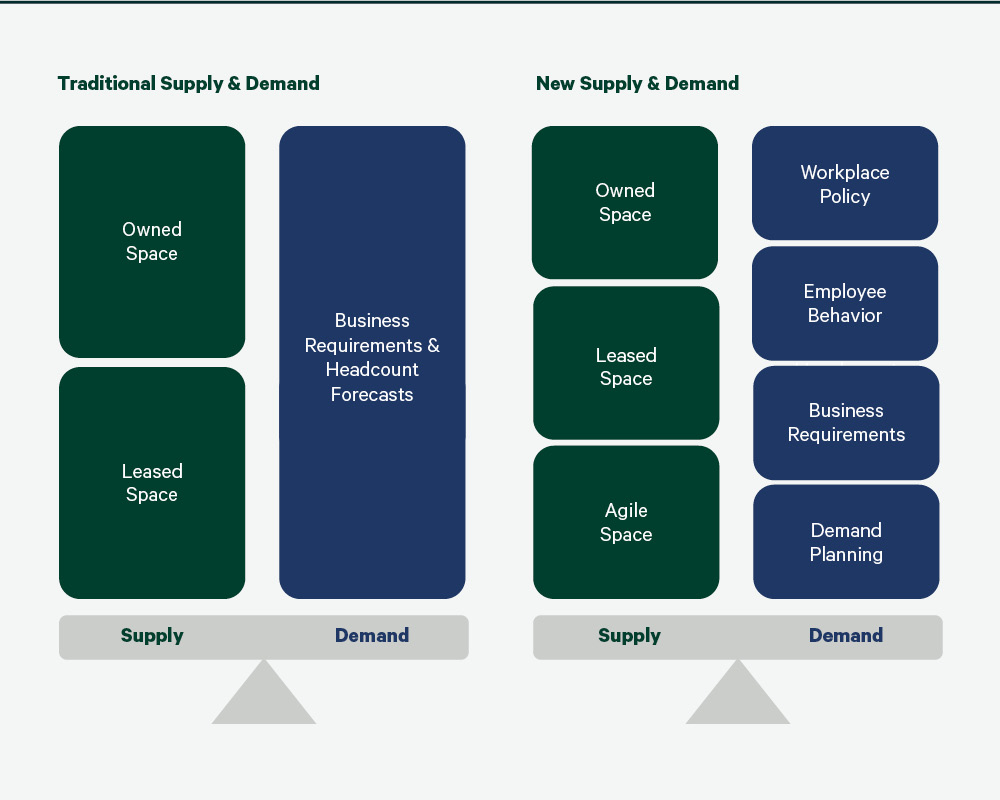
In 2023, only 6% of organizations asked their employees to be in the office full time. Widespread adoption of hybrid work led to a 30% increase in space-sharing since 2021. This means that today’s demand for office space is no longer driven by headcount but by a combination of business requirements, workplace policy and employee behaviors, which can be understood by examining office attendance and space-use patterns.
Figure 6: The new demand for space
Occupancy Strategy Terms
Office Attendance: The total number of employees who visit the office in a given time period
Office Show-up Rate: A method of understanding the demand for space based on employee attendance patterns. Calculated by dividing the office attendance (OA) by the total headcount of the office
Office Utilization Rate: A method of comparing space demand and supply to determine if space is being used effectively. Calculated by dividing the office attendance by the capacity of the office
Office attendance data helps organizations understand their demand for space, while space utilization data measures how effectively the space supports that demand.
Many organizations are using pre-COVID office space for a post-pandemic workforce. Until they repurpose or rightsize old offices to support new work styles, they’ll continue to struggle with low office utilization.

Low Office Utilization Exposes an Imbalance of Space Supply & Demand
From Q2 2022 to Q2 2023, global average office utilization, which measures the actual use of space, was 35% (31% Americas, 40% Asia-Pacific, and 36% EMEA), a 45% decrease from the pre-pandemic global average of 64%. Low pre-pandemic office space utilization has been exacerbated by hybrid work, creating an excess of underutilized space in office portfolios.
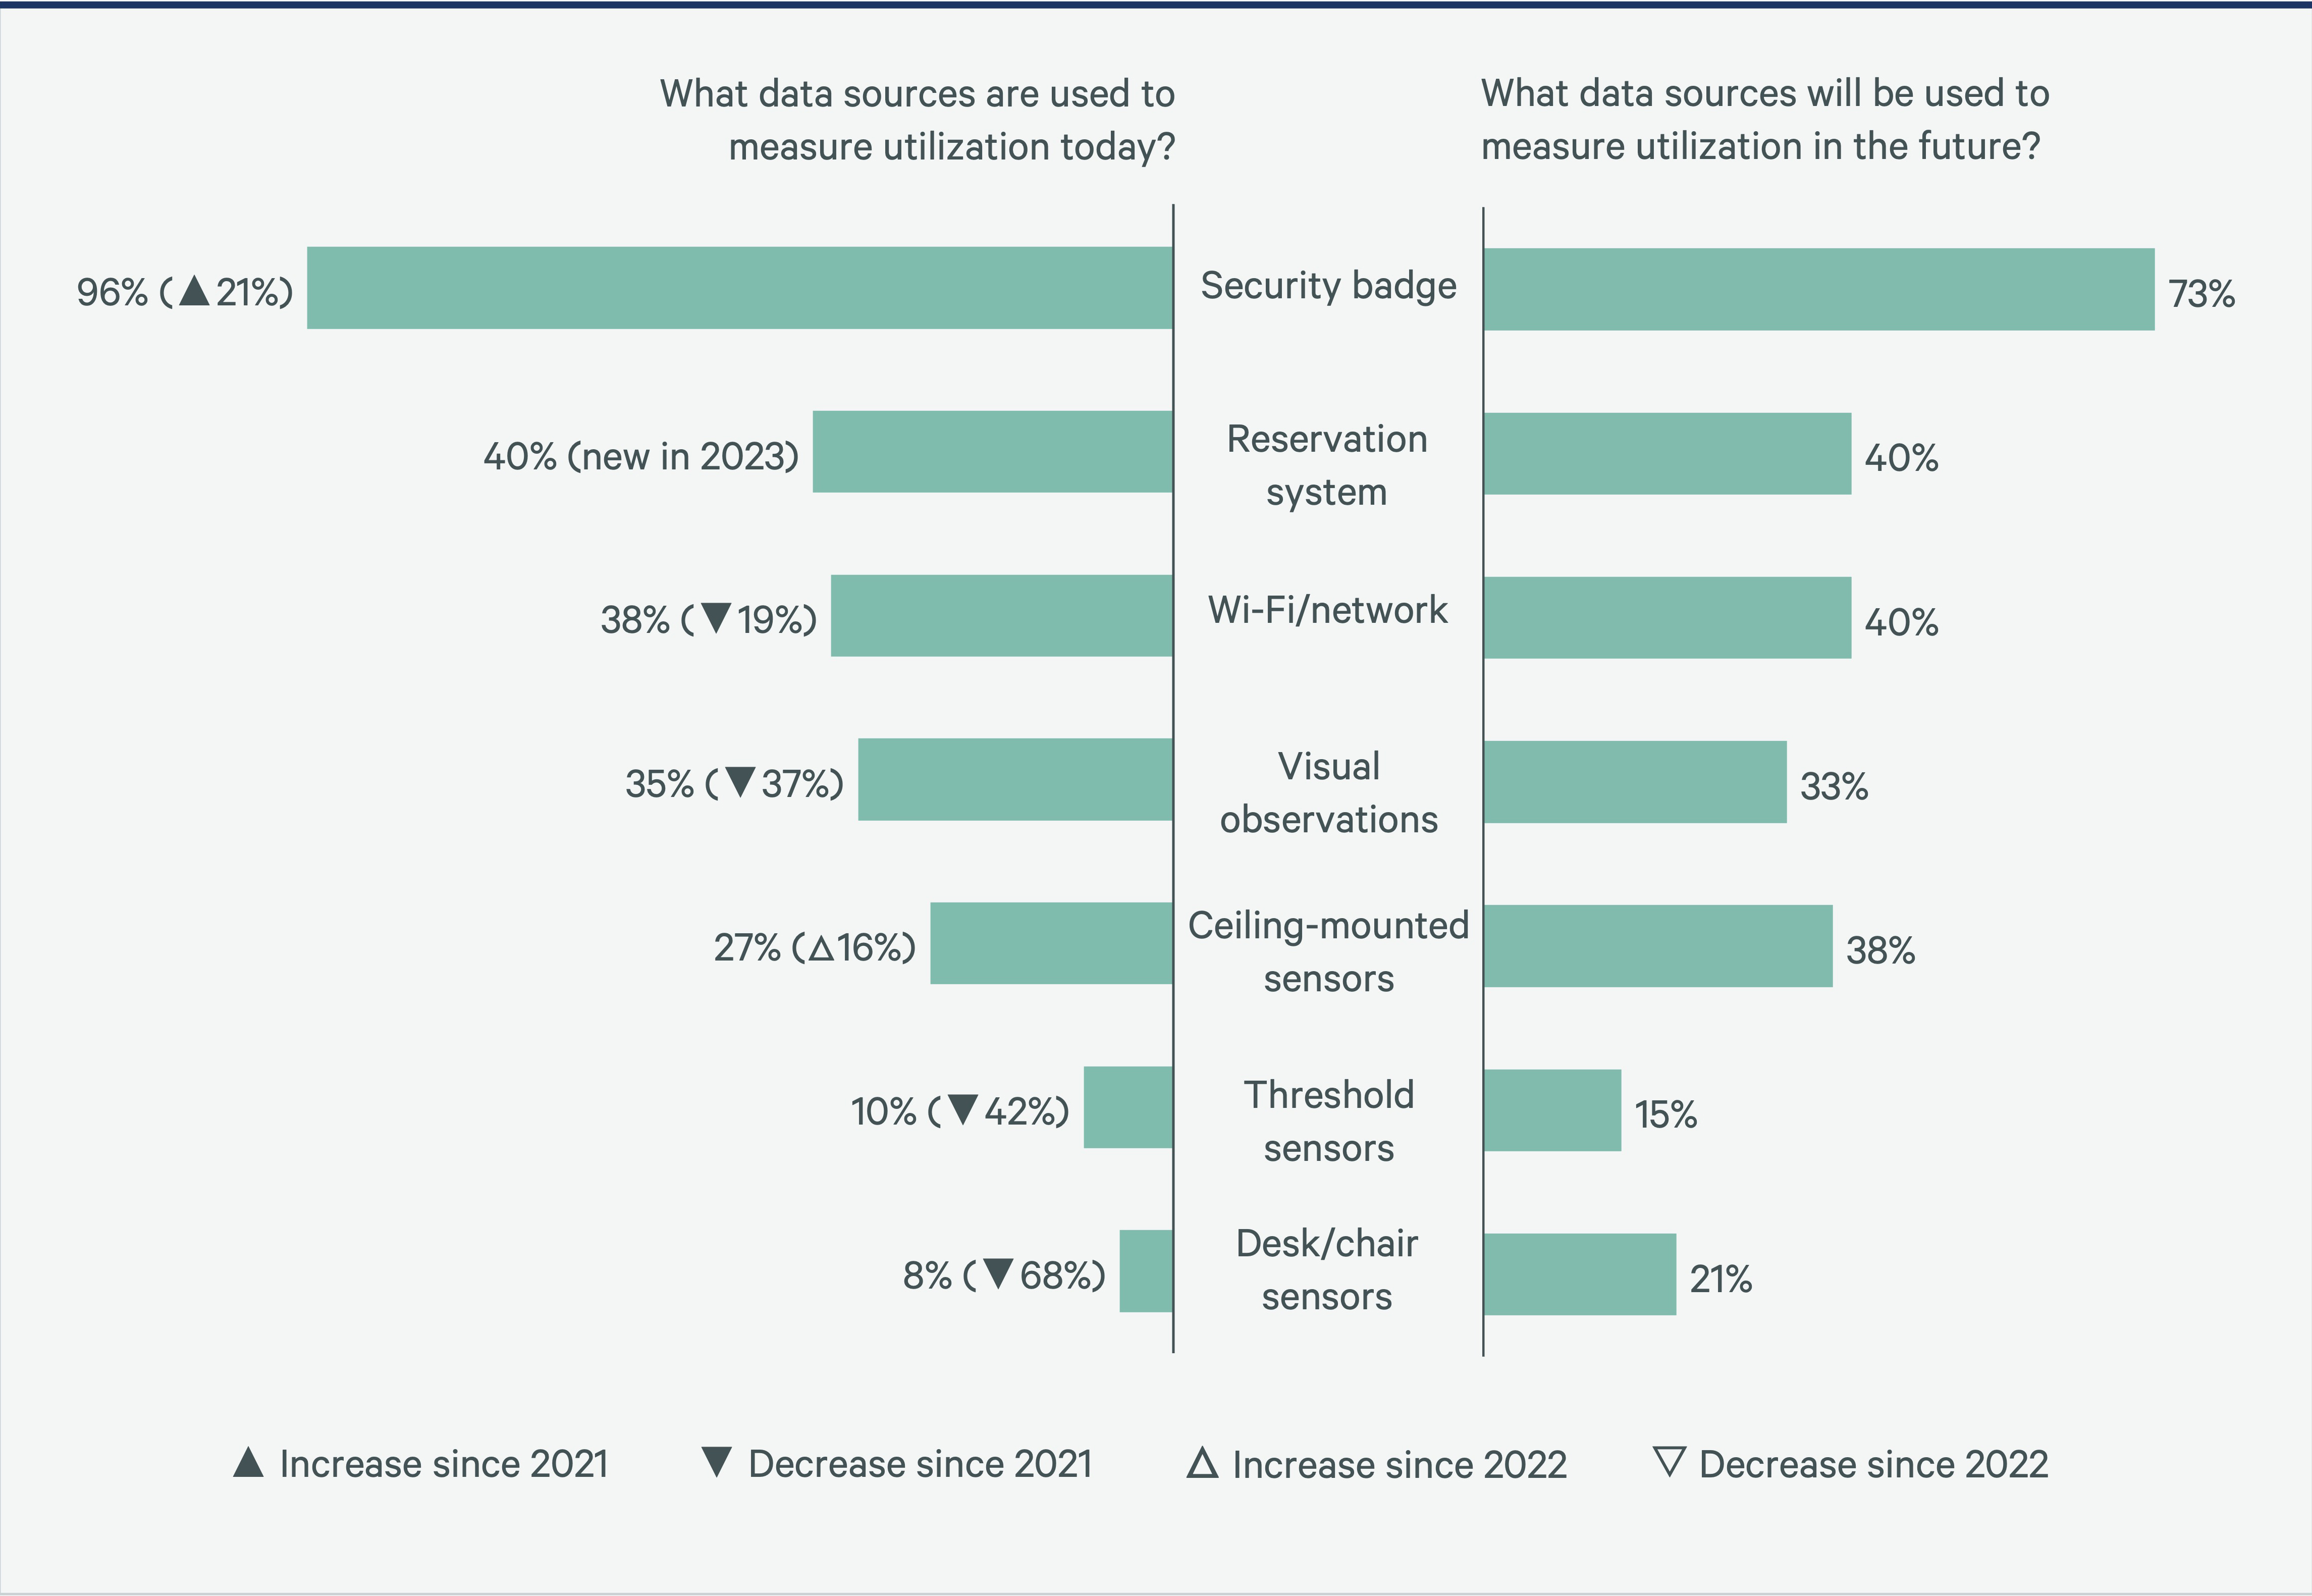
The operational and financial impacts of underutilized space remain a top concern for CRE leaders, prompting many organizations to implement or expand utilization management solutions. Of the 81% who measure space utilization, 96% use badge swipe data, a 21% increase since 2021. Decreased use of Wi-Fi network data (down 19% since 2021) and threshold and desk/chair sensors (down 42% and 68% respectively since 2021) suggests badge data has been sufficient for many organizations. However, plans to increase the use of Wi-Fi/network data and ceiling-mounted area sensors indicate a need for more detailed, higher-quality data to support portfolio optimization and workplace experience goals.
Figure 7: Average office utilization rates from Q2 2022-Q2 2023
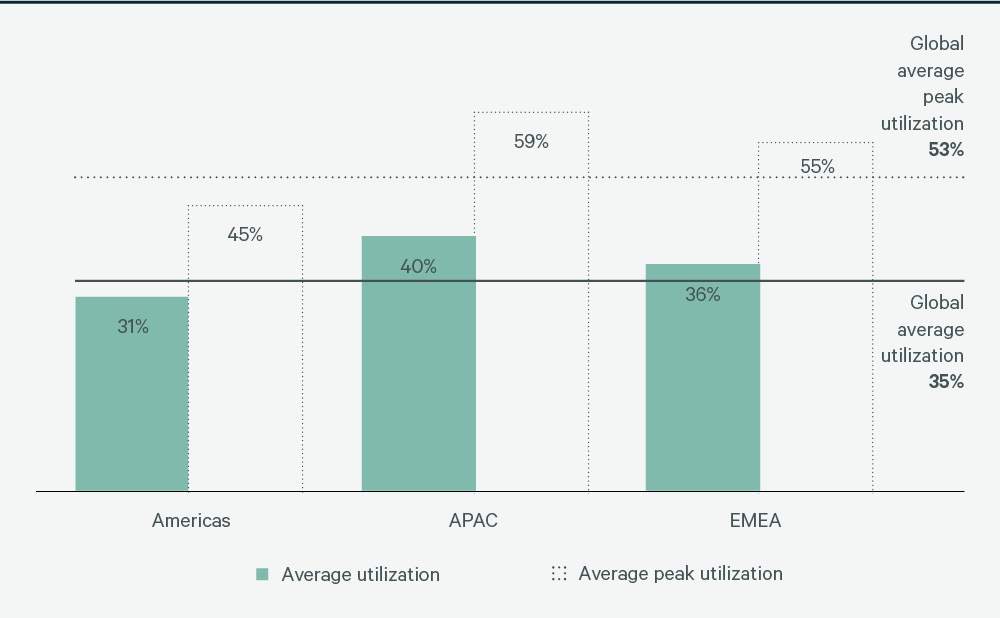
Figure 8: Sources of utilization data now and in the future
Rebalancing the Supply & Demand of Space
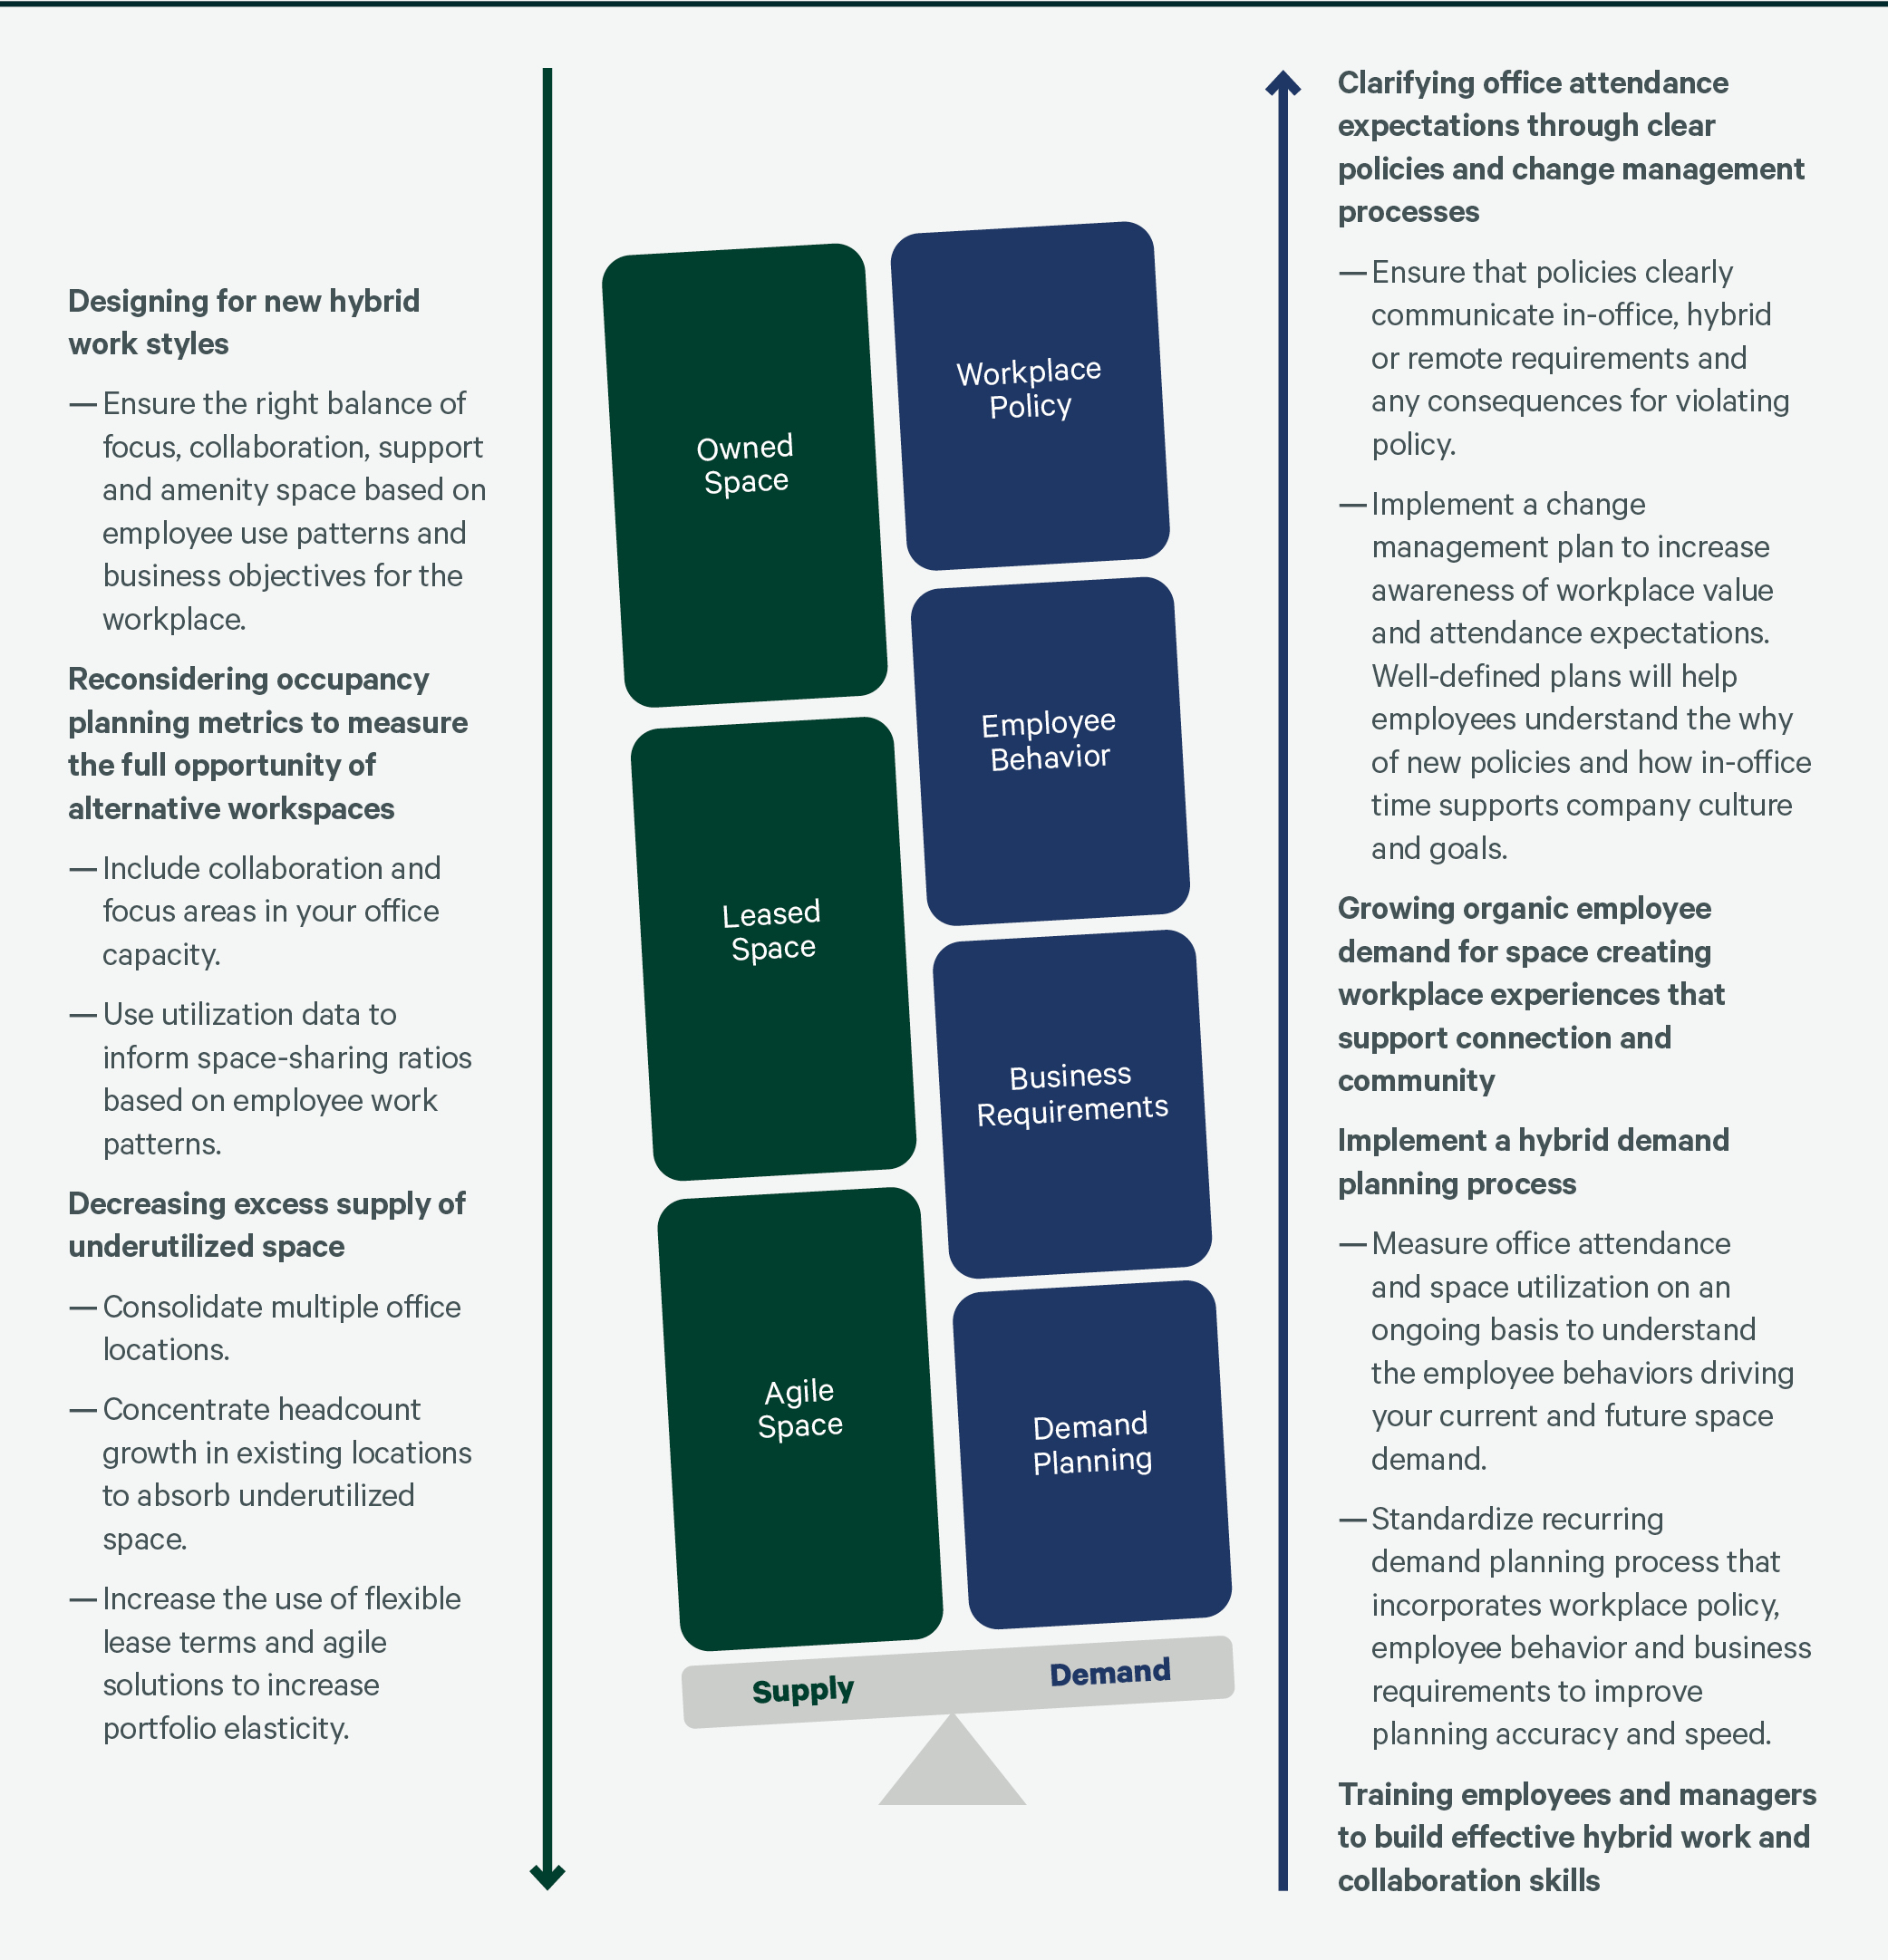
Organizations have three options for rebalancing space supply and demand. They can focus on increasing the demand for space, decreasing the supply of space or optimizing the portfolio by doing both.
Figure 9: Space supply & demand imbalance
Clarify Office Attendance Expectations, but Use Mandates With Caution
Workplace policies range from providing guidance for time in office to explicitly mandating office attendance. Policies that require employees to spend a specific amount of time in the office provide clear guidance on what is expected, but many organizations avoid these mandates to maintain employees’ sense of empowerment and trust in leadership.
While mandating office attendance provides an enforceable policy, organizations must consider their appetite for acting on those policies and how those choices may impact long-term relationships with employees, their public brand identity and overall corporate culture.
In 2023, 60% of participants are tracking employees’ office attendance but only 4% consistently enforce consequences for not following policy. Organizations with large portfolios (more than 12 million sq. ft./1.1 million sq. m.) are most likely to track in-office attendance. Organizations that track attendance are most likely to use badge or space reservation data. Unlike measuring space utilization, which typically uses anonymous data, tracking employees’ office attendance is not anonymous. Depending on the data collected, tracking individual employees’ attendance may violate many regional identity and privacy protection laws such as Europe’s General Data Protection Regulation. Grouping attendance data by teams of more than five employees is usually sufficient for the data to be used.
Figure 10: If your hybrid program requires employees to work in the office, is employees’ office attendance tracked?
Figure 11: Are there consequences for employees who do not follow hybrid policy requirements?
In 2023, 60% are tracking employee attendance but only 4% consistently enforce consequences for not following policy
Grow Organic Demand for Space by Improving the Workplace Experience
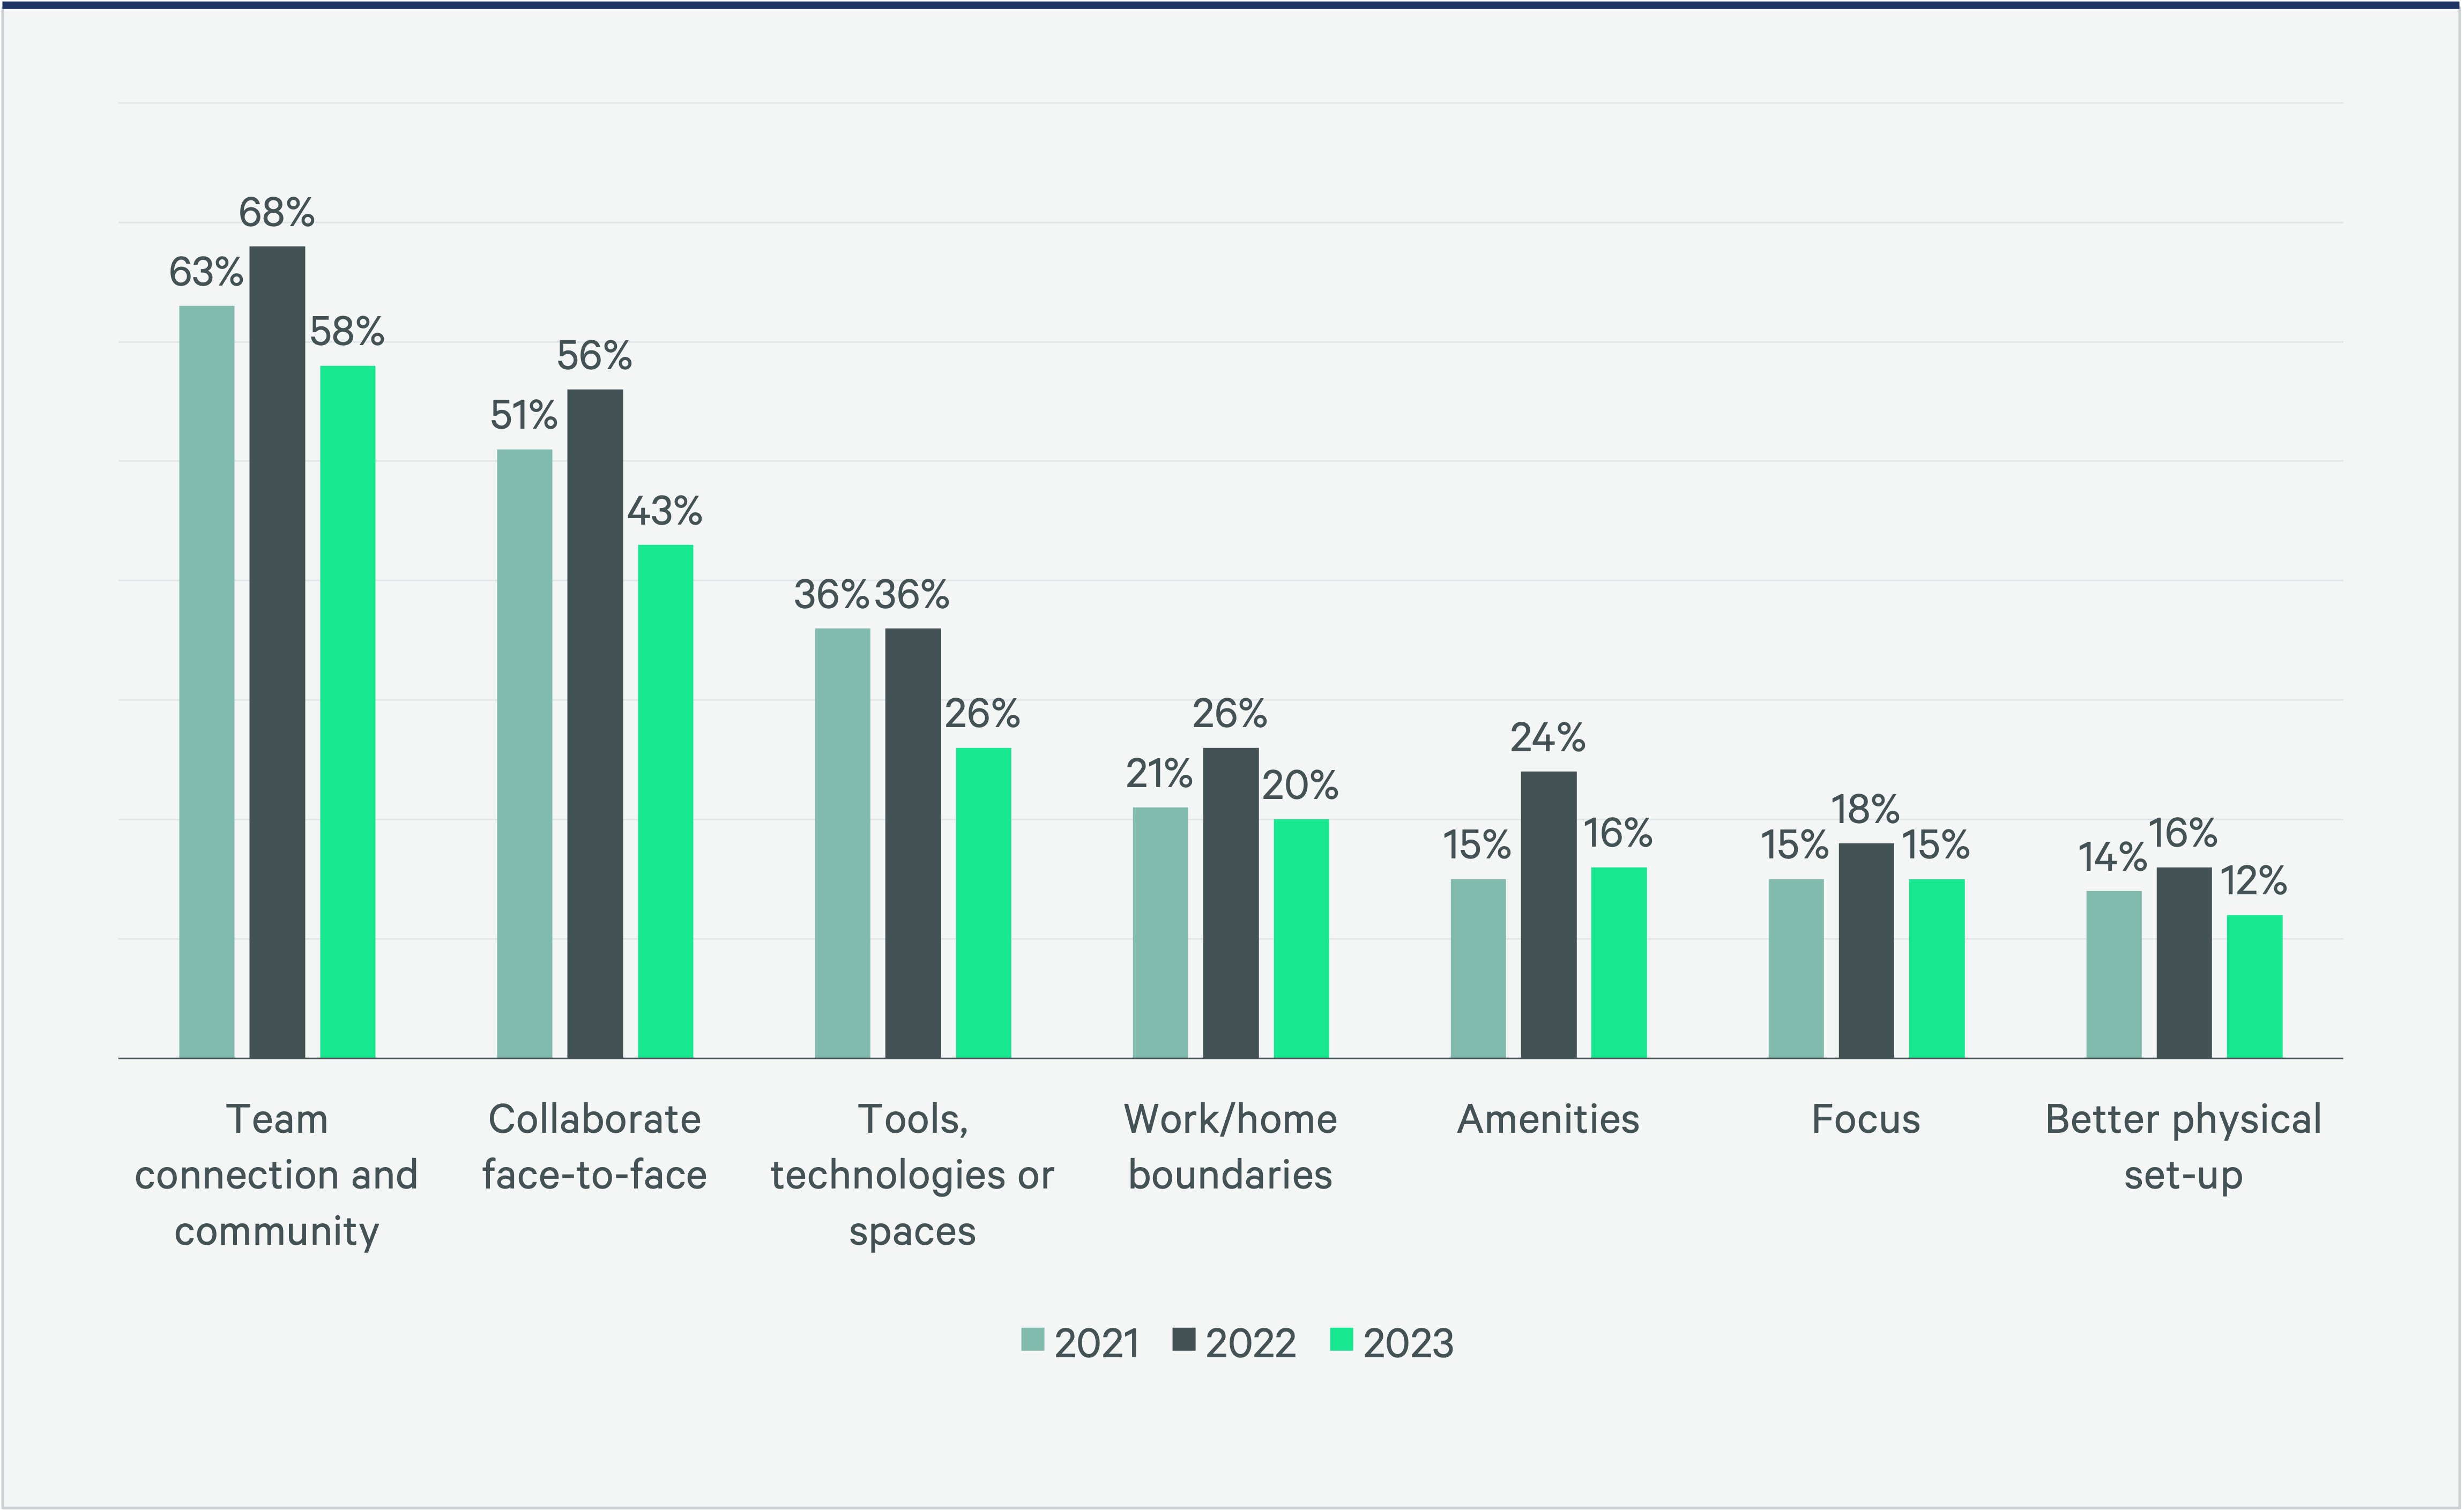
Since 2021, CBRE U.S. Workplace Sentiment surveys have found that most employees who want to go to the office do so for connection and community (although these results cannot be extrapolated to Asia-Pacific and EMEA employees). More specifically, these surveys proved that U.S. employees rely on the office for three things:
- Building relationships with newly formed teams or colleagues
- Meetings with leaders or mentors
- Participating in work events
Figure 12: What are the primary reasons you would come into the office?
Building Relationships With Newly Formed Teams or Colleagues
Over the past three years, many clients have attributed the success of remote working to the relationships built and maintained when predominately working from the office. Face-to-face interactions are critical to onboarding new employees, familiarizing them with organizational culture and building trust. In the 2023 sentiment survey, participants cited "new employee integration meetings" as the most important reason to work in the office.
Figure 13: Considering your professional development, how important is it to be in the office for the following reasons?
Employees hired during the pandemic or shortly thereafter benefit from an intentional re-onboarding program.
These employees were unable to be onboarded in the office environment when they first joined, and because they weren’t expected to be in the office for such a long period after their hire, many view themselves as remote-first employees, regardless of the organization’s policy. A re-onboarding program reintroduces these workers to the organization and connects them to the workplace, colleagues and company norms and expectations.
Leadership Interaction
In addition to a preference for working with new colleagues face-to-face, employees prefer in-person attendance at meetings with leaders or mentors. Knowing that employees value the opportunity to interact with leaders, many organizations have implemented policies to encourage leader attendance in the office. By creating an environment where senior employees lead by example, organizations are hoping to incentivize individuals to come into the office more frequently.
Figure 14: How important is the office for meetings with the following participants?
Creating drive-by leadership interaction opportunities has proved to be a powerful draw for many companies striving to encourage employees to come back into the office.
Leaders rotate working from open spaces in the office, such as a lounge or café area. This allows for more personal and casual interactions between leaders and teams. This approach has an added bonus of creating awareness of the diversity of space types in the office, helping draw employees away from desks and conference rooms and into areas where they can mix and collaborate.
In-Office Events
As large in-office gatherings return, organizations want to spend resources wisely on events that employees truly value. Increased hybrid work has led to employees forming new habits and placing less priority on attending every company event. Respondents to the 2023 sentiment survey indicated that they are more likely to attend events occurring in the office during typical work hours. This includes work-related or personal celebrations, team lunches and townhalls. More informal events that take place outside the office were a lower priority for participants.
Figure 15: How important is the office for the following social opportunities?
Affinity groups or Employee Resource Groups in an organization typically have high participation rates.
Partnering with these groups to conduct in-office events can provide a double benefit for in-office participation. Further, these groups are often active in social channels such as Slack, Yammer, or others across the organization and can help create buzz around events that translates into higher participation and recognition.
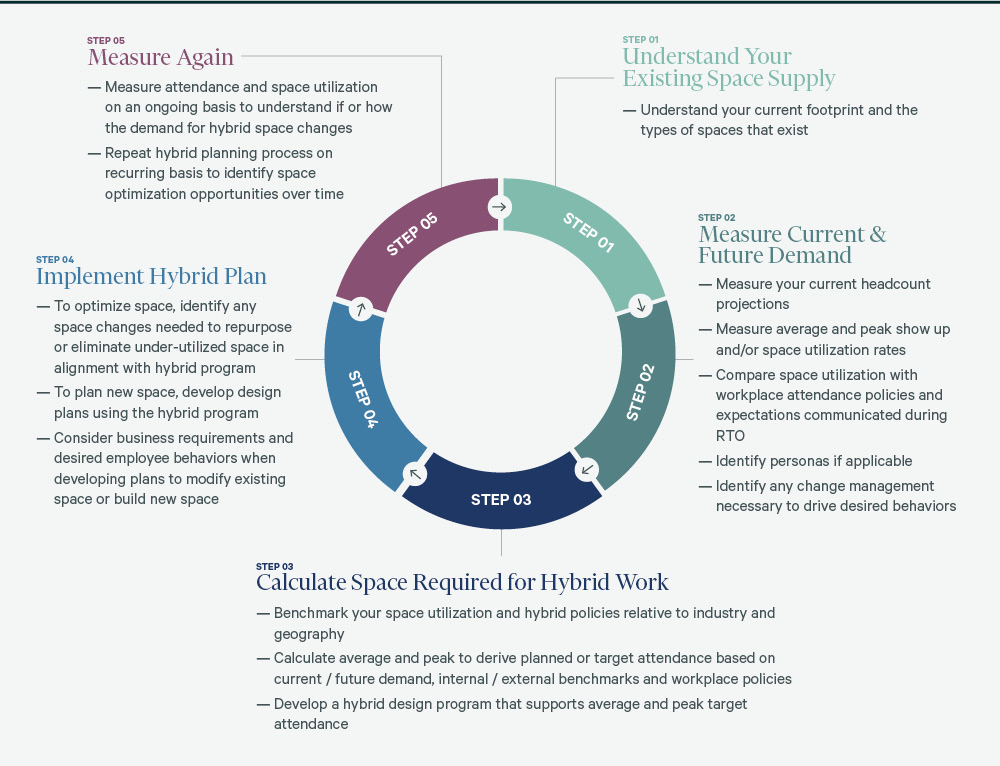
Implement a Hybrid Demand Planning Process
Portfolio optimization ensures the workplace design effectively supports the company’s goals in the most efficient way possible. While optimization will increase the overall value the workplace provides, it will not always result in immediate cost savings since space consolidations, design improvements and technology investments are often needed to create the desired workplace experience.
To optimize the real estate portfolio, organizations must have a consistent, recurring process for modeling and responding to constant changes to space supply and demand. This process starts with a deep understanding of the current portfolio as well as employee behaviors, workplace policies, business requirements and headcount projections. This data can then be used to calculate the space required for the hybrid work patterns of current and future employees.
Once space needs are understood, scenario plans can be developed to calculate the cost and benefits of change.
Figure 16: Hybrid demand planning process
The top 3 amenities that attract employees to the office around the world
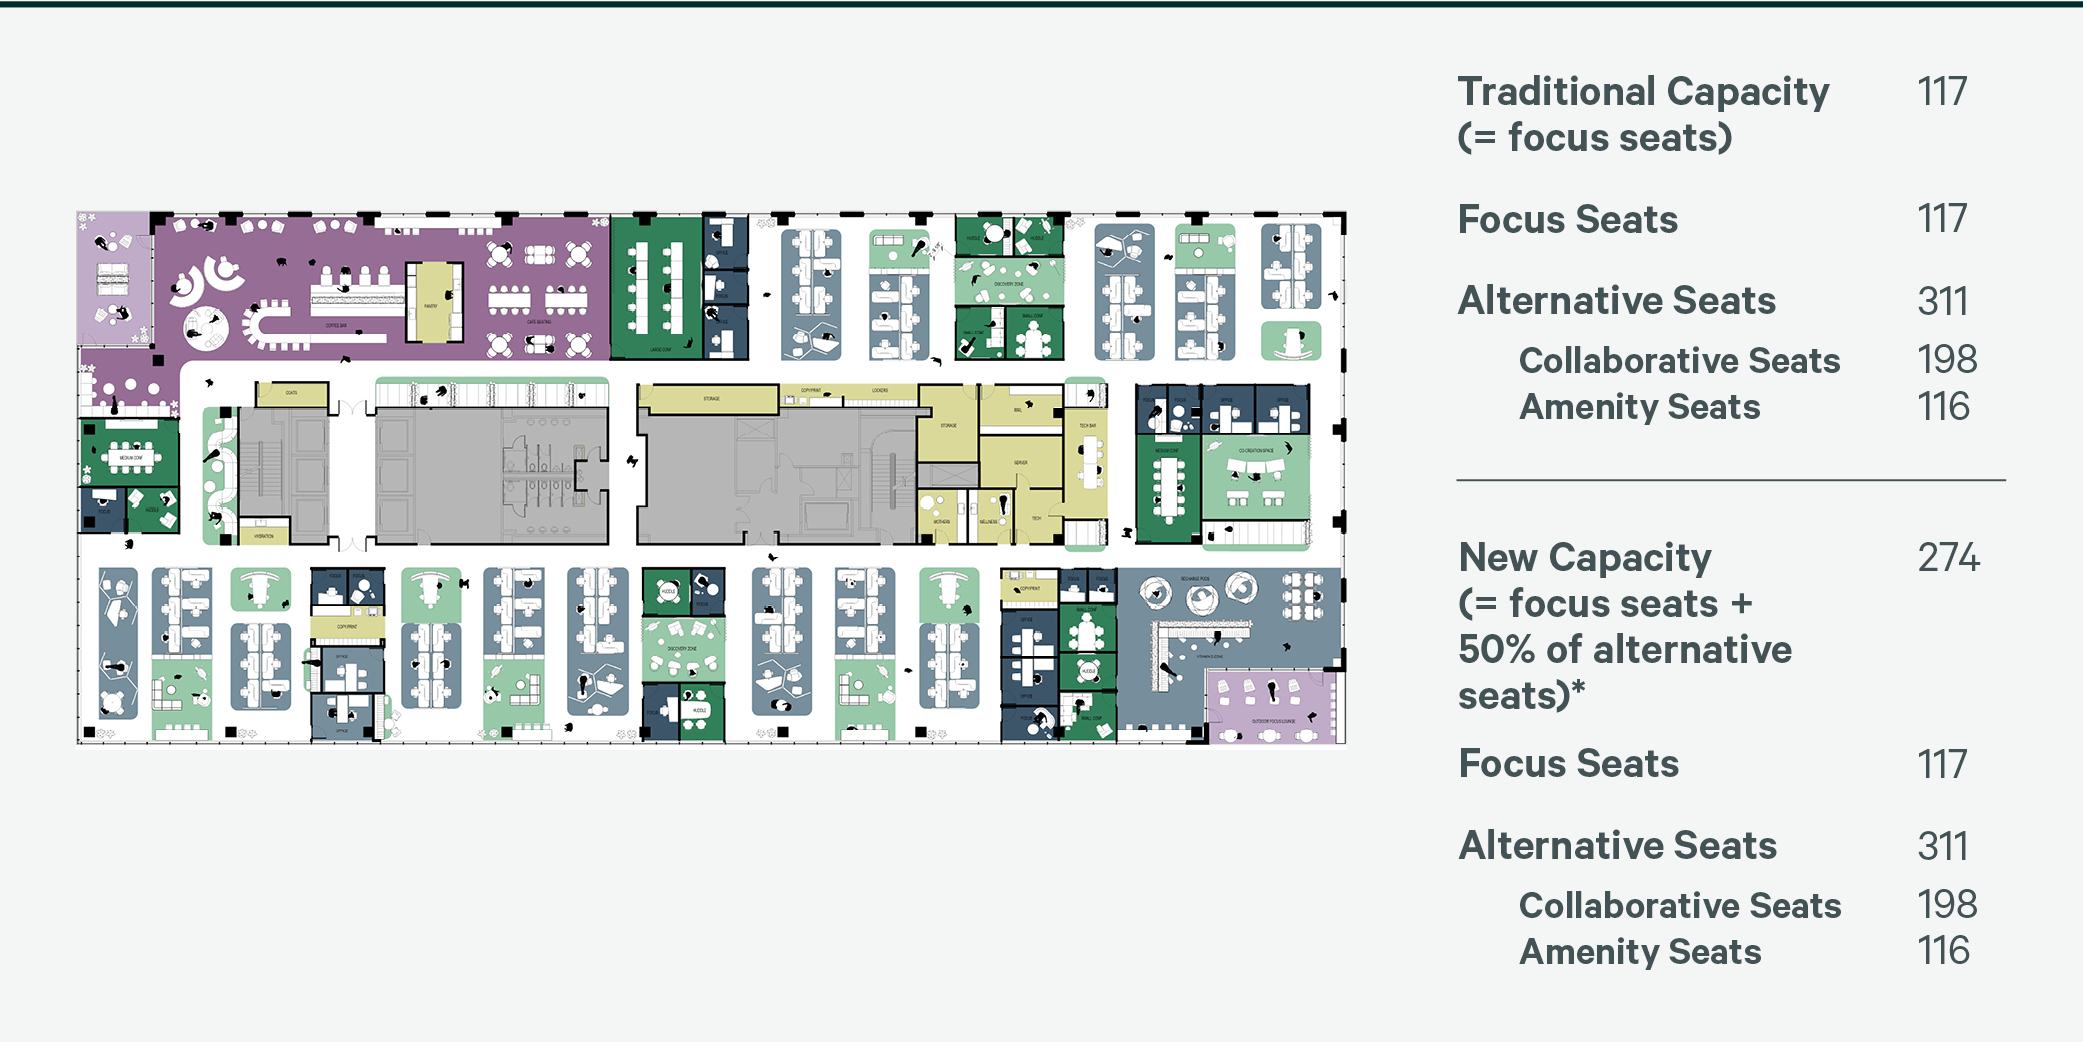
Reconsider Occupancy Planning Metrics to Measure the Opportunity of Alternative Work Seats
Traditionally, an office’s capacity was based on the number of desks and offices that could be assigned to people for focus work. Today, hybrid employees are more likely to share space, using a variety of space types for collaboration and focus throughout the day. To understand the full planning opportunity afforded by hybrid work, alternative work seats where employees can work comfortably for an extended period should be included in the office capacity.
Let’s look at an example of how including alternative work seats can impact our understanding of office capacity. The traditional capacity of the floor plan in Figure 17 is 117, because there are 117 workstations and offices designed for extended focus work. Taking into consideration alternative work seats such as those in conference rooms, huddle rooms and informal collaboration areas, we can increase the capacity to accommodate hybrid work styles. To ensure collaboration seats are available when needed, we will add 50% of the alternative work seats to the total number of focus seats, increasing our capacity to 274.
Including alternative work seats more accurately measures hybrid workplace performance and planning efficiencies because it accounts for the space where collaboration work is done. The approximately 40% difference in capacity highlights how traditional occupancy metrics, that have not been updated to reflect the reality of how most employees work today, can misrepresent portfolio performance and cost savings opportunities hybrid work can offer.
Figure 17: Including alternative work seats in office capacity
Source: CBRE Workplace & Occupancy Management and CBRE Design Collective, 2023.
58% of employees go to the office for connection, while only 15% go for focus work
Design for New Hybrid Work Styles
Emerging workplace designs focus on creating spaces that are flexible, collaborative, sustainable and inclusive. By designing workplaces that incorporate these trends, organizations can boost employee engagement and create a more positive and productive work environment for everyone.
CBRE Design Collective has developed four new office design concepts to support various company objectives and workplace strategies. Each design concept recommends a specific composition of space to accommodate focus and collaboration work based on the organization’s defined purpose for the office.
Figure 18: Emerging design trends
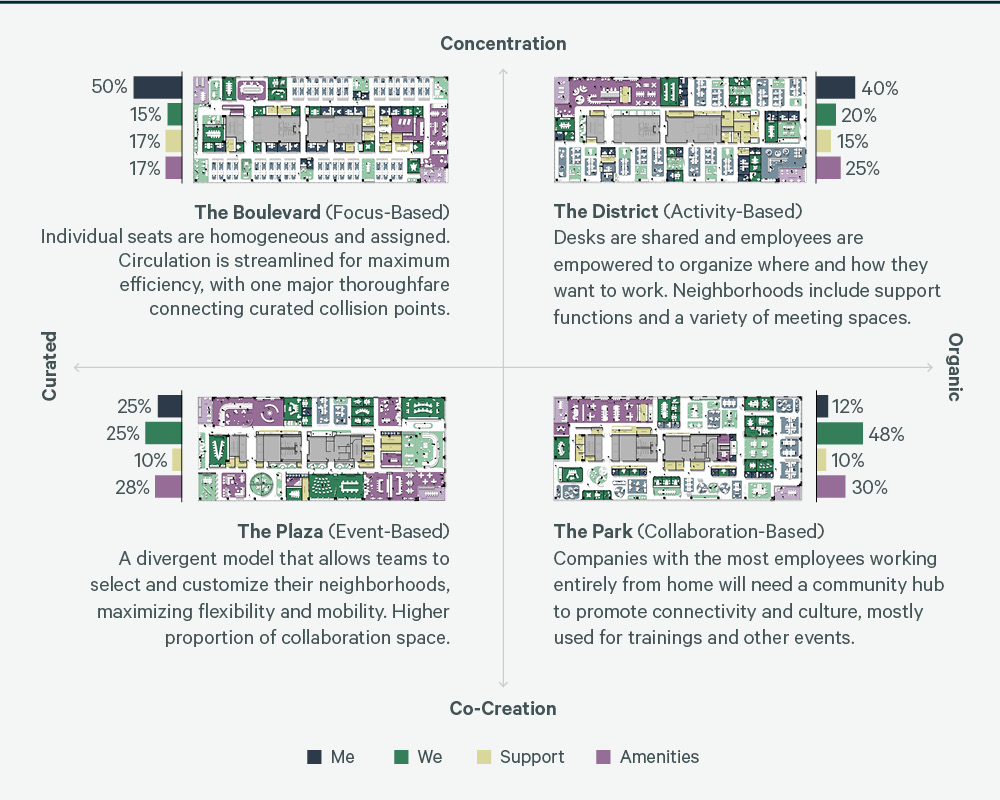
In 2023, offices designed for activity-based working were most common and had the highest utilization rates
According to VergeSense, there has been a 16% increase in the use of meeting spaces since 2020. During that time, benchmarking participants have increased collaboration or we space by 44% and decreased private or me space by 19% to support new work styles and hybrid work policies.
In 2023, portfolios of Financial & Professional Services participants strongly resemble focus-based design recommendations with an excess of me space. On the other hand, Technology, Media, & Telecom and Life Sciences portfolios resemble activity-based designs, with an excess of support space and deficit of amenity space. Industrial & Logistics and Life Sciences sectors have significantly increased the amount of collaboration space over the last three years, 75% and 114% respectively. Both of these sectors typically require more support space for their unique onsite R&D and testing needs. Ongoing micro level utilization data is needed to understand how the rebalancing of space will increase employees’ use of space in 2024.
Figure 19: Office space composition changes since 2021
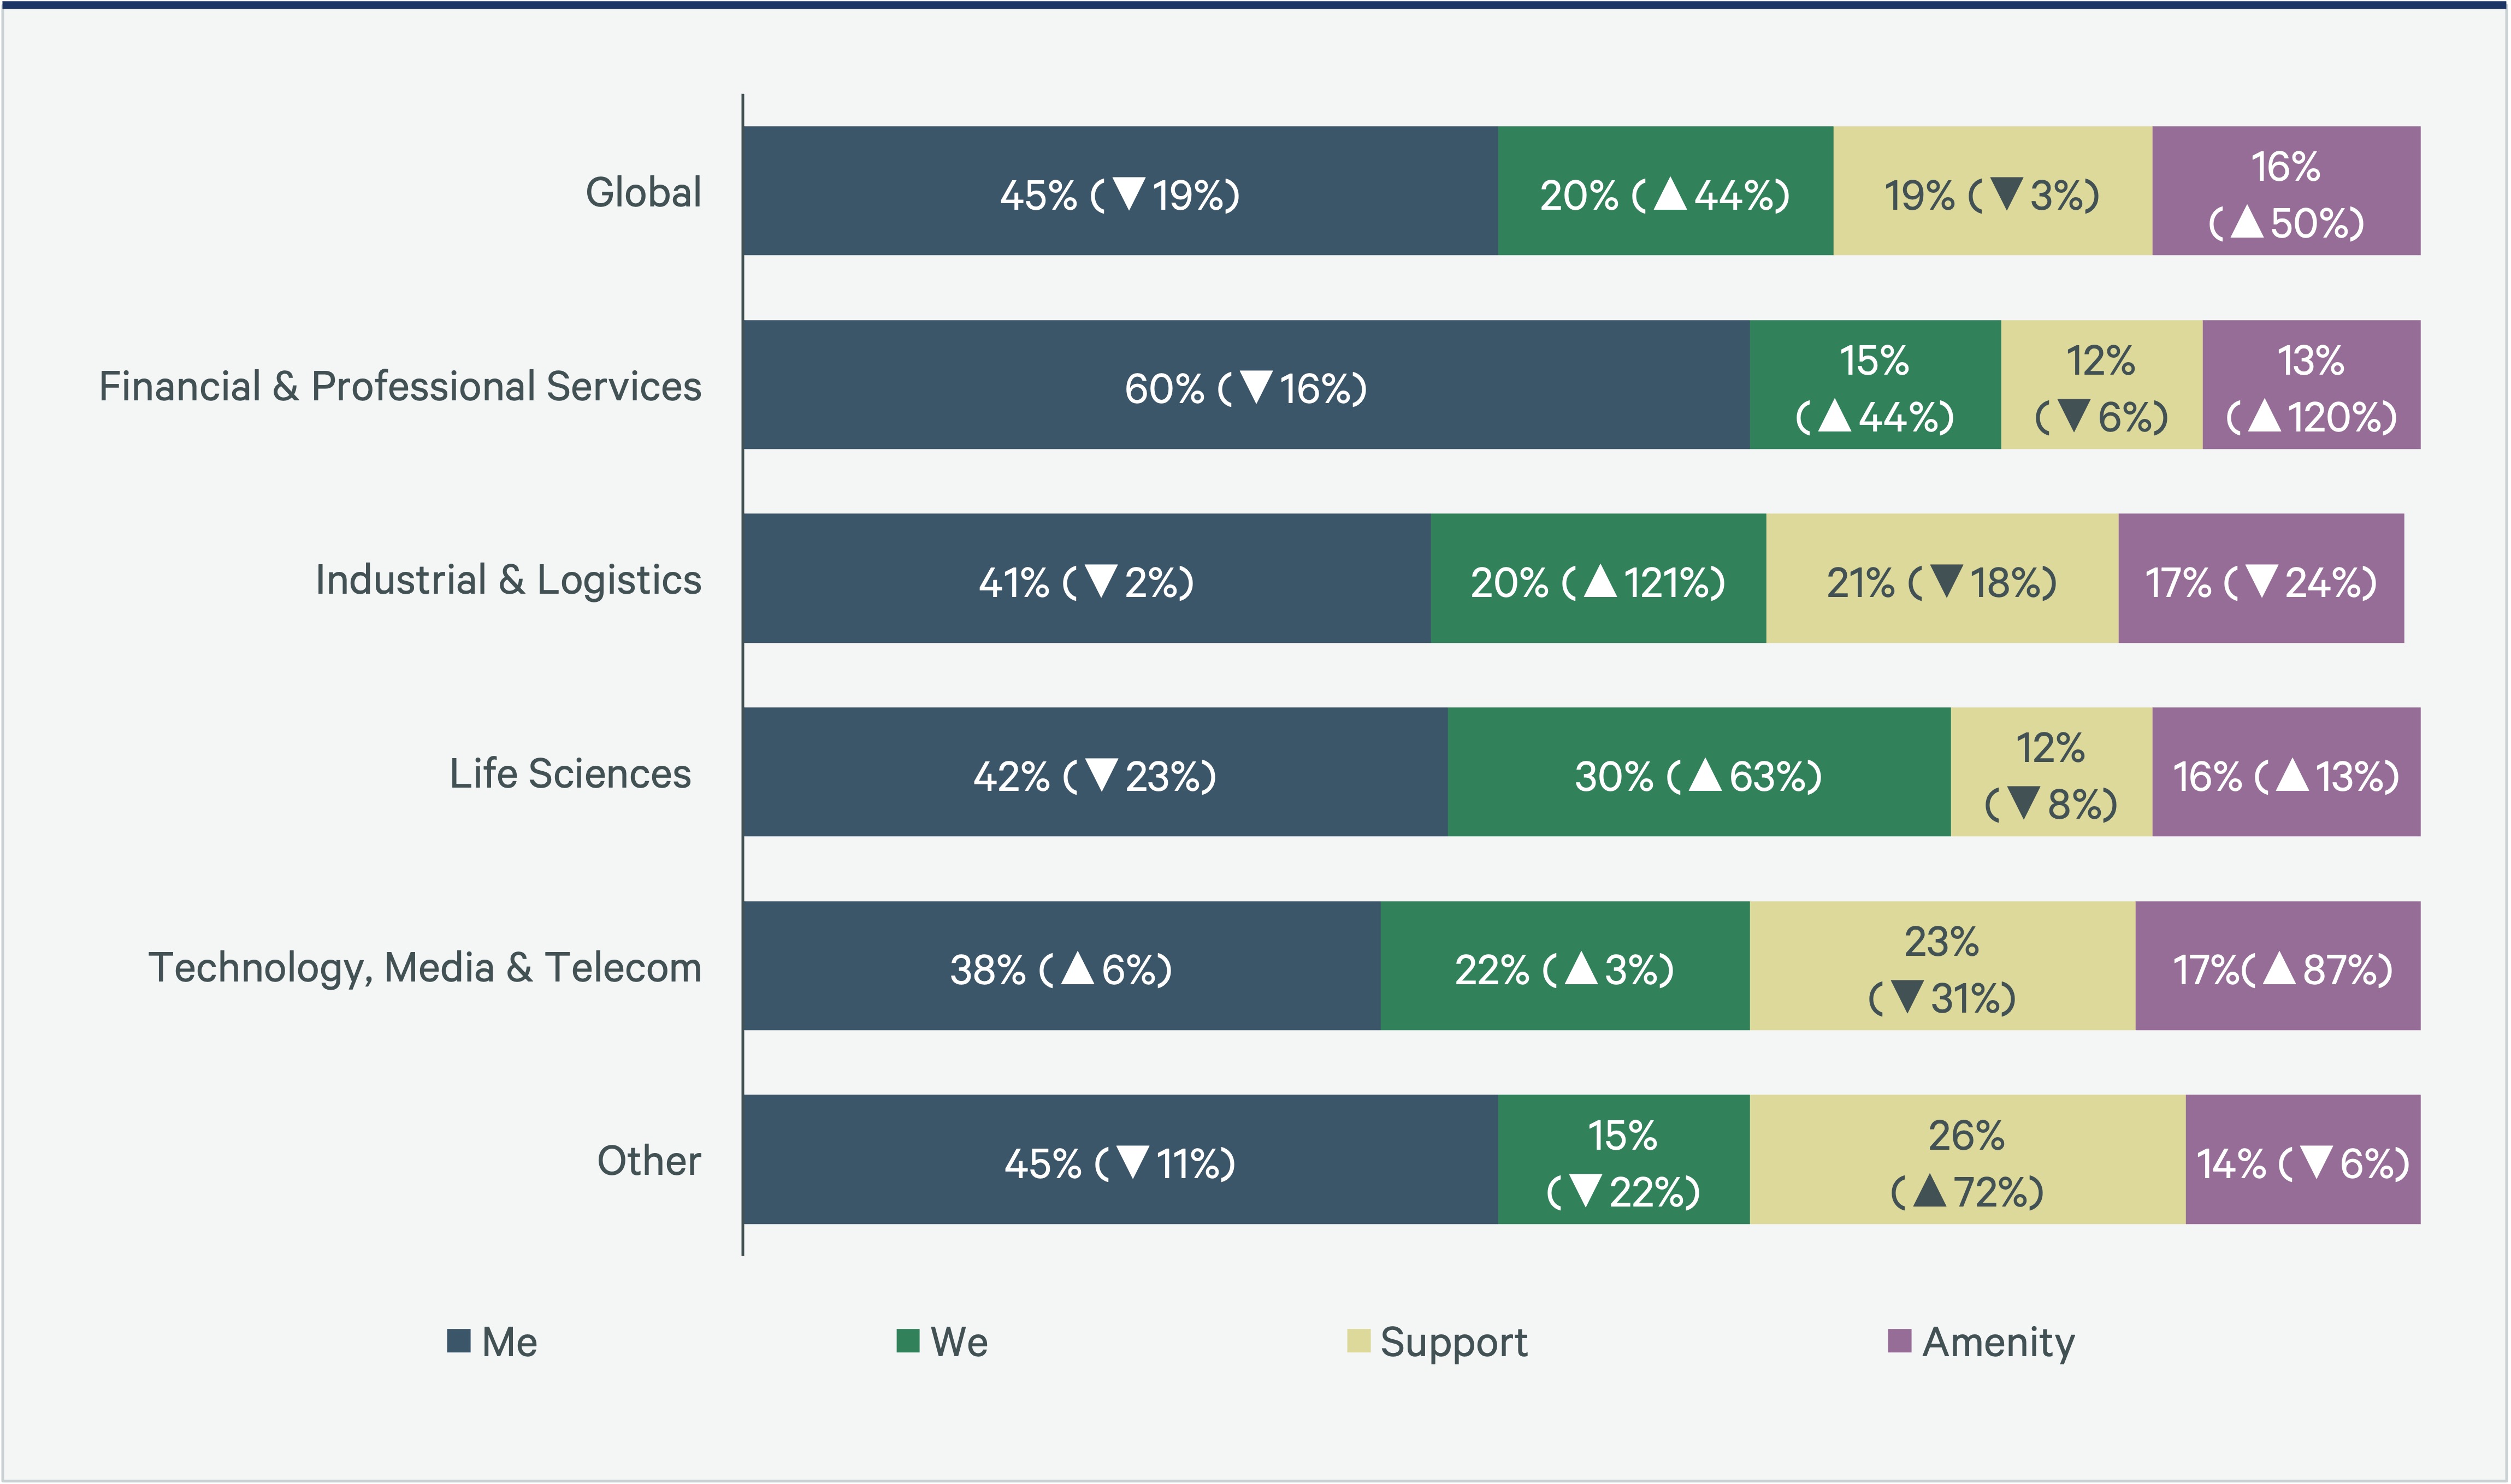
Organizations have increased collaboration space by 44% and decreased private space by 19% since 2021
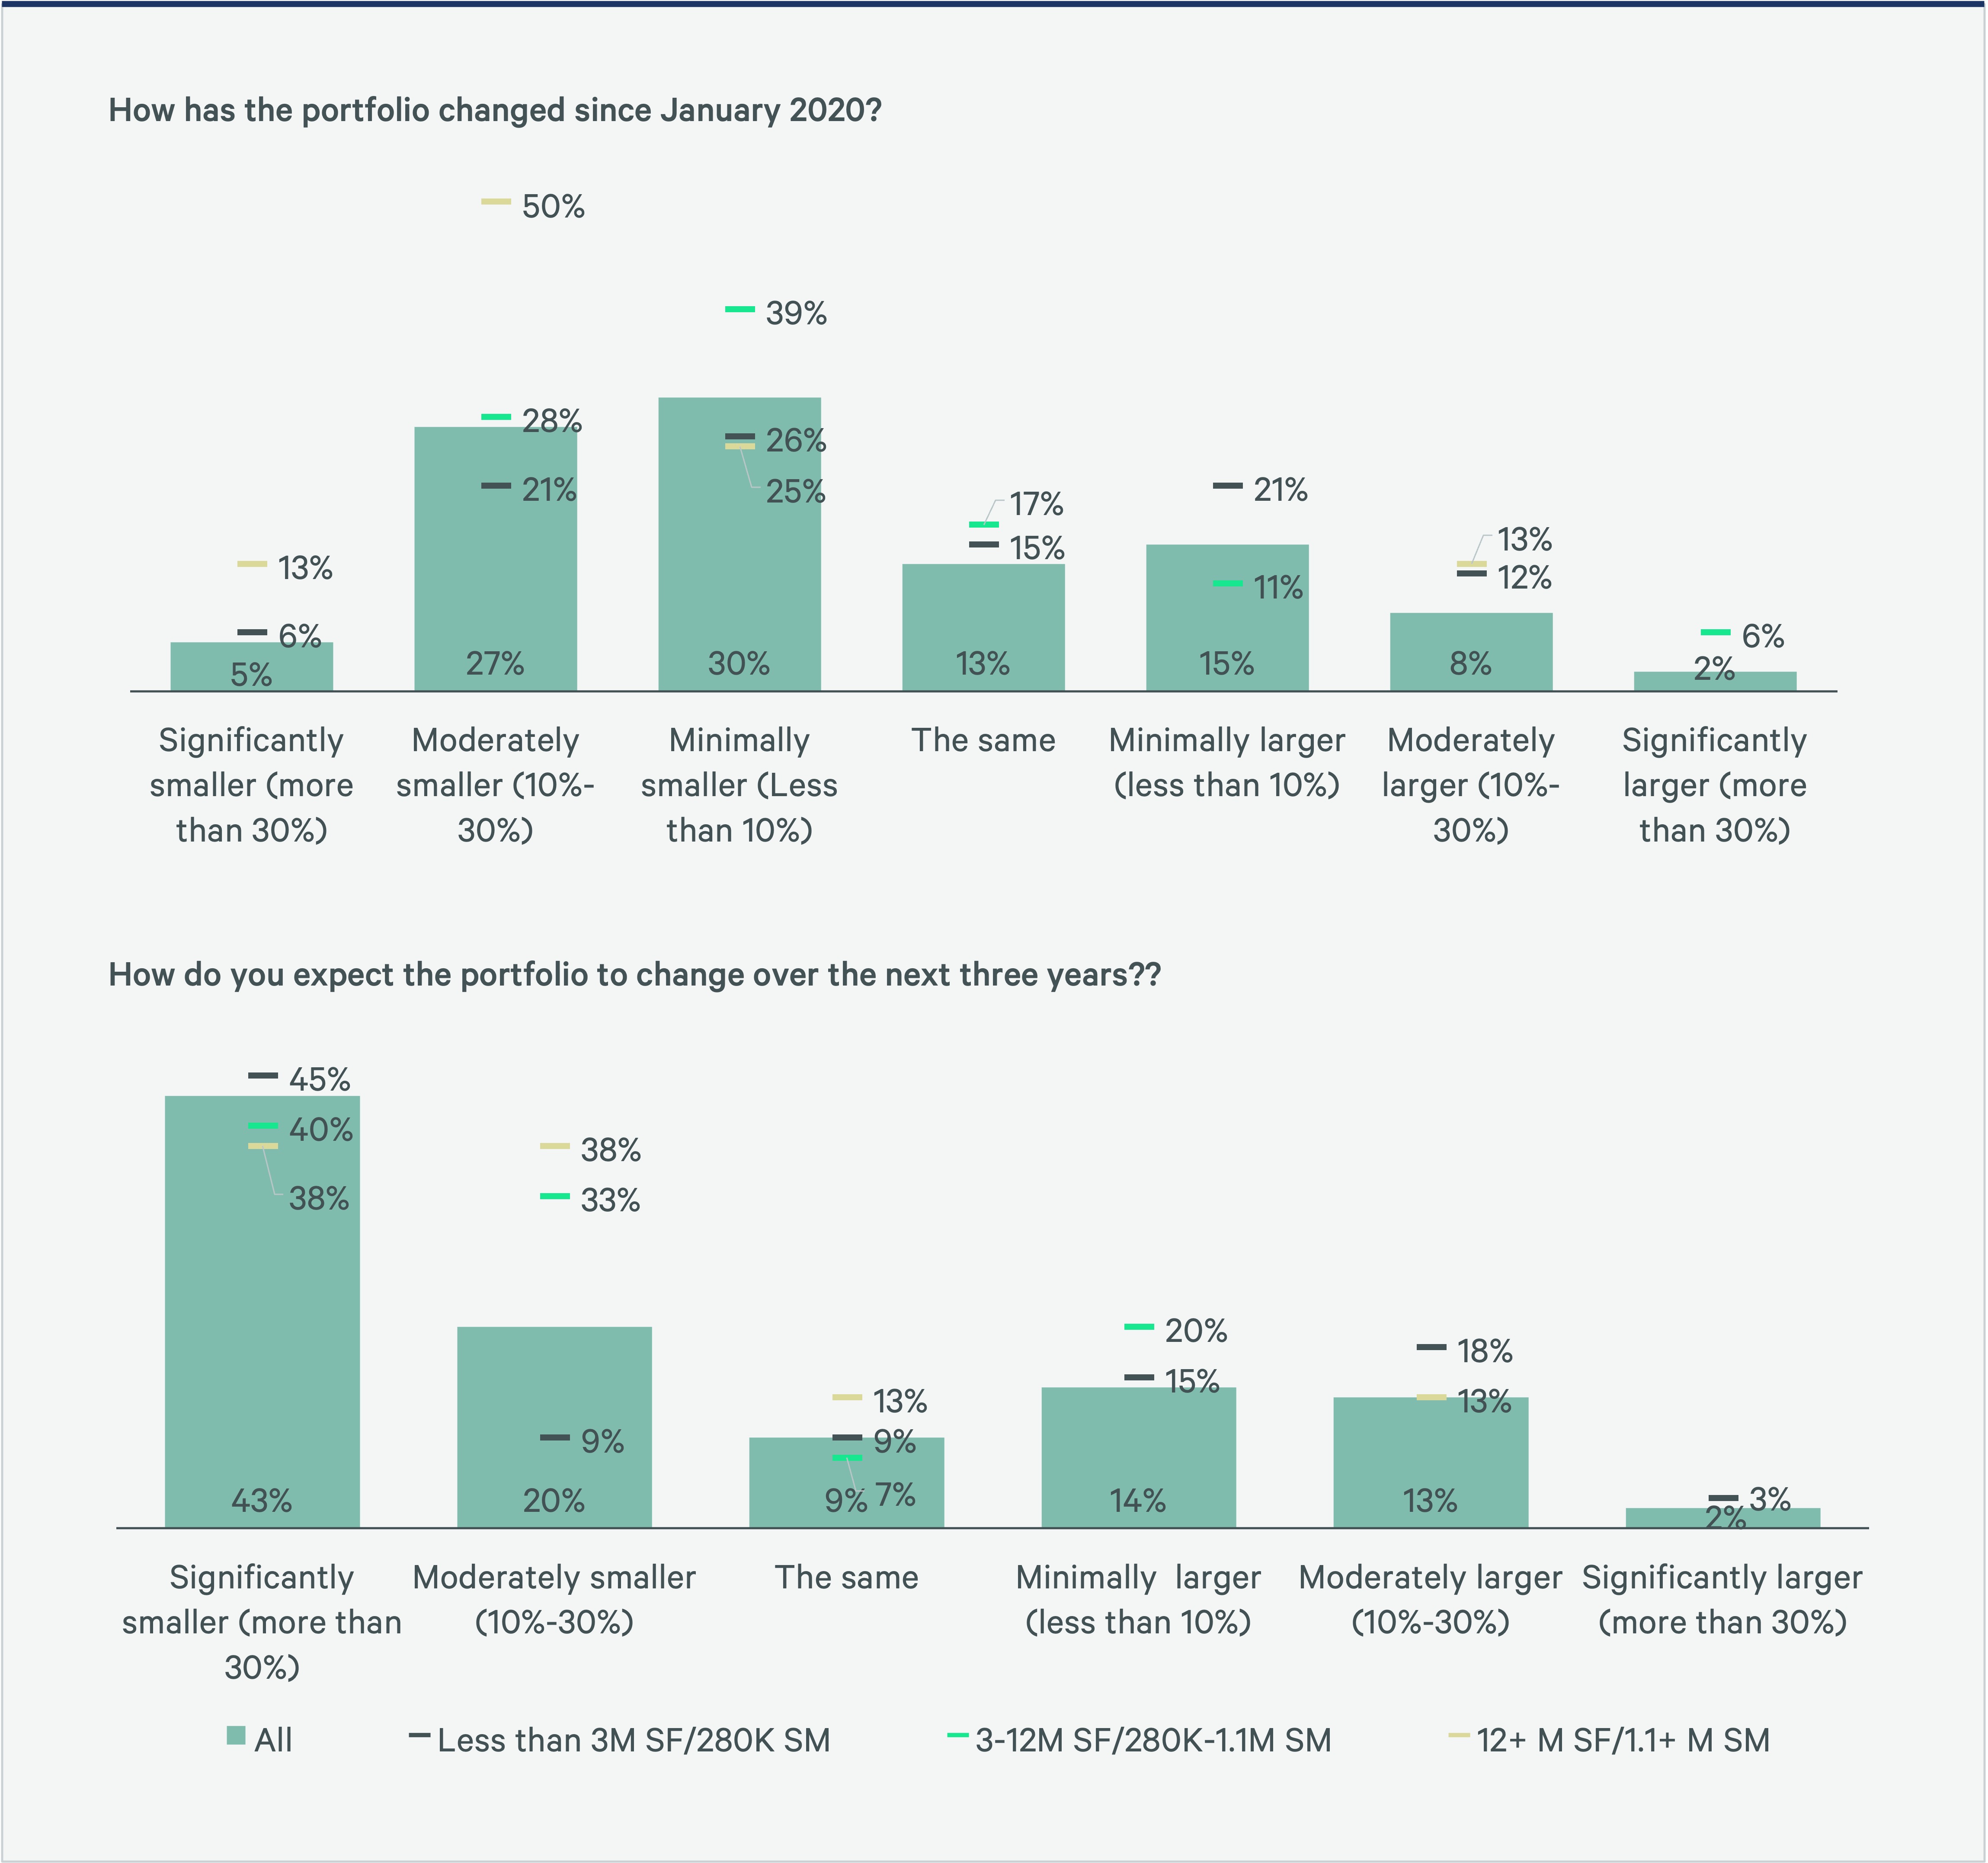
Decreasing the Supply of Space
62% of participants reduced their portfolio size between 2020 and 2023. An additional 63% expect further portfolio reductions by 2026, while 29% of respondents plan to expand their portfolios over the next three years. Organizations with less than 12 million sq. ft./1.1 million sq. m., who saw minimal to moderate space decreases in the past, are planning more significant reductions in the future.
Figure 20: Portfolio Changes 2020-2026
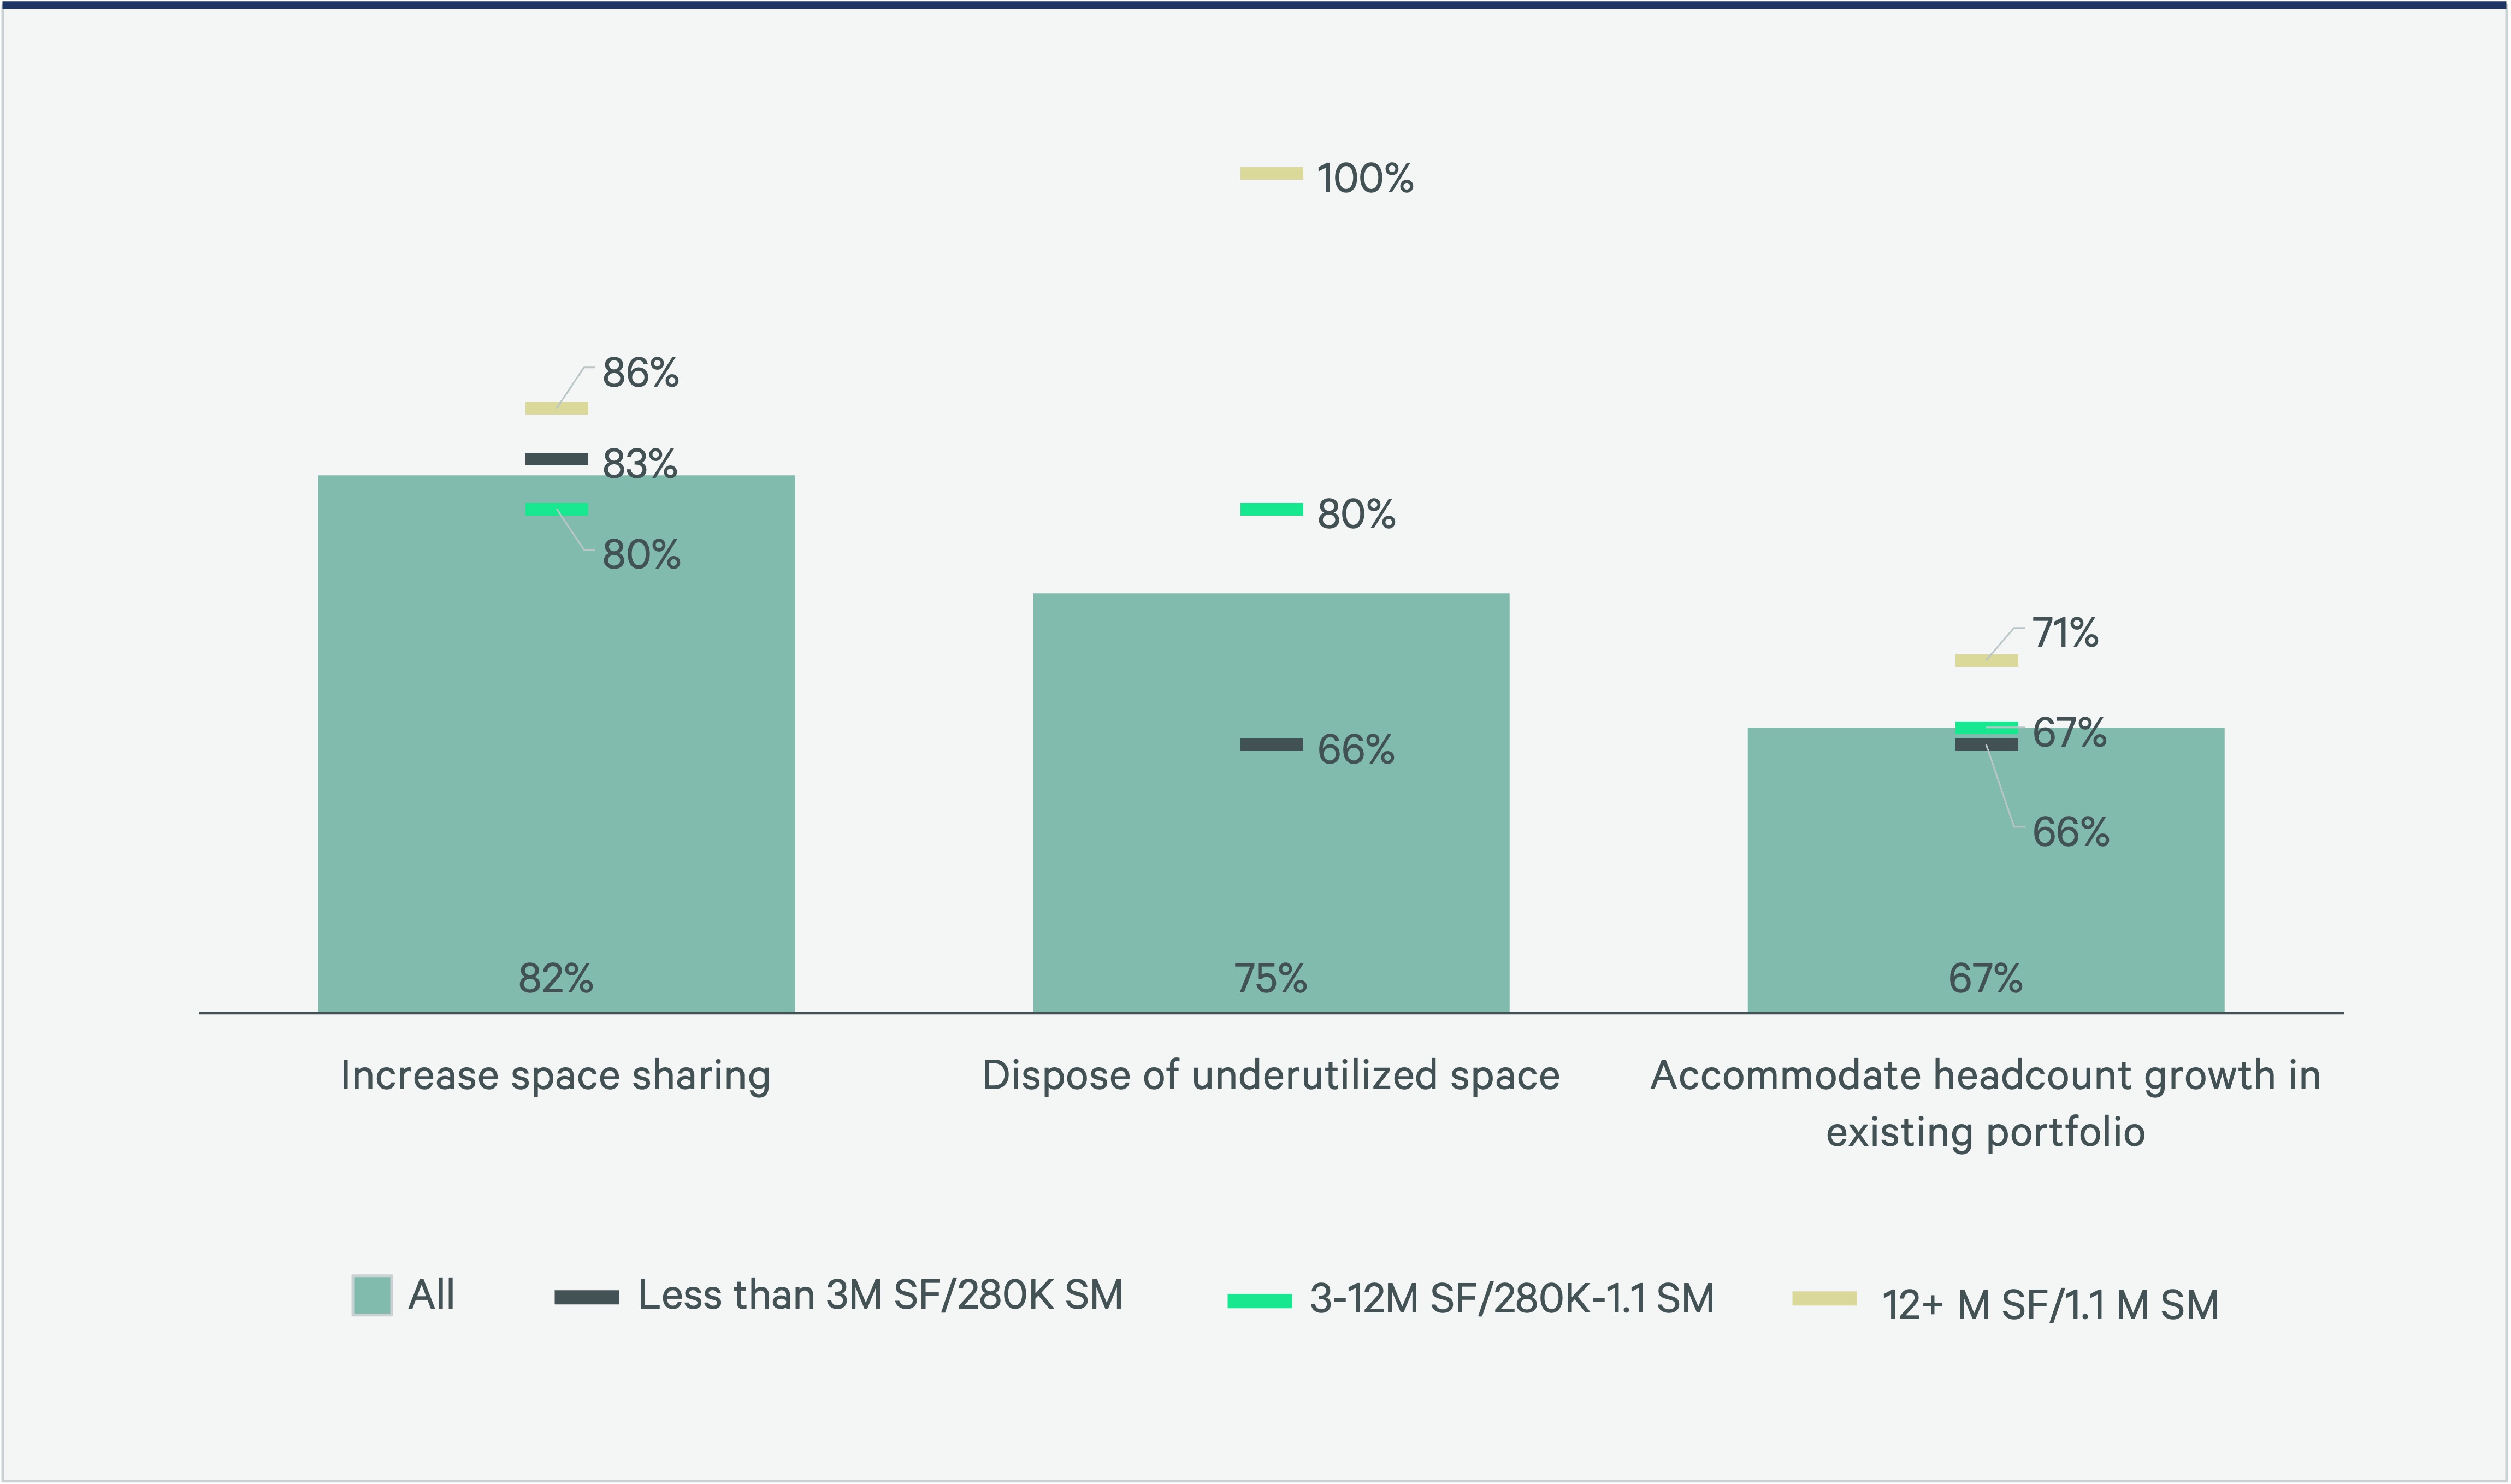
Top Portfolio Optimization Strategies
Portfolio optimization remains the top objective for corporate real estate teams. Of those organizations planning to optimize their portfolio, 75% plan to dispose of underutilized space and 82% plan to increase space-sharing.
Hybrid policies that offer employees flexibility offer the greatest opportunity to reduce or repurpose existing space. Understanding how these policies impact space utilization rates is critical to identifying portfolio optimization opportunities.
Figure 21: Top Three Portfolio Optimization Strategies
Related Services
Leverage occupancy data to empower, anticipate and unlock opportunities within your portfolio.
- Plan, Lease & Occupy
Workplace Consulting
Build resilience, attract and retain talent, and foster connection and collaboration in your workplace.
- Transform Business Outcomes
Consulting
Gain comprehensive guidance on insightful, executable real estate strategies for both investors and occupiers.
- Plan, Lease & Occupy
Organizational Change & Transformation
Enabling organizations to achieve outcomes, improve performance and create change-ready cultures.
Related Insights
-

Q3 findings indicate that most companies now require some in-office work, and a company’s stated attendance policy may influence turnover rates and time to hire.
-
Brief | Creating Resilience
Three Office Occupancy Trends That Are Impacting Portfolio Strategy
September 1, 2023

CBRE’s 2023 Workplace & Occupancy Benchmarking Program has identified three trends across Occupancy Management clients.
-

The conventional narrative that knowledge workers are abandoning high-cost major U.S. markets is not the complete story.
-
Podcast | Adaptive Spaces
Where It’s At: Expert takes on creating the ideal office experience
June 27, 2023

Want a more engaged, productive workforce in the age of hybrid work? The key is rethinking the office with new design approaches, flexible space and an abundance of practical amenities. So say three workplace strategy experts—Industrious CEO Jamie Hodari and CBRE’s Lenny Beaudoin and John Stephens—in a discussion about the future of cities.
Authors
Susan Wasmund
Executive Managing Director, Americas Consulting | Global Occupancy Management