Future Cities
2022 North America Industrial Big Box Review & Outlook: Los Angeles County
March 11, 2022 5 Minute Read

The Greater Los Angeles industrial market offers convenient access to the key U.S. ports of Los Angeles and Long Beach and a freeway system that reaches dense population centers in 11 Western states. Robust demand that exceeds the amount of under-construction warehouse space by a ratio of 2 to 1 has led to rising rental rates and land values. This is expected to continue in 2022, given the region's dearth of available land, entitlement barriers and rising demand from companies to replenish historically low inventory levels.
Demographics
More than 15 million people live within 50 miles of the market core—the third most in the U.S. and nearly 26% of whom are in the important 18-to-34 age demographic. Nearly 29 million people live within a 250-mile radius, with an expected growth rate of 2.9% over the next five years.
Figure 1: Los Angeles County Population Analysis

Source: CBRE Location Intelligence.
According to CBRE Labor Analytics, Los Angeles County’s warehouse labor force of 213,555 is expected to grow by 3.0% by 2030. The region has a high cost of living and its average hourly wage for a non-supervisory warehouse employee is one of the highest in the country at $17.36—16.4% above the national average.
Figure 2: Los Angeles County Warehouse & Storage Labor Fundamentals
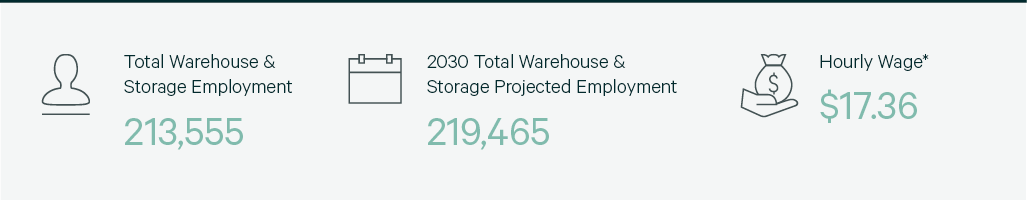
Source: CBRE Labor Analytics.
*Median wage (1 year experience); non-supervisory warehouse material handlers.
Location Incentives
Over the past five years, there have been 105 economic incentives deals totaling more than $167 million at an average of $15,711 per new job in the Los Angeles metropolitan area, according to Wavteq.
According to CBRE’s Location Incentives Group, among the top incentive programs offered in Los Angeles County is the California Competes Tax Credit, which is a discretionary income tax credit awarded to businesses that locate to or expand in California. This program was extended through 2023 with $180 million in tax credits available for allocation to businesses that make capital investments, create new jobs and offer strategic importance to the region. The credits are non-refundable and companies can only apply during designated application periods three times each year.
Figure 3: Los Angeles County Top Incentive Programs
Source: CBRE Location Incentives Group.
Note: The extent, if any, of state and local incentive offerings depends on location and scope of the operation.
Logistics Driver
Los Angeles County is home to the top two seaports in North America and one of the top five air cargo hubs in the U.S. Imports and exports flowing through the ports of Los Angeles and Long Beach directly feed big-box distribution centers in the region. COVID-19 restrictions lowered imports in 2020, but significant improvement in 2021 kept port-related demand strong.
Los Angeles International (LAX) is the fifth busiest air cargo airport in the U.S. The convenience and efficiency of LAX as a major distribution center for air cargo is supported by the ready availability of vital allied services, especially for Pacific Rim traders. The LA-area cargo industry engages more than 800 freight forwarders and 360 customs house brokers, who expedite the region’s air cargo delivery. U.S. banks with international operations have offices in Los Angeles, as do foreign banking institutions.
The convenience and efficiency of LAX as a major distribution center for air cargo is supported by the ready availability of vital allied services, especially for Pacific Rim traders.

Capital Markets
Los Angeles County has one of the strongest and most diverse industrial markets in the U.S. There has never been a year where land prices have grown as fast as 2021, with prices averaging more than $100 per sq. ft. Cap rates are some of the lowest in the country at sub-3% for Class A assets. The extremely low vacancy rate, combined with a dense population base, has the market poised for continued price appreciation and nationally low cap rates.
Figure 4: Cap Rate Comparison
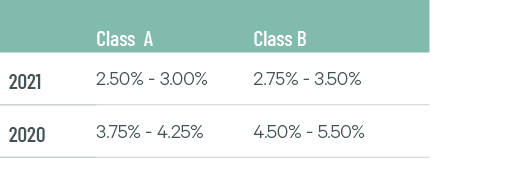
Source: CBRE Research.
Supply & Demand
Los Angeles County is one of the most mature big-box markets in North America, dominated by buildings built before 2000 and 85% of which are under 500,000 sq. ft. The region has the lowest direct vacancy rate in North America at 0.2%. Despite lack of available inventory, the market posted 4.9 million sq. ft. of positive absorption last year thanks to 12.5 million sq. ft. of leasing activity, 58% more than in 2020. 3PLs dominated leasing activity, with a market share of 47%.
Companies outsourced their warehouse and distribution operations to 3PLs in the region due to difficulty finding available space and increased costs, including a 48% year-over-year jump in the average taking rent to $14.92—the highest in the nation.
Just 1.8 million sq. ft. of new construction was completed last year and only 3.1 million sq. ft. is currently under construction, 42% of it preleased. Low vacancy rates and proximity to ports will make Los Angeles County the tightest and highest-cost big-box market in North America for the foreseeable future.
Figure 5: Share of 2021 Leasing Activity by Occupier Type

Note: Includes new leases and renewals 200,000 sq. ft. and above.
Source: CBRE Research.
Figure 6: Leasing Activity

Note: Includes new leases and renewals 200,000 sq. ft. and above.
Source: CBRE Research.
Figure 7: 2021 Construction Completions vs. Overall Net Absorption
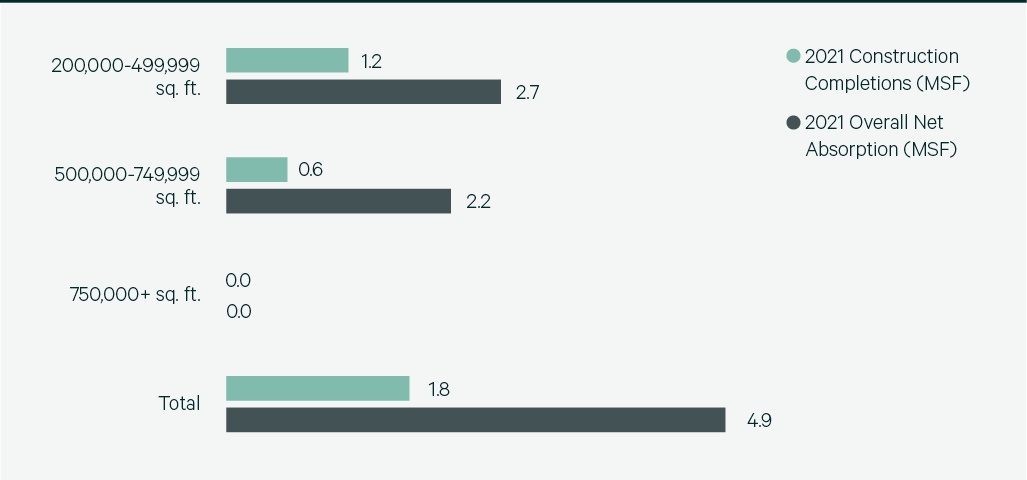
Source: CBRE Research.
Figure 8: Direct Vacancy Rate by Size Range
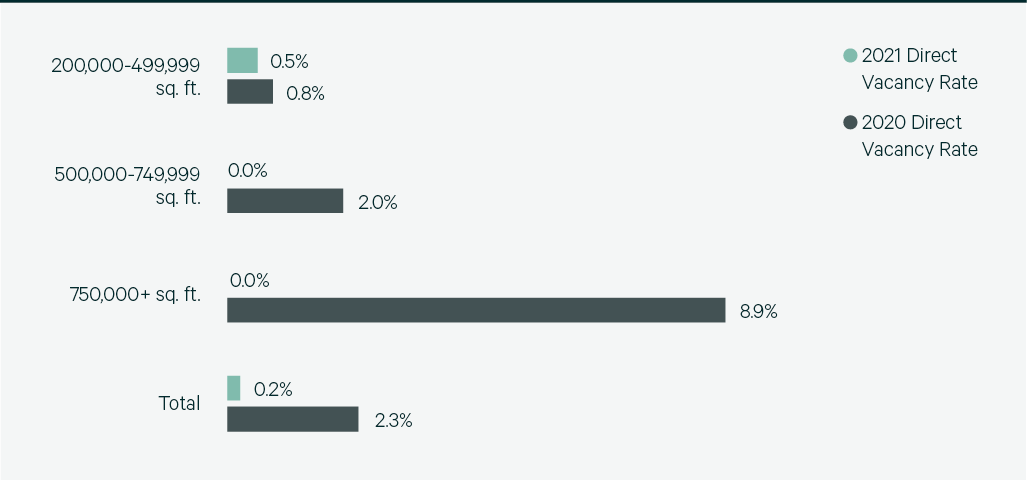
Source: CBRE Research.
Figure 9: Under Construction & Percentage Preleased
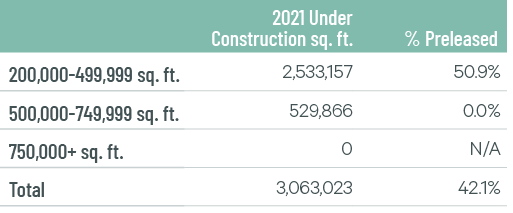
Source: CBRE Research.
Figure 10: Historical First Year Taking Rents (psf/yr)
Note: Includes first year taking rents for leases 200,000 sq. ft. and above.
Source: CBRE Research.
Explore Big Box Insights by Market
The combination of location, transportation networks and available labor make the Central Valley a premier big-box market.

The Greater Phoenix industrial market is delivering strong results, with record net absorption and a record-low vacancy rate.

The Inland Empire market consists of Class A big-box distribution assets with freeway access and proximity to the affluent Southern California consumer base.
Contacts
James Breeze
Vice President, Global Industrial and Retail Research

John Morris
President, Americas Industrial & Logistics, Advisory Services