Future Cities
2022 North America Industrial Big Box Review & Outlook: Central Valley, California
March 11, 2022 5 Minute Read
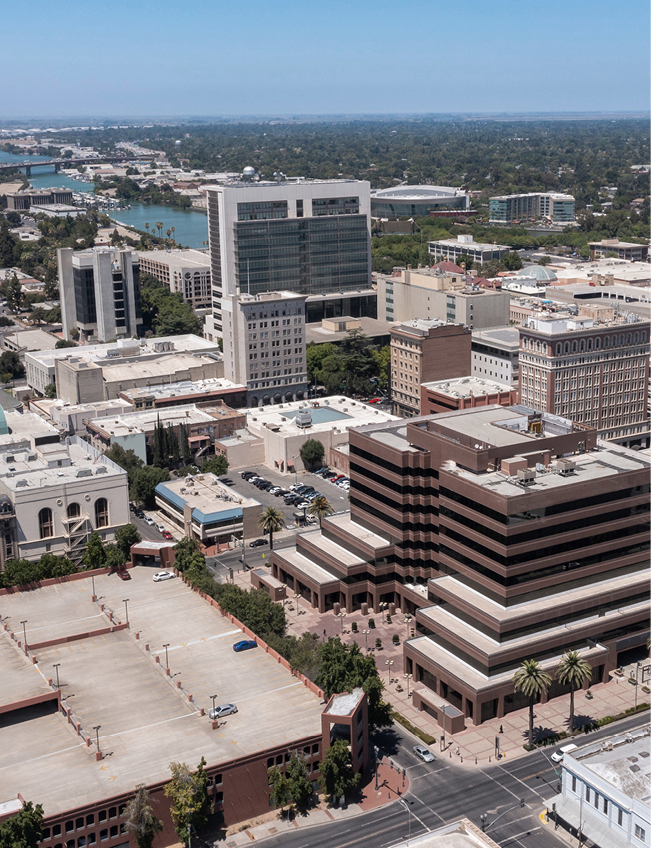
The Central Valley industrial market enjoyed a banner year in 2021, with net absorption reaching an all-time high. E-commerce, food & beverage, 3PLs and electronic vehicle occupiers remain the key drivers of demand. Supply needs are being met by a stable of best-in-class institutional developers. The combination of location, transportation modalities and labor accessibility makes the Central Valley the premier location from which to serve Northern California and the western U.S.
Demographics
Central Valley’s proximity to the affluent Bay Area gives it convenient access to more than 6.7 million people within a 50-mile radius. Within 250 miles, the market reaches 17.7 million people, with nearly 25% in the 18-to-34 age demographic.
Figure 1: Central Valley Population Analysis
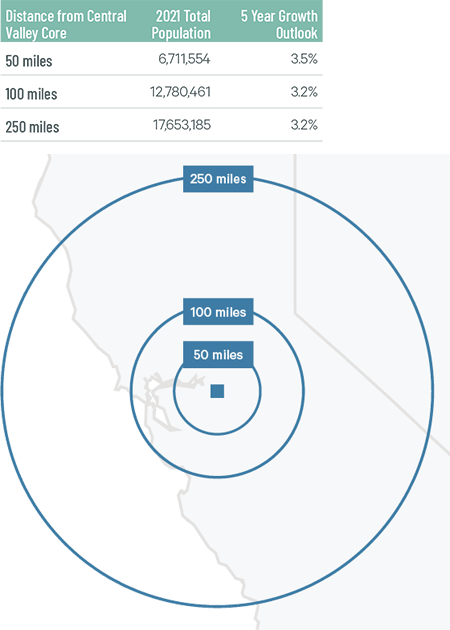
Source: CBRE Location Intelligence.
According to CBRE Labor Analytics, the local warehouse labor force of 19,127 is expected to grow by a nation-leading 24% by 2030. The average wage for a non-supervisory warehouse worker is $17.31 per hour, 16.1% higher than the national average.
Figure 2: Central Valley Warehouse & Storage Labor Fundamentals
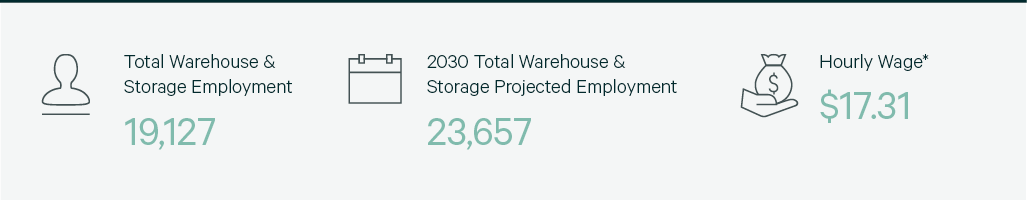
Source: CBRE Labor Analytics.
*Median wage (1 year experience); non-supervisory warehouse material handlers.
Location Incentives
Over the past five years, there have been 84 economic incentives deals totaling more than 72 million at an average of $12,612 per new job in the Central Valley metropolitan area, according to Wavteq.
According to CBRE’s Location Incentives Group, among the top incentive programs in Central Valley is the California Competes Tax Credit, a discretionary income tax credit awarded to businesses that locate or expand in California. The program has $180 million in tax credits available through 2023 for allocation to businesses that make capital investments, create new jobs and offer strategic importance to the region. The credits are non-refundable and companies can only apply during designated application periods three times each year.
Figure 3: Central Valley Top Incentive Programs
Source: CBRE Location Incentives Group.
Note: The extent, if any, of state and local incentive offerings depends on location and scope of the operation.
Logistics Driver
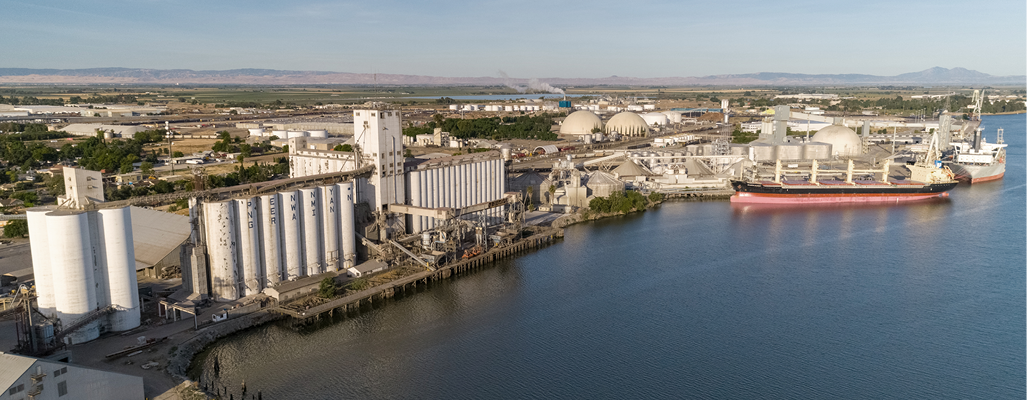
The Central Valley is one of the most rail-friendly logistics regions in California, served by two major lines: BNSF and Union Pacific. Fresno Yosemite International Airport provides daily cargo services by FedEx and UPS. Perhaps the region’s top logistics advantage is the Port of Stockton, which is served by four major freeways, two transcontinental railroads, an international waterway and a regional airport. The port boasts first-class warehouse storage and handling facilities for both dry and liquid bulk materials, facilities and equipment to handle break-bulk and containerized cargo by land or sea.
Perhaps the region’s top logistics advantage is the Port of Stockton which is served by four major freeways, two transcontinental railroads, an international waterway and a regional airport.
Capital Markets
The Central Valley continues to attract high-quality tenants and institutional investors. In 2021, sales to institutional investors increased by 10.2% year-over-year to $595 million. This demand is expected to continue given the Central Valley’s attractive market fundamentals: the large northern California population, dynamic local economy, strong regional transportation links and proximity to the Port of Oakland and Intermodal facilities. Top owners include Prologis, Blackstone, Buzz Oates, Clarion, LBA, Stockbridge, Duke, OMP, CenterPoint and UBS. Class A cap rates are expected to stabilize in the 3.25%-to-3.5% range in 2022.
Figure 4: Cap Rate Comparison
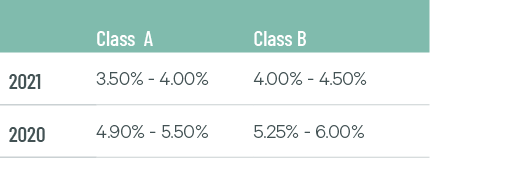
Source: CBRE National Partners.
Supply & Demand
Central Valley remained one of the top big-box growth markets in North America due to its available land and central location in California. Leasing activity totaled 10.9 million sq. ft. in 2021, with demand evenly distributed throughout different size ranges. Net absorption increased to 7.0 million sq. ft. for a growth rate (net absorption/existing inventory) of 7.2%, fifth in North America. Demand was led by the food & beverage sector and 3PLs that each had a market share of nearly 30%.
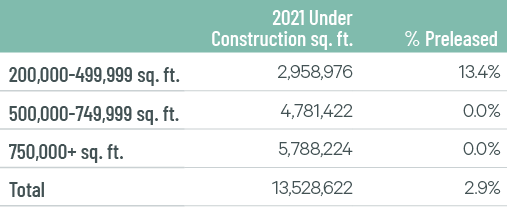
First-year taking rents increased 17.7% to $7.20 per sq. ft., which remains the lowest of any California market. Construction completions totaled 4 million sq. ft in 2021 but will significantly increase in 2022 with 13.5 million sq. ft. under construction. The available first-generation space this year will provide options for big-box occupiers to enter the market, leading to another year of sizable leasing activity and rent growth.
Figure 5: Share of 2021 Leasing Activity by Occupier Type
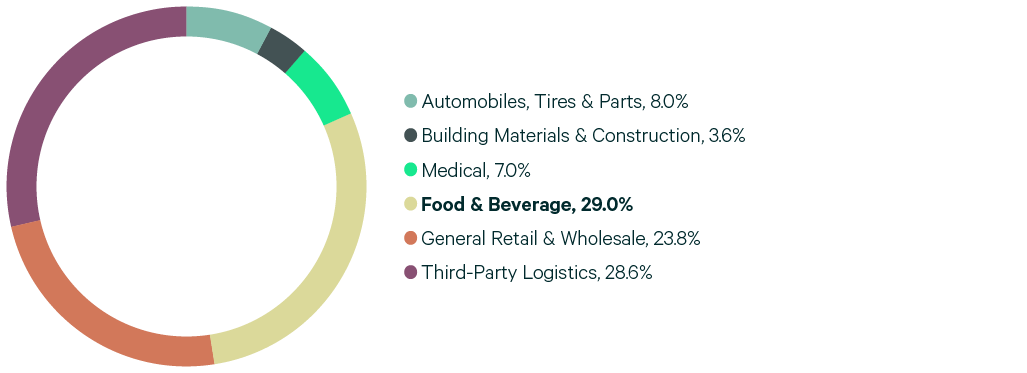
Note: Includes new leases and renewals 200,000 sq. ft. and above.
Source: CBRE Research.
Figure 6: Leasing Activity
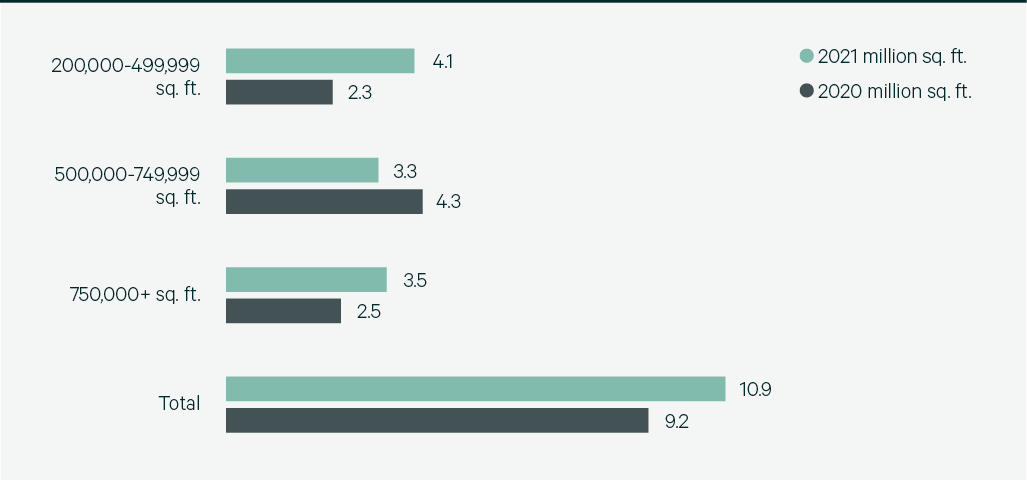
Note: Includes new leases and renewals 200,000 sq. ft. and above.
Source: CBRE Research.
Figure 7: 2021 Construction Completions vs. Overall Net Absorption
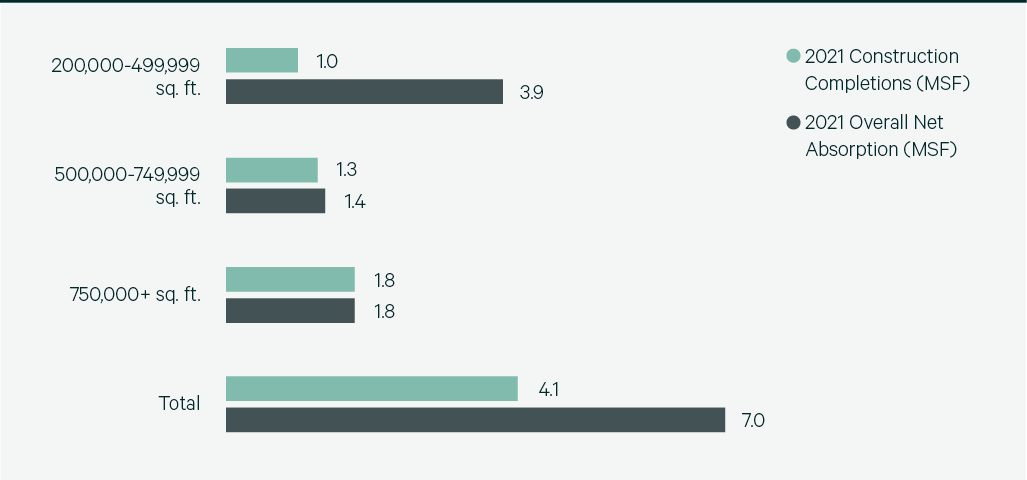
Source: CBRE Research.
Figure 8: Direct Vacancy Rate by Size Range
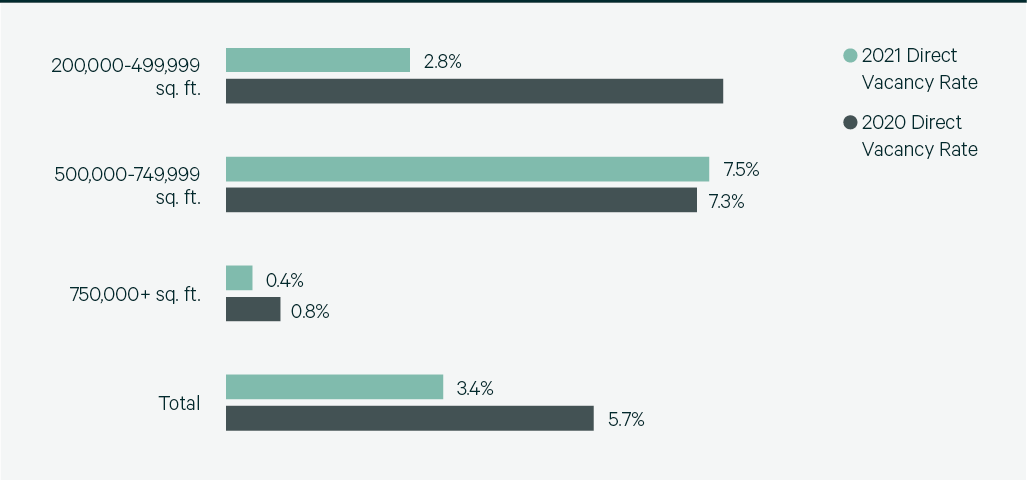
Source: CBRE Research.
Figure 9: Under Construction & Percentage Preleased
Source: CBRE Research.
Figure 10: Historical First Year Taking Rents (psf/yr)
Note: Includes first year taking rents for leases 200,000 sq. ft. and above.
Source: CBRE Research.
Explore Big Box Insights by Market

The Los Angeles market offers access to the ports of Los Angeles and Long Beach and a freeway system reaching dense population centers in 11 Western states.

The Greater Phoenix industrial market is delivering strong results, with record net absorption and a record-low vacancy rate.
The Inland Empire market consists of Class A big-box distribution assets with freeway access and proximity to the affluent Southern California consumer base.
Contacts
James Breeze
Vice President, Global Industrial and Retail Research

John Morris
President, Americas Industrial & Logistics, Advisory Services