Future Cities
2022 North America Industrial Big Box Review & Outlook: Dallas/Ft. Worth
March 11, 2022 5 Minute Read

The Dallas/Ft. Worth industrial is seeing record-low vacancy and robust levels of demand, new construction, rental rate growth and property price appreciation. These strong fundamentals are buoyed by exceptional job growth and the fact that 500 people are moving to the North Texas region every day. Developers seeking land for new construction are pioneering farther out to tertiary municipalities.
Demographics
More than 7.7 million people live in the Dallas/Ft. Worth (DFW) urban core, with an expected growth rate of 9.6% over the next five years—the highest of any market in this report. Over 28 million people live within 250 miles of the urban core, with an expected growth rate of 7.8% over the next five years. Nearly a quarter of the total population within 50 miles of DFW is in the 18-to-34 age bracket.
Figure 1: Dallas/Ft. Worth Population Analysis
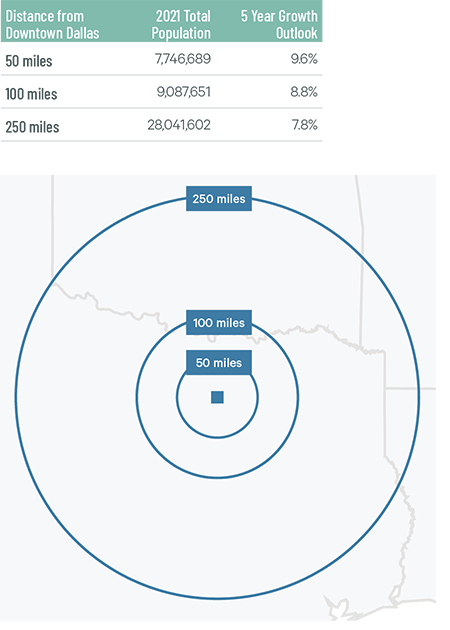
Source: CBRE Location Intelligence.
According to CBRE Labor Analytics, the region’s warehouse labor force of 150,029 is expected to grow by 17.3% by 2030. The average salary of a non-supervisory employee is $15.03 per hour, 1.0% higher than the U.S. average.
Figure 2: Dallas/Ft. Worth Warehouse & Storage Labor Fundamentals
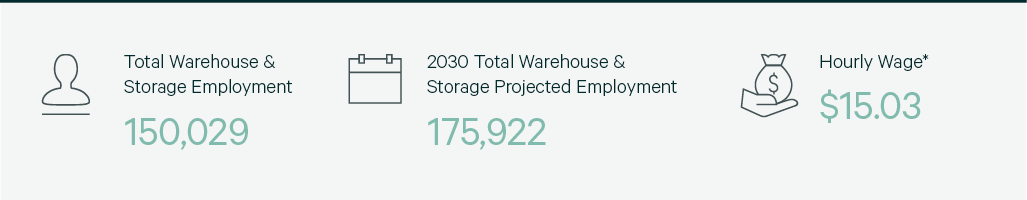
Source: CBRE Labor Analytics.
*Median wage (1 year experience); non-supervisory warehouse material handlers.
Location Incentives
Over the past five years, there have been 73 economic incentives deals totaling more than $606 million at an average of $11,541 per new job in the DFW metropolitan area, according to CBRE’s Location Incentives Group.
Among the top incentive programs offered in DFW is the Texas Enterprise Fund (TEF), commonly referred to as a “deal-closing” grant. TEF awards discretionary cash grants to companies considering a new project for which a Texas site is competing against other viable out-of-state options. Award amounts are determined based on an analytical model that factors in the average wage of new employees, the hiring timeline and a company’s total capital investment.
Another incentive program is the Skills Development Fund, which provides job training grants to community and technical colleges for customized training programs that support Texas businesses. This job training program is designed to upgrade the skill levels of new or existing employees, as well as increase wages of the Texas workforce.
Figure 3: Dallas/Ft. Worth Top Incentive Programs
Source: CBRE Location Incentives Group.
Note: The extent, if any, of state and local incentive offerings depends on location and scope of the operation.
Logistics Driver
DFW’s central location gives it a significant advantage in reaching a large consumer base. The region is home to two major inland ports: Alliance Global Logistics Hub and the International Inland Port of Dallas.
The confluence of three major railroad networks (Union Pacific, Burlington Northern-Santa Fe and Kansas City Southern) puts 98% of the U.S. market within 48 hours by train. DFW International Airport is the nation's ninth-largest cargo airport and the only one with the capacity to double operations in its existing footprint. All major U.S. markets can be reached by air in less than four hours.
The confluence of three major railroad networks puts 98% of the U.S. market within 48 hours by train.
Capital Markets
DFW remains a top-three target for most industrial & logistics investors. The market continues to outperform the rest of the nation for population growth, occupancy rates and rent growth. Activity by both domestic and foreign investors is limited only by the number of assets listed for sale. As a result, DFW recorded additional compression of industrial cap rates in 2021.
Figure 4: Cap Rate Comparison
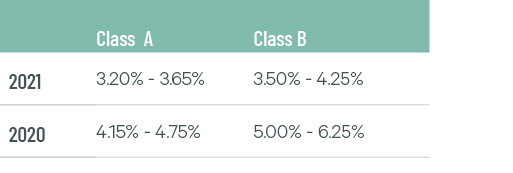
Source: CBRE National Partners.
Supply & Demand
With 424 million sq. ft. of total inventory, DFW is the third-largest big-box market in North America. Occupiers continue to move into and expand within the market, as leasing activity increased by 27.8% year-over-year in 2021 to 44.6 million sq. ft. DFW’s direct vacancy rate dropped to a decade-low 5.4% after 29 million sq. ft. of net absorption last year. General retailers & wholesalers and 3PLs were the most active tenants in the market last year, accounting for 75% of all leases.
Robust demand led to increased development in 2021 with 23.6 million sq. ft. of construction completions, the second most in North America. Groundbreakings were even more impressive, as the market finished 2021 with 50 million sq. ft. under construction, the most for any market in this report. New development will continue to give occupiers relocation or expansion options within the DFW region this year and should have minimal effect on the vacancy rate. Rental rate growth of 15% is expected in 2022.
Figure 5: Share of 2021 Leasing Activity by Occupier Type
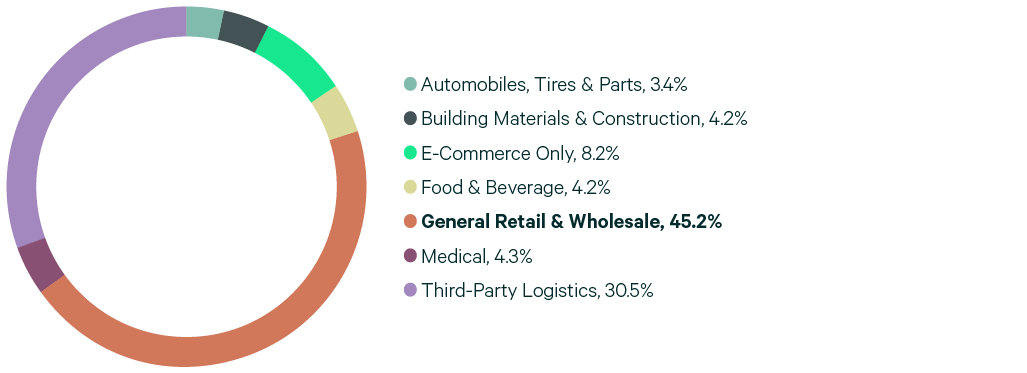
Note: Includes new leases and renewals 200,000 sq. ft. and above.
Source: CBRE Research.
Figure 6: Leasing Activity

Note: Includes new leases and renewals 200,000 sq. ft. and above.
Source: CBRE Research.
Figure 7: 2021 Construction Completions vs. Overall Net Absorption
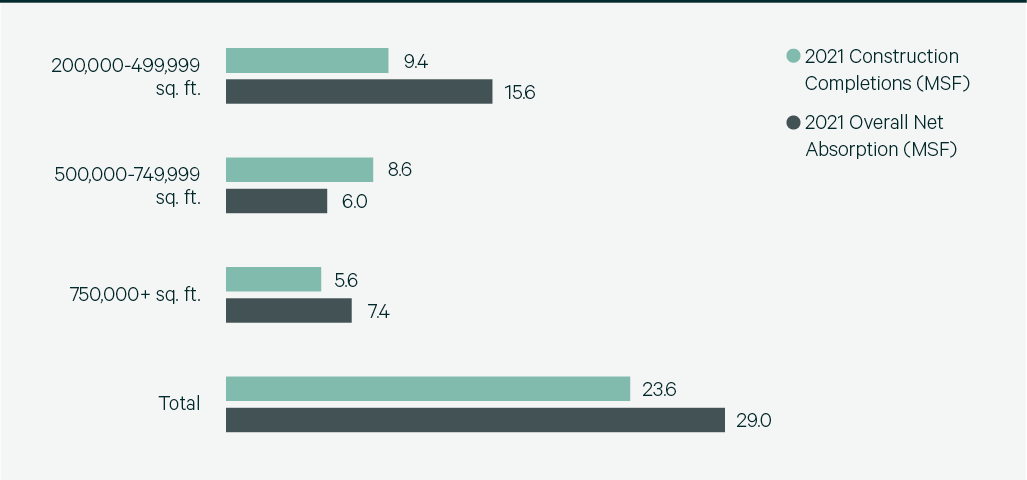
Source: CBRE Research.
Figure 8: Direct Vacancy Rate by Size Range

Source: CBRE Research.
Figure 9: Under Construction & Percentage Preleased

Source: CBRE Research.
Figure 10: Historical First Year Taking Rents (psf/yr)
Note: Includes first year taking rents for leases 200,000 sq. ft. and above.
Source: CBRE Research.
Explore Big Box Insights by Market

Houston’s pro-business environment, favorable real estate conditions and population growth continue to drive its thriving big-box industrial market.
Memphis has the nation’s busiest cargo airport, five Class I railroads and a location within a two-day drive to 70% of the U.S.
Kansas City is one of the fastest-growing U.S. industrial markets, with developers delivering over 70 million sq. ft. of Class A space over the past decade.
Contacts
James Breeze
Vice President, Global Industrial and Retail Research

John Morris
President, Americas Industrial & Logistics, Advisory Services