Intelligent Investment
Omicron Impact on U.S. Office Demand Persists in January
CBRE Pulse of U.S. Office Demand
February 17, 2022 5 Minute Read
Read the full report and data for all 12 markets
The CBRE Pulse of U.S. Office Demand slowed in January, as occupiers paused on leasing activity in the face of the omicron surge. However, an uptick in tenant requirements suggests the slowdown in leasing is likely to be temporary. Occupiers continue to pursue longer-term plans to take on new office space. Despite the slowdown, markets that had been making strong progress toward recovery largely maintained their positions, while markets that have been struggling to gain momentum continued to do so.
What is the CBRE Pulse Report?
To gauge the pace of recovery, CBRE has created three indices for the 12 largest U.S. office markets—Atlanta, Boston, Chicago, Dallas/Fort Worth, Denver, Houston, Los Angeles, Manhattan, Philadelphia, San Francisco, Seattle and Washington, D.C. Using CBRE data, these indices measure office market activity each month and provide early indications of when and where momentum in office demand may be shifting. These metrics—space requirements of active tenants in the market (TIM), leasing activity and sublease availability—provide a clear picture of office demand amid the COVID-19 pandemic.
January Findings
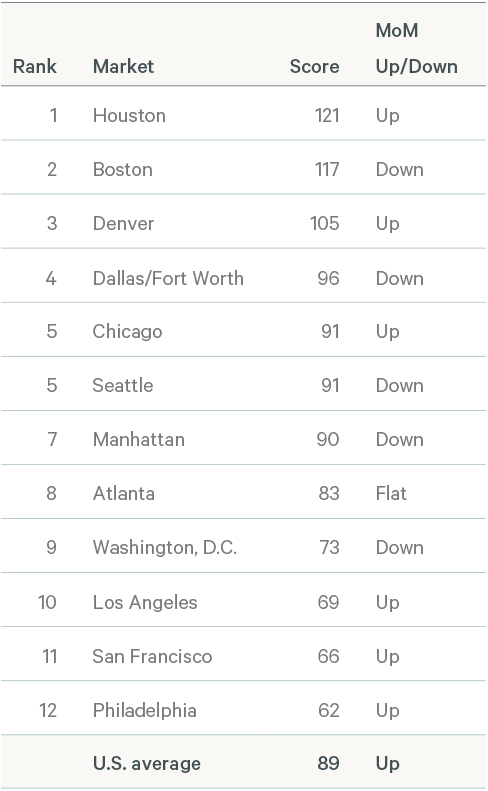
The U.S. Tenants in the Market (TIM) Index increased to 89, up three points from December. Three markets—Houston (121), Boston (117) and Denver (105)—exceeded pre-pandemic levels, while another four—Dallas/Fort Worth (96), Seattle (91), Chicago (91) and Manhattan (90)—were 90% or more of their pre-pandemic levels. Overall, seven markets saw their TIM index levels increase or remain stable, indicating that a significant share of occupiers are staying the course on longer-term plans for pursuing new leases.
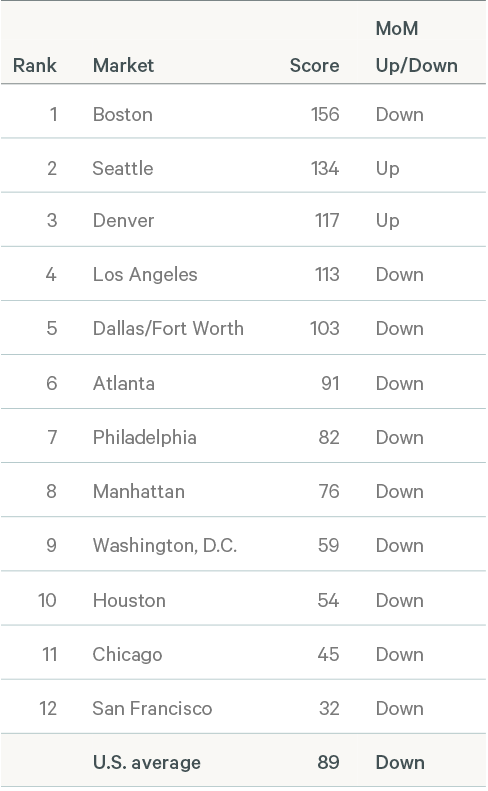
The U.S. Leasing Index declined to 89 in January, down 8 points from December, as many occupiers paused on signing new leases amid the omicron surge. The caution was broadly evident, as 10 of the 12 markets saw their Leasing Index levels fall, with the biggest declines in Boston (156, down 44 points), Manhattan (76, down 24 points), and Atlanta (90, down 21 points). Meanwhile, Denver (117) saw a strong surge in its Leasing Activity index, while Seattle saw modest improvement.
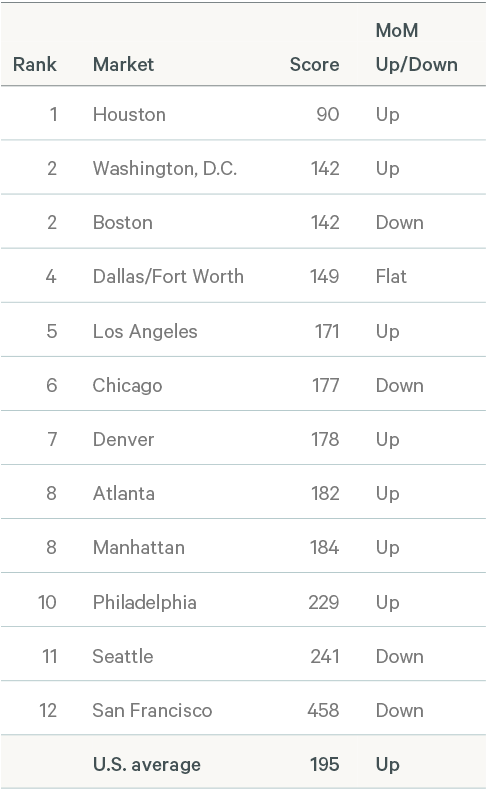
The U.S. Sublease Availability Index increased 2 points to 195 in January. The index has bounced around this same level for several months and is down a modest 11 points since peaking in June 2021, demonstrating the challenge that surplus sublease space poses to the U.S. office market recovery. Seven of the 12 markets saw their sublease inventory increase in January, while four saw decline and one market was flat.
U.S. Average Performance Index
Figure 1: Indexed Average Performance of Sublease Availability, TIM and Leasing Activity for the Top 12 U.S. Markets
Source: CBRE Research, January 2022.
Office Demand Expected to Regain Momentum
The slowdown in office demand that was evident in December and January is likely to linger through February. However, with the omicron surge in COVID infections now declining rapidly, many occupiers are already looking ahead to re-starting their delayed plans for a large-scale return to the office. This positive development, along with the continued economic growth, should spur an uptick in office leasing by the second half of Q1 2022. The continued surplus of sublease space remains an enticement to occupiers looking to take advantage of favorable market conditions.
Figure 2: January Office Market Recovery Scale, Top U.S. Markets

Source: CBRE Research, January 2022.
Tenants in the Market Index
Figure 3: Indexed Square Footage of Tenant Requirements Compared with 2018/2019 Average
Source: CBRE Research, January 2022.
The U.S. TIM Index improved in January to 89, up three points from December. The increase in tenant requirements is an early indicator that tenants may now be looking past omicron toward future leasing.
Three markets—Houston (121), Boston (117) and Denver (105)—had TIM levels that exceeded their pre-pandemic levels, while another three—Dallas/Fort Worth (96), Seattle (93), Chicago (91) and Manhattan (90)—were at 90% or more of their pre-pandemic levels. Chicago’s index rose 13 points, the biggest improvement month-over-month, and continuing its trend of strong, steady improvement. Denver saw a significant 12-point jump in January.
Overall, six of the 12 markets saw their TIM levels increase in January, including San Francisco (66) and Philadelphia (62) where TIMs recovery has been slow. Progress toward recovery has also stalled somewhat in other markets, including Atlanta (83) and Washington, D.C. (73).
Figure 4: January 2022 TIM Index–Top 12 U.S. Markets

Source: CBRE Research, January 2022.
TIM Index methodology note: CBRE tracks the total square footage of requirements from active tenants in the market, with minimum requirements of 10,000 sq. ft. The TIM Index compares the total monthly TIM requirements to a pre-pandemic baseline, which is the average of TIM requirements recorded by CBRE in 2018 and 2019. The index level for the baseline is 100. In most cases, when tenant requirements are given as a range, the index uses the minimum square footage., However, Seattle records TIM using the average requirement within the tenants' size range, while Philadelphia uses the maximum square footage.
Leasing Activity Index
Figure 5: Indexed Monthly Leasing by Market Compared with 2018/2019 Average
Source: CBRE Research, January 2022.
Occupier concerns over the surging COVID-19 omicron variant persisted in January, contributing to an 8-point decline in the U.S. Leasing Activity Index2 to a level of 89. The caution was widespread, as 10 of the 12 markets saw their leasing levels decline month-over-month.
Despite the broad slowdown, several markets maintained Leasing Index levels above their pre-pandemic baseline, including Boston (156), Los Angeles (113), and Dallas/Fort Worth (103). Seattle (134) and Denver (117) were the only markets to see their leasing index levels increase in January.
The January slowdown in leasing was most evident in Atlanta (91) and Manhattan (76), where Leasing Index levels fell 21 and 24 points, respectively. Both markets had seen leasing pick up significantly in the latter half of 2021, and expectations are for these markets to bounce back quickly as omicron further recedes.
Figure 6: January 2022 Leasing Activity Index–Top12 U.S. Markets

Source: CBRE Research, January 2022.
Leasing Index methodology note: Leasing activity includes all new leases, expansions and renewals of 10,000 sq. ft. or more that close each month. The Leasing Activity Index uses a rolling three-month average of leasing activity. Most markets the weighted 20% for the current month, 50% for the previous month and 30% for two months prior. For New York and Boston, where more accurate leasing data is available by the end of each month, the weights are 50% for the current month, 30% for the previous month and 20% for two months prior. The monthly rolling average is compared with a pre-pandemic baseline, which is the average monthly leasing activity between 2018 and 2019. The index level for the baseline is 100.
Sublease Availability Index
Figure 7: Indexed Sublease Availability by Market Compared with 2018/2019 Average
Source: CBRE Research, January 2022.
The U.S. Sublease Availability Index climbed 2 points in January to 195—a modest increase over the pandemic low point reached in December. The uptick was driven by a slowdown in the absorption of existing sublease space amid omicron, rather than by significant new sublease space coming on the market.
Seven markets saw their Sublease Index levels increase month-over-month. The biggest increase was in Atlanta (182), up 16 points, followed by Los Angeles (171), up 13 points and Philadelphia (229), up 9 points. Houston (90), Washington D.C. (142), Denver (178) and Manhattan (184) also saw modest increases in their sublease availability index levels.
Four markets bucked the national trend, with Sublease Index declines in January, including Boston (142), Chicago (177), Seattle (241) and San Francisco (458).
The glut of surplus sublease space remains the biggest challenge facing the U.S. Office market heading into 2022.
Figure 8: January 2022 Sublease Availability Index–Top 12 U.S. Markets

Source: CBRE Research, January 2022.
Sublease Index methodology note: Sublease availability measures the total square footage of sublease space available for occupancy. The Sublease Availability Index compares monthly sublease availability totals with a pre-pandemic baseline, which is the average amount of sublease space available in 2018 and 2019. The index level for the baseline is 100.
Note: In contrast to the Leasing and TIM Indices, a higher score on the Sublease Index is considered undesirable as it reflects an increase in available sublease space.
Office Demand Expected to Regain Momentum as Omicron Fades
The slowdown in office demand that was evident in December and January is likely to linger through February. However, with the omicron-driven surge in COVID infections declining rapidly, many occupiers are looking ahead to re-starting their delayed plans for a large-scale return to the office. This positive development, along with continued economic growth, will spur an uptick in office leasing by the second half of Q1 2022. The persistent surplus of sublease space remains an enticement to occupiers looking to take advantage of favorable market conditions.
Related Insights
- Brief | Intelligent Investment
Omicron Surge Slows U.S. Office Demand in December
January 26, 2022 5 Minute Read
The CBRE Pulse of U.S. Office Demand slowed moderately in December, likely reflecting renewed occupier caution over the COVID-19 omicron surge.
- Brief | Intelligent Investment
U.S. Office Demand Stable in November Despite COVID Concerns
December 20, 2021 5 Minute Read
The CBRE Pulse of U.S. Office Demand showed little change in November.
- Brief | Intelligent Investment
Tenant Inquiries Rise but Sublease Challenges Remain
November 22, 2021 8 Minute Read
The CBRE Pulse of U.S. Office Demand showed modest improvement in October with a notable uptick in new leasing requirements, while leasing activity and sublease...
- Brief | Intelligent Investment
U.S. Office Demand Recovery Firmly Underway
October 26, 2021 5 Minute Read
After slowing amid the COVID surge in late summer, the CBRE Pulse of U.S. Office Demand improved considerably in September.
- Brief | Intelligent Investment
U.S. Office Demand Slows Modestly in August
September 23, 2021 5 Minute Read
The CBRE Pulse of U.S. Office Demand slowed modestly in August. This reflected slower job growth and a resurgence in COVID-19 infections that delayed occupiers'...
- Brief | Intelligent Investment
Modest Gains in July, Though Progress Threatened by Delta Surge
August 26, 2021 20 Minute Read
As the U.S. economy improves and vaccination levels increase, there are signs that the U.S. office market is turning a corner, though the latest Covid surge is ...


