Intelligent Investment
U.S. Office Demand Stable in November Despite COVID Concerns
CBRE Pulse of U.S. Office Demand
December 20, 2021 5 Minute Read
Read the full report and data for all 12 markets
The CBRE Pulse of U.S. Office Demand showed little change in November. Revisions to October leasing activity data show that the market performed better than originally thought in the early fall. November’s stability shows continued office demand recovery, though performance varies noticeably from market to market.
What is the CBRE Pulse Report?
To gauge the pace of recovery, CBRE has created three indices for the 12 largest U.S. office markets—Atlanta, Boston, Chicago, Dallas/Fort Worth, Denver, Houston, Los Angeles, Manhattan, Philadelphia, San Francisco City, Seattle and Washington, D.C.
Using CBRE data, these indices measure office market activity each month and provide early indications of when and where momentum in office demand may be shifting. These metrics—space requirements of active tenants in the market (TIM), leasing activity and sublease availability—provide a clear picture of office demand amid the COVID-19 pandemic.
November Findings
The U.S. Tenants in the Market (TIM) Index was unchanged in November at a level of 85. Half of the 12 markets tracked by CBRE reached TIM Index levels of over 90, a new milestone toward pandemic recovery. Dallas had the biggest increase in TIM requirements in November, with Chicago and Houston also seeing notable improvement.
The U.S. Leasing Index fell by 2 points in November to a level of 100, with revised October data showing stronger demand recovery than initially indicated earlier in the fall. Boston again led the leasing index, while Los Angeles made a strong comeback from the delta-related slowdown in September and October. Eight of the 12 Pulse markets had November Leasing Activity Index levels above 90.
Nevertheless, the largest U.S. office markets continue to struggle under the weight of surplus sublease inventory, as the Sublease Availability Index increased by 1 point in November to a level of 197. Only four markets saw their sublease indices decline, with the remaining eight markets either flat or up slightly.
Note: All market data is for the metropolitan area with the exception of Manhattan and also San Francisco, which includes the city and the peninsula.
U.S. Average Performance Index
Figure 1: Indexed Average Performance of Sublease Availability, TIM, and Leasing Activity for the Top 12 U.S. Markets
Source: CBRE Research, November 2021.
November Demand Recovery by Market
Boston remained the leader in office space demand recovery in November, while several other markets showed encouraging signs of progress. Dallas/Fort Worth showed the most improvement. Los Angeles also improved markedly due to a strong rebound in leasing activity, while Atlanta lost ground as leasing there slowed. Conversely, San Francisco and Philadelphia continued to struggle with sluggish TIM activity and persistently high levels of sublease availability. However, Philadelphia had a strong increase in leasing activity last month.
Figure 2: November Office Market Recovery Scale, Top U.S. Markets

Source: CBRE Research, November 2021.
Tenants in the Market Index
Figure 3: Indexed Square Footage of Tenant Requirements Compared with 2018/2019 Average
Source: CBRE Research, November 2021.
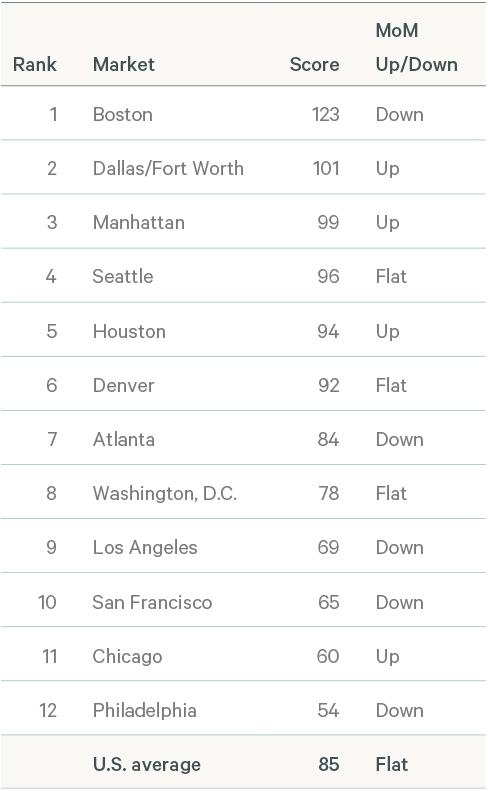
The U.S. TIM Index1 held steady in November at 85. Although Boston’s index level fell by 11 points to 123, it remained the highest of all 12 markets tracked by CBRE. Five markets showed monthly improvement in TIM activity. Dallas/Fort Worth (101) had the biggest increase of 14 points to reach second place, while Manhattan (99) ranked third, continuing a steady pace of TIM improvement that began in August. Houston (94) and Chicago (60) also saw noticeable improvement in November, each gaining 5 points.
November marked a milestone in TIM recovery, with half of the markets in the Pulse survey achieving TIM levels of more than 90.
Six markets saw their TIM Index levels decline in November, most notably Atlanta’s 9-point drop to 84. San Francisco recorded a 6-point drop to 65 and has seen six consecutive months of decline since May when its index level peaked at 101.
Figure 4: November 2021 TIM Index–Top 12 U.S. Markets

Source: CBRE Research, November 2021.
1CBRE tracks the total square footage of requirements from active tenants in the market with minimum requirement of 10,000 sq. ft. The TIM Index compares the total monthly TIM requirements to a pre-pandemic baseline, which is the average of TIM requirements recorded by CBRE in 2018 and 2019. The index level for the baseline is 100. In most cases, when tenant requirements are given as a range, the index uses the minimum square footage. However, Seattle records TIM using the average requirement within the tenants’ size range, while Philadelphia uses the maximum square footage.
Leasing Activity Index
Figure 5: Indexed Monthly Leasing by Market Compared with 2018/2019 Average
Source: CBRE Research, November 2021.
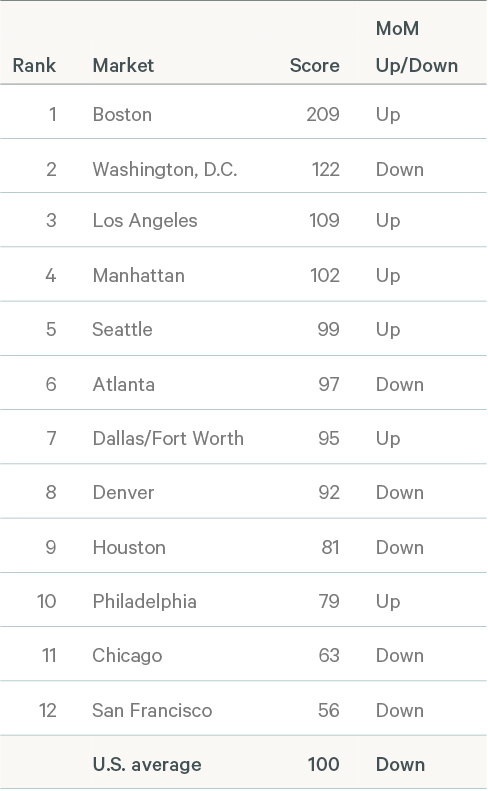
CBRE’s U.S. Leasing Activity Index2 fell by 2 points in November to a level of 100, after a 6-point upward revision to the October index level. Boston (209) had another stellar month, improving by 38 points and topping the list once again. Three other markets—Washington, D.C. (122), Los Angeles (109) and Manhattan (102)—all surpassed pre-COVID baseline levels in November, with Seattle (99) nearly back on par. Atlanta (97), Dallas/Fort Worth (95) and Denver (92) rounded out the list of the eight markets with November index levels of above 90.
Six markets saw improved leasing index levels in November. After Boston, Los Angeles was the second most improved market with a 21-point increase, following declines in September and October due to a surge of COVID infections. Philadelphia (79) gained 12 points in November, followed by Manhattan (+11), Dallas/Fort Worth (+8) and Seattle (+4).
The remaining six markets had declines in November leasing index levels. Atlanta (97) had the biggest decrease of 57 points after some very large leases propelled the market past pre-COVID levels in the late summer and early fall. Houston (81) also saw a significant slowdown, with its leasing index falling 26 points. The two lowest-ranking markets also declined, with Chicago (63) falling 17 points and San Francisco (56) down 7 points.
Figure 6: November 2021 Leasing Activity Index – Top12 U.S. Markets

Source: CBRE Research, November 2021.
2Leasing activity includes all new leases, expansions and renewals of 10,000 sq. ft. or more that close each month. The Leasing Activity Index uses a rolling three-month average of leasing activity. Most markets are weighted 20% for the current month, 50% for the previous month and 30% for the prior two months. For New York and Boston, where more accurate leasing data is available by the end of each month, the weights are 50% for the current month, 30% for the previous month and 20% for the prior two months. The monthly rolling average is compared with a pre-pandemic baseline, which is the average monthly leasing activity between 2018 and 2019. The index level for the baseline is 100.
Sublease Availability Index
Figure 7: Indexed Sublease Availability by Market Compared with 2018/2019 Average
Source: CBRE Research, November 2021.
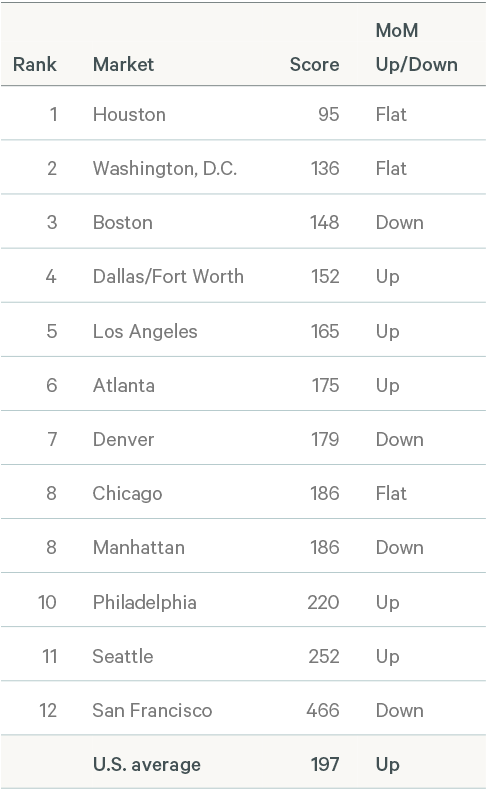
After improving modestly over the summer and early fall, the U.S. Sublease Availability Index rose 1 point for the second consecutive month to a level of 197 in November.
Eight markets saw either no or modest sublease space increases in November. Among the markets with more sublease availability, only Atlanta (175) saw a significant increase (14 points), following four months of improving sublease conditions.
Just four markets saw their sublease index levels drop in November. San Francisco (466) showed the biggest improvement with a 9-point drop, although it still maintained the highest sublease availability index level by a wide margin. Manhattan (186), Denver (179) and Boston (148) each saw their index levels fall by 3 points in November. Denver has seen four consecutive months of declining sublease availability, while Manhattan has had six months of slow but steady decline.
Figure 8: November 2021 Sublease Availability Index – Top 12 U.S. Markets

Source: CBRE Research, November 2021.
Note: In contrast to the Leasing and TIM Indices, a higher score on the Sublease Index is considered undesirable as it reflects an increase in available sublease space.
Office Demand Likely Will Improve
Demand for office space will likely continue to improve as more workers return to the office and occupiers take advantage of favorable market conditions. The outlook depends on how omicron, and likely other new COVID variants, impact society. With the rollout of vaccine boosters and effective medical advancements, occupiers should gain confidence in making long-term leasing decisions.
Related Insights
- Brief | Intelligent Investment
Tenant Inquiries Rise but Sublease Challenges Remain
November 22, 2021 8 Minute Read
The CBRE Pulse of U.S. Office Demand showed modest improvement in October with a notable uptick in new leasing requirements, while leasing activity and sublease...
- Brief | Intelligent Investment
U.S. Office Demand Recovery Firmly Underway
October 26, 2021 5 Minute Read
After slowing amid the COVID surge in late summer, the CBRE Pulse of U.S. Office Demand improved considerably in September.
- Brief | Intelligent Investment
U.S. Office Demand Slows Modestly in August
September 23, 2021 5 Minute Read
The CBRE Pulse of U.S. Office Demand slowed modestly in August. This reflected slower job growth and a resurgence in COVID-19 infections that delayed occupiers'...
- Brief | Intelligent Investment
Modest Gains in July, Though Progress Threatened by Delta Surge
August 26, 2021 20 Minute Read
As the U.S. economy improves and vaccination levels increase, there are signs that the U.S. office market is turning a corner, though the latest Covid surge is ...


