Intelligent Investment
Modest Gains in July, Though Progress Threatened by Delta Surge
CBRE Pulse of U.S. Office Demand
August 26, 2021 20 Minute Read
Read the full report and data for all 12 markets
As the U.S. economy improves and vaccination levels increase, there are signs that the U.S. office market is turning a corner, though the latest Covid surge is a headwind.
To gauge the pace of recovery, CBRE has developed three indices for the 12 largest U.S. office markets—Atlanta, Boston, Chicago, Dallas/Fort Worth, Denver, Houston, Los Angeles, Manhattan, Philadelphia, San Francisco, Seattle and Washington, D.C. Using CBRE data, these monthly indices illuminate the state of office market activity and provide early indications of when and where momentum in office market demand may be shifting.
Three metrics—space requirements of active tenants in the market (TIM), leasing activity and sublease availability—paint a picture of generally improving office demand in 2021. TIM, a leading indicator of occupier interest, and leasing activity have both shown gradual improvement in 2021.
The biggest challenge remains the sublease space overhang across the U.S., which will take several quarters to work down. Nevertheless, some markets are beginning to see sublease space decline, while new sublease additions are slowing in others.
The recent flare-up in Covid cases, particularly in the Deep South and Florida, is a headwind. There could be an impact on August and/or September data as occupiers delay their return-to-the-office plans and defer long-term leasing decisions. However, early signs that the recent Covid resurgence may be peaking is a cause for optimism.
U.S. Average Performance Index
MODEST, GRADUAL PROGRESS IN OFFICE DEMAND SEEN ACROSS THE TOP U.S. MARKETS
Figure 1: Indexed Average Performance of Sublease Availability, TIM, and Leasing for the Top 12 U.S. Markets
Source: CBRE Research, July 2021.
July Demand Recovery by Market
Boston and Los Angeles stand out as the markets that have best withstood the downturn and are in relatively strong position as of July 2021. Though gains in leasing have been modest to date, Dallas/Fort Worth and Washington, D.C. are showing positive signs relative to other top markets, owing to their strong TIM levels and comparatively modest supply of available sublease space. Strong leasing of late has helped Seattle and Atlanta make gains relative to other markets. Even Manhattan, Denver and San Francisco, the markets that saw the most pronounced Covid-induced decline in tenant activity, have begun showing early signs of improvement.
Figure 2: July Office Market Recovery Scale, Top U.S. Markets
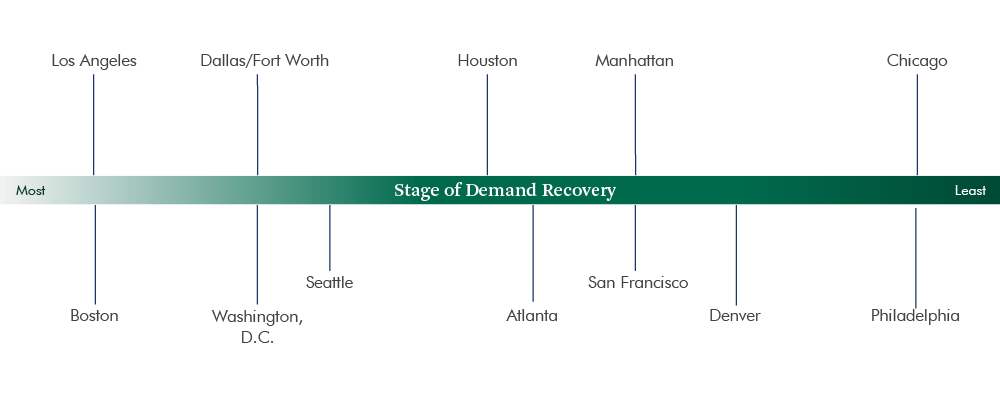
Source: CBRE Research, July 2021.
Tenants in the Market Index
Figure 3: Indexed Square Footage of Tenant Requirements Compared with 2018/2019 Average
Source: CBRE Research, July 2021.
Throughout 2020, the largest office markets saw tenants delay or cancel plans for new leases and expansions amid the pandemic, causing the volume of active TIM requirements to fall well below pre-pandemic levels. Since hitting a low point of 71 in January 2021, the U.S. TIM Index1 (baseline: 100) shows that the 12 largest office markets have turned a corner. The TIM index rose to 85 by July, the sixth straight monthly gain.
Top-performing Boston (125) has maintained strong TIM activity thanks to the large and growing life sciences sector that continued to expand throughout 2020 and 2021. Boston’s TIM index has averaged a very strong 115 since March 2020 and has grown steadily in recent months.
In the first seven months of 2021, seven of the 12 markets showed considerable monthly improvement in TIM volume. New large tenant requirements arrived in both Denver (97) and Dallas/Fort Worth (87) in July, boosting their indices to their highest levels in over a year. San Francisco (86), Manhattan (81), Seattle (79), and Atlanta (69) have also made steady gains in 2021. Additionally, Chicago (71) had a big jump of 11 points in June alone to reach 74, its highest index level of the pandemic era, before declining modestly in July.
Washington D.C. (88) has maintained a relatively high TIM Index level for most of the pandemic period. D.C.’s index level ranged from 79 to 94 between October 2020 and March 2021. Additional indicators point to growing tenant interest, as space tours at Washington, D.C. properties have increased steadily throughout 2021.
Overall, most of these 12 markets should see increased leasing activity in the coming months, as the increasing volume of TIM transitions to signed leases.
Figure 4: July 2021 TIM Index – Top 12 U.S. Markets
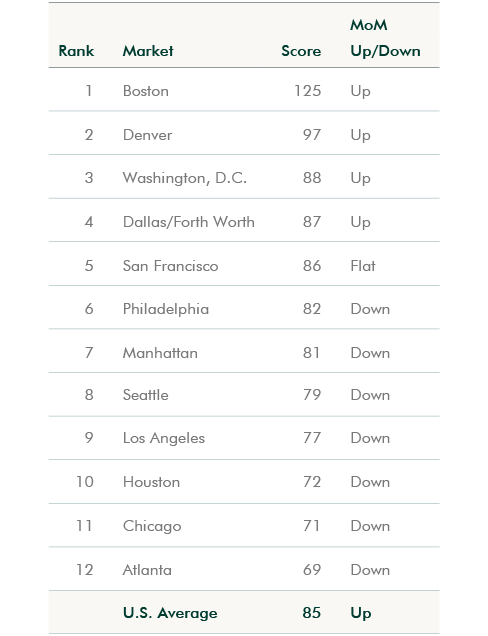
Source: CBRE Research, July 2021.
1 TIM Index methodology note: CBRE tracks the total square footage of requirements from active tenants in the market, with minimum a requirement of 10,000 sq.ft. The TIM index is created by comparing the total monthly TIM requirements to a pre-pandemic baseline, which is the average of TIM requirements recorded by CBRE in 2018 and 2019. The index level for the baseline is100. In most cases, when tenant requirements are given as a range, the Index uses the minimum square footage. However, Seattle records TIM using the average requirement within the tenants’ size range, while Philadelphia uses the maximum square footage..
Leasing Activity Index
Figure 5: Indexed Monthly Leasing by Market Compared with 2018/2019
Source: CBRE Research, July 2021.
Like TIM, monthly leasing activity has begun to rebound from its pandemic low. CBRE’s Leasing Activity Index2 stood at 72 in July—up from its low of 52 in December 2020. Los Angeles (140), Seattle (107), Atlanta (92), and Boston (87) all exceeded the U.S. average in July. Los Angeles and Boston have exhibited strength throughout 2021, with average leasing activity index levels of 110 and 104, respectively.
The other eight markets trail behind the top markets, though many of them have seen modestly improved Leasing Activity Indices. Houston (64), Washington, D.C. (63), San Francisco (61), Dallas/Fort Worth (61) and Manhattan (60) have all recovered more than halfway toward pre-pandemic leasing levels.
Chicago (44) has seen uneven progress, with declines in May and June, before a modest rebound in July. Despite the recent ups and downs, Chicago’s Index is higher than the mid to low 20s it recorded in late 2020 and early 2021
FIGURE 6: July 2021 Leasing Activity Index – Top 12 U.S. Markets
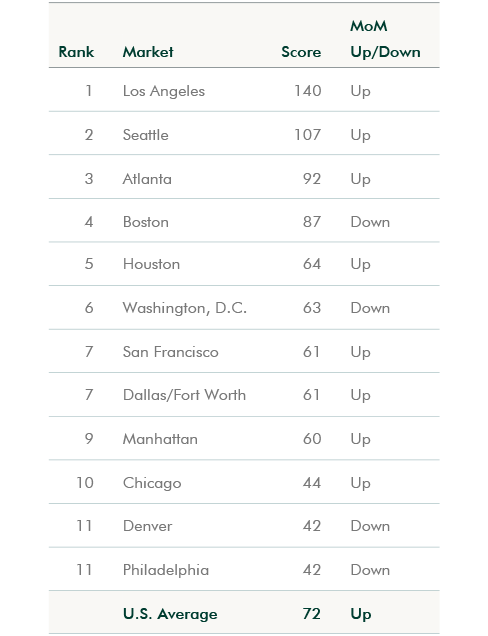
Source: CBRE Research, July 2021.
2 Leasing Index methodology note: Leasing activity includes all new leases, expansions and renewals of 10,000 sq. ft. or more that close each month. The Leasing Activity Index uses a rolling three-month average of leasing activity. For most markets the weighting 20% for the current month, 50% for the previous month and 30% for two months prior. For New York and Boston, where leasing data is available by the end of each month, the weights are 50% for the current month, 30% for the previous month and 20% for two months prior. The monthly rolling average figure is compared with a pre-pandemic baseline which is the average monthly leasing activity in 2018 and 2019. The index level for the baseline is 100.
Sublease Availability Index
Figure 7: Indexed Sublease Availability by Market Compared with 2018/2019 Average
Source: CBRE Research, July 2021.
The U.S. Sublease Availability Index3 was at 194 for July. Nearly all 12 markets still have relatively high amounts of sublease availability since many occupiers reduced their office footprints when they shifted to more remote working during the pandemic.
However, there are signs of improvement. After rising by an average monthly rate of nearly 6% for most of 2020, U.S. Sublease Availability Index growth slowed to an average of less than 2% per month in 2021. July 2021 marked the first month that the index level fell to 194 from the peak level of 195 in June since the pandemic began.
As of July, six of the 12 markets have an index reading lower than the U.S. average: Houston (96), Washington D.C. (136), Dallas/Ft. Worth (156), Los Angeles (160), Boston (164) and Chicago (187). Manhattan (194) was on par with the U.S. average, while Atlanta (195) was just a single point above.
Houston had the lowest Sublease Availability index in July; however this market has seen its sublease availability grow over the pandemic period, hitting its highest level in May 2021 and remaining constant for two months. While currently available sublease space is below its peak in 2016, Houston’s sublease inventory remains historically high. Meanwhile, Atlanta, Boston, Chicago, Dallas/Fort Worth, Los Angeles and Manhattan saw the pace of sublease growth moderate in the spring, and the Index levels all fell in July.
Denver (207), Philadelphia (214), Seattle (285) and San Francisco (337) have sublease availability index levels above the U.S. average. Seattle saw decline in July, falling from 297 in June. San Francisco’s index dropped 28 points in June, its first monthly decline in the pandemic period, before increasing again in July. In Denver and Philadelphia, total sublease availability has continued to rise in recent months.
Figure 8: July 2021 Sublease Availability Index – Top 12 U.S. Markets
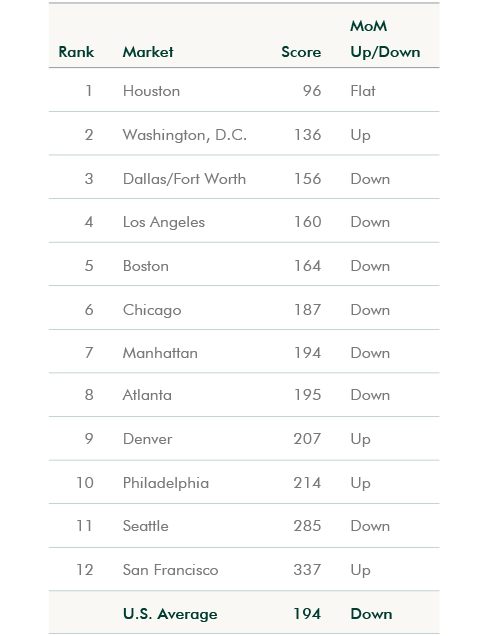
Source: CBRE Research, July 2021.
3 Sublease Index methodology note: Sublease availability measures the total square footage of sublease space available for occupancy. The Sublease Availability Index compares monthly sublease availability totals with a pre-pandemic baseline, which is the average amount of sublease space available in 2018 and 2019. The index level for the baseline is set to 100.
Office Markets Poised for Improvement, Though Delta Variant Is a Headwind
At the end of July 2021, the 12 largest U.S. office markets are recovering by varying degrees. This reflects the loosening of Covid restrictions and strengthening economic growth as more people are vaccinated. However, this progress could be hampered if the recent sharp rise in infections due to the delta variant persists.
We do not foresee widespread lockdowns reminiscent of the spring of 2020. Absent such, most of the largest U.S. office markets appear poised for improvement, based on growing tenant interest, increased leasing activity and an ebbing of sublease space additions.
Related Insights
For More Information, Please Contact
Nicole La Russo
U.S. Head of Field Research & Data Intelligence