Intelligent Investment
Higher Vacancy & Interest Rates Contribute to Less Industrial Construction
March 14, 2024 2 Minute Read

Average quarterly industrial construction starts are expected to drop to less than 50 million sq. ft. this year from more than 100 million sq. ft. in 2022 due to high interest rates, a less robust lending environment and lower demand from occupiers. As a result, annual construction completions are expected to fall to less than 300 million sq. ft. both this year and next from a record 612 million sq. ft. in 2023.
Nearly 1.2 billion sq. ft. of new industrial space has been added to the U.S. market over the past two years in response to surging pandemic-related demand for warehouse & distributions facilities.
Figure 1: Industrial Construction Completions vs Overall Vacancy Rate
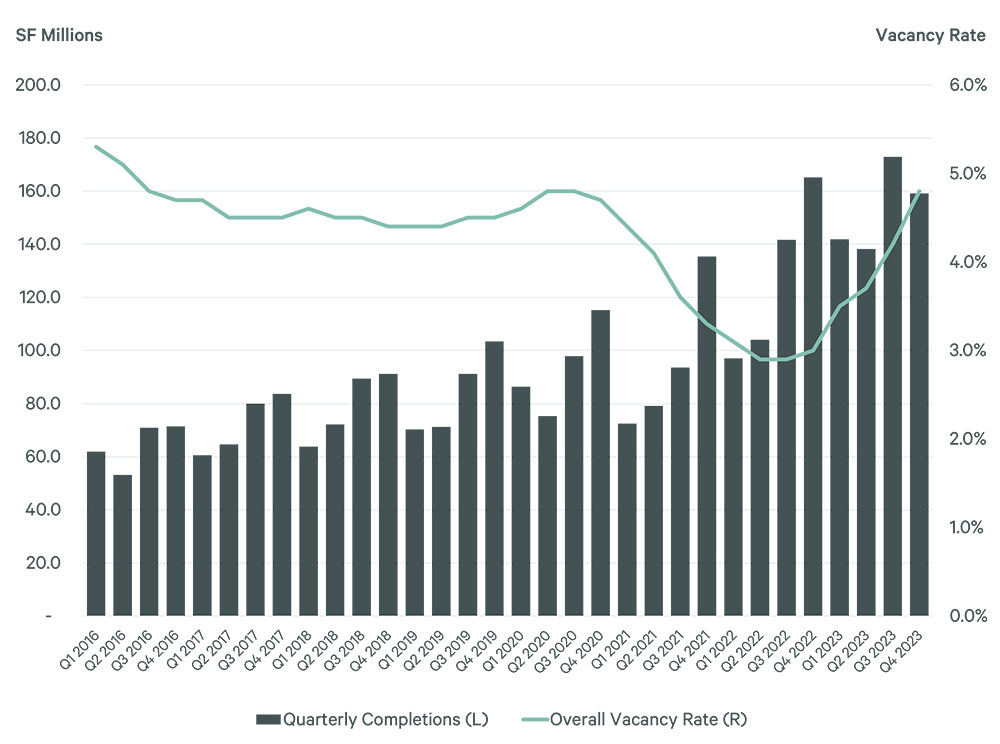
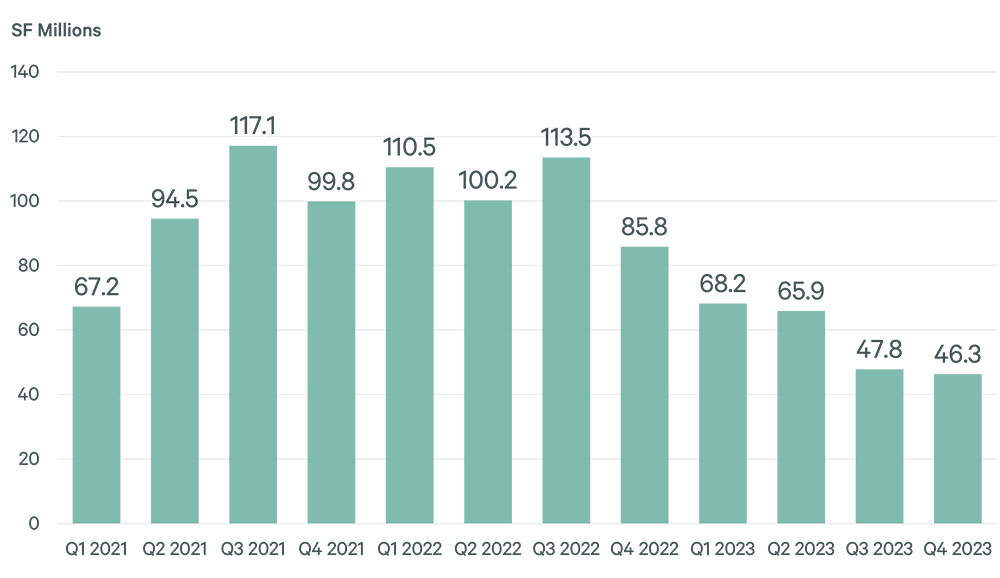
Total annual industrial leasing activity fell to 790 million sq. ft. in 2023 from a record 1 billion sq. ft. in 2021 and was not enough to offset the large amount of new supply. As a result, the overall industrial vacancy rate jumped by 180 basis points (bps) last year to 4.8%, returning to near its 10-year average of 4.7%. Developers predictably became more hesitant to break ground and construction starts fell to 46.3 million sq. ft. by Q4 2023 from a quarterly average of 102.5 million sq. ft. in 2022.
Figure 2: Annual Industrial Leasing Activity
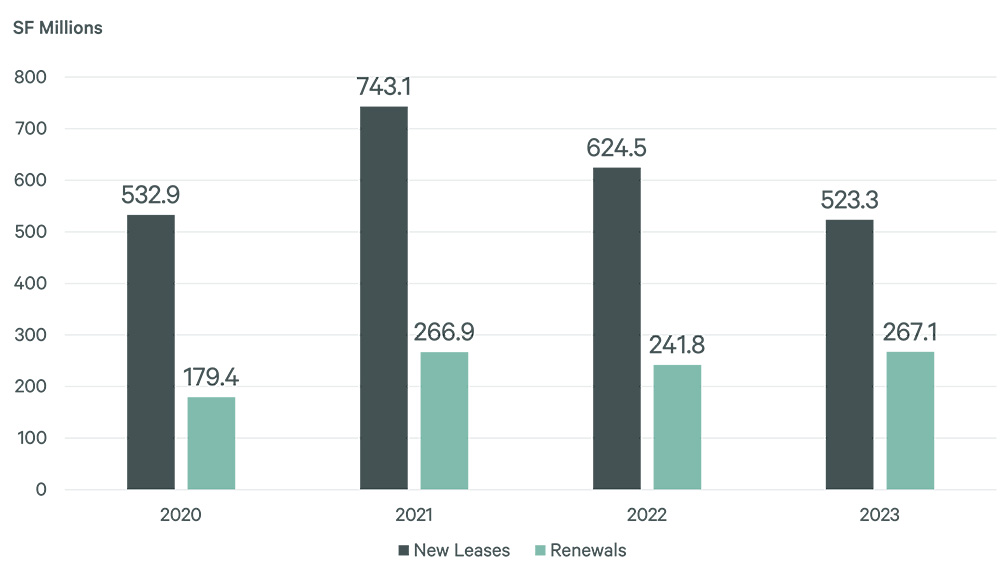
Figure 3: Industrial Construction Starts by Quarter
While higher vacancies have contributed to developers’ “risk-off” mentality, this is one of many factors that have caused the sharp drop in construction starts. These include:
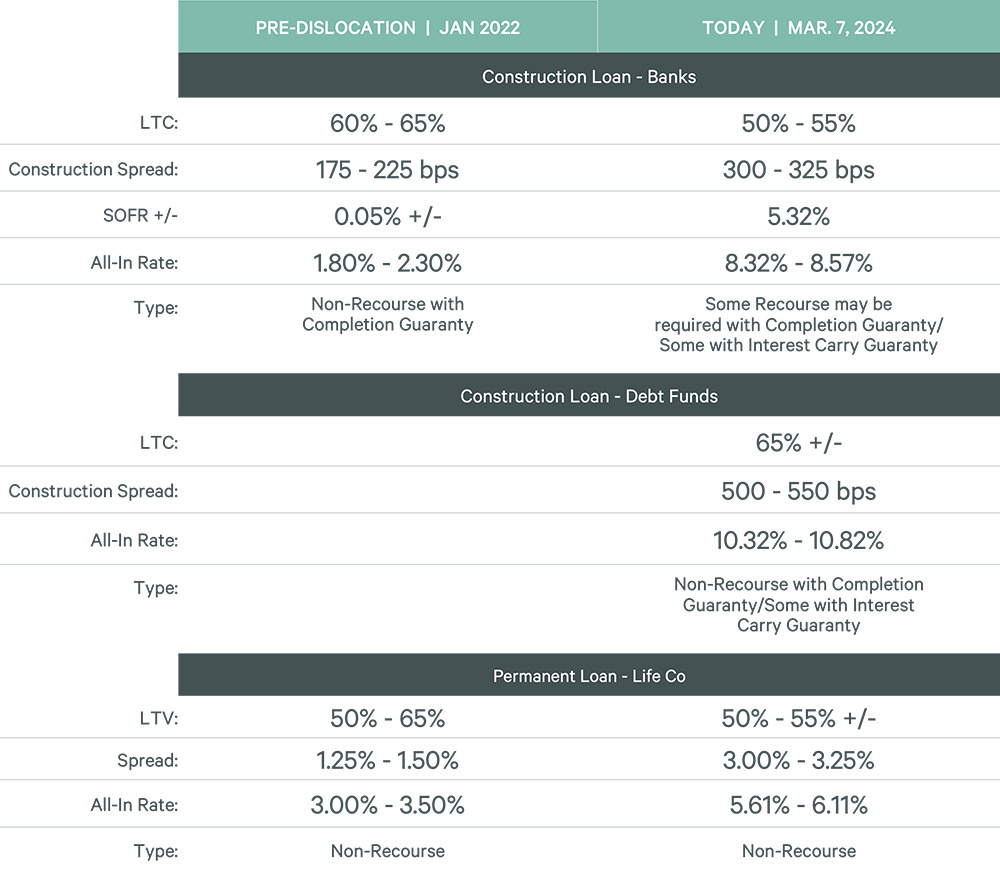
- The quadrupling of all-in interest rates for construction loans since January 2022.
- Higher return-on-cost requirements from capital partners.
- Lower potential returns on investment due to less demand and rent growth.
- Dramatically decreased bank construction lending, although debt funds and certain life insurance companies remain active.
- Lower loan-to-cost availability that requires more equity.
Figure 4: General Indicative Debt Guidance for Industrial Assets
Fewer construction starts and completions will give the market time to absorb the excess space that was delivered over the past two years. This in turn will give an advantage to the fewer projects that break ground today in a less-competitive supply environment.
Related Services
- Property Type
Industrial & Logistics
We represent the largest industrial real estate platform in the world, offering an integrated suite of services for occupiers and investors.
Related Insights
-
Article | Intelligent Investment
Southern California on Sale: Industrial & Logistics Perspective
February 29, 2024
Leading industrial investment specialist Barbara Perrier provides insights on the investment activity outlook, which investors are active today, and the opportunities of the Southern California market.
-

Third-party logistics (3PL) warehouse operators strengthen supply chain resiliency through a range of fulfillment and storage solutions.
-
Economic uncertainty and less need for additional product inventory resulted in fewer industrial leases of 1 million sq. ft. or more in 2023 versus 2022.
-
Multi-story industrial buildings are a niche subtype that comprise less than 1% of U.S. industrial facilities, but burgeoning demand is leading to new construction projects.
Contacts
James Breeze
Vice President, Global Industrial and Retail Research

John Morris
President, Americas Industrial & Logistics, Advisory Services