Intelligent Investment
Life Sciences Construction Benchmarks & Trends 2024
Changing Dynamics Amid Uncertain Times
October 1, 2024 8 Minute Read

Executive Summary
- The percentage of lab/R&D space under construction that is being converted from other uses has decreased drastically over the past 24 months.
- The percentage of lab/R&D space under construction that is build-to-suit (vs. speculative) has normalized to levels seen five years ago.
- While the peak of lab/R&D construction has passed, the top three markets—Boston-Cambridge, San Francisco Bay Area and San Diego—will likely take several years to absorb the oversupply.
- Fit-out costs, along with tenant improvement allowances, have increased drastically from pre-pandemic levels.
- Fit-out costs vary widely among life sciences fit-out types and geographies.
Insights from the Life Sciences Roundtable Q4 2024
A panel of CBRE experts discussed key findings from the Life Sciences Construction Benchmarks & Trends 2024 report and U.S. Life Sciences Quarterly Figures and shared their perspectives on emerging markets, utilization, the impact of AI and more.
Construction Trends
After the mad dash for lab/R&D space that began in late 2020, the amount of lab/R&D space under construction in the top 13 U.S. life sciences markets peaked at nearly 40 million sq. ft. in Q2 2023.
Net absorption in the sector peaked in Q3 2021, with the total falling to under 1 million sq. ft. a quarter by Q2 2023. After nearly 2 million sq. ft. of negative net absorption in 2023 and further negative absorption in the first half of 2024, 72% of the 21.2 million sq. ft. currently under construction remains unleased. While sector activity picked up slightly in the second quarter, there is still a long road ahead for developers looking to fill their new buildings.
To meet the increased need for lab/R&D space starting in late 2020, some developers considered conversions as a way to repurpose underutilized commercial space. However, office-to-lab/R&D conversions carry a high cost, as the building requirements vary greatly from those of a standard office.
Life science project costs have increased by 20%-25% compared with pre-pandemic levels.
Figure 1: Laboratory Building Amenities
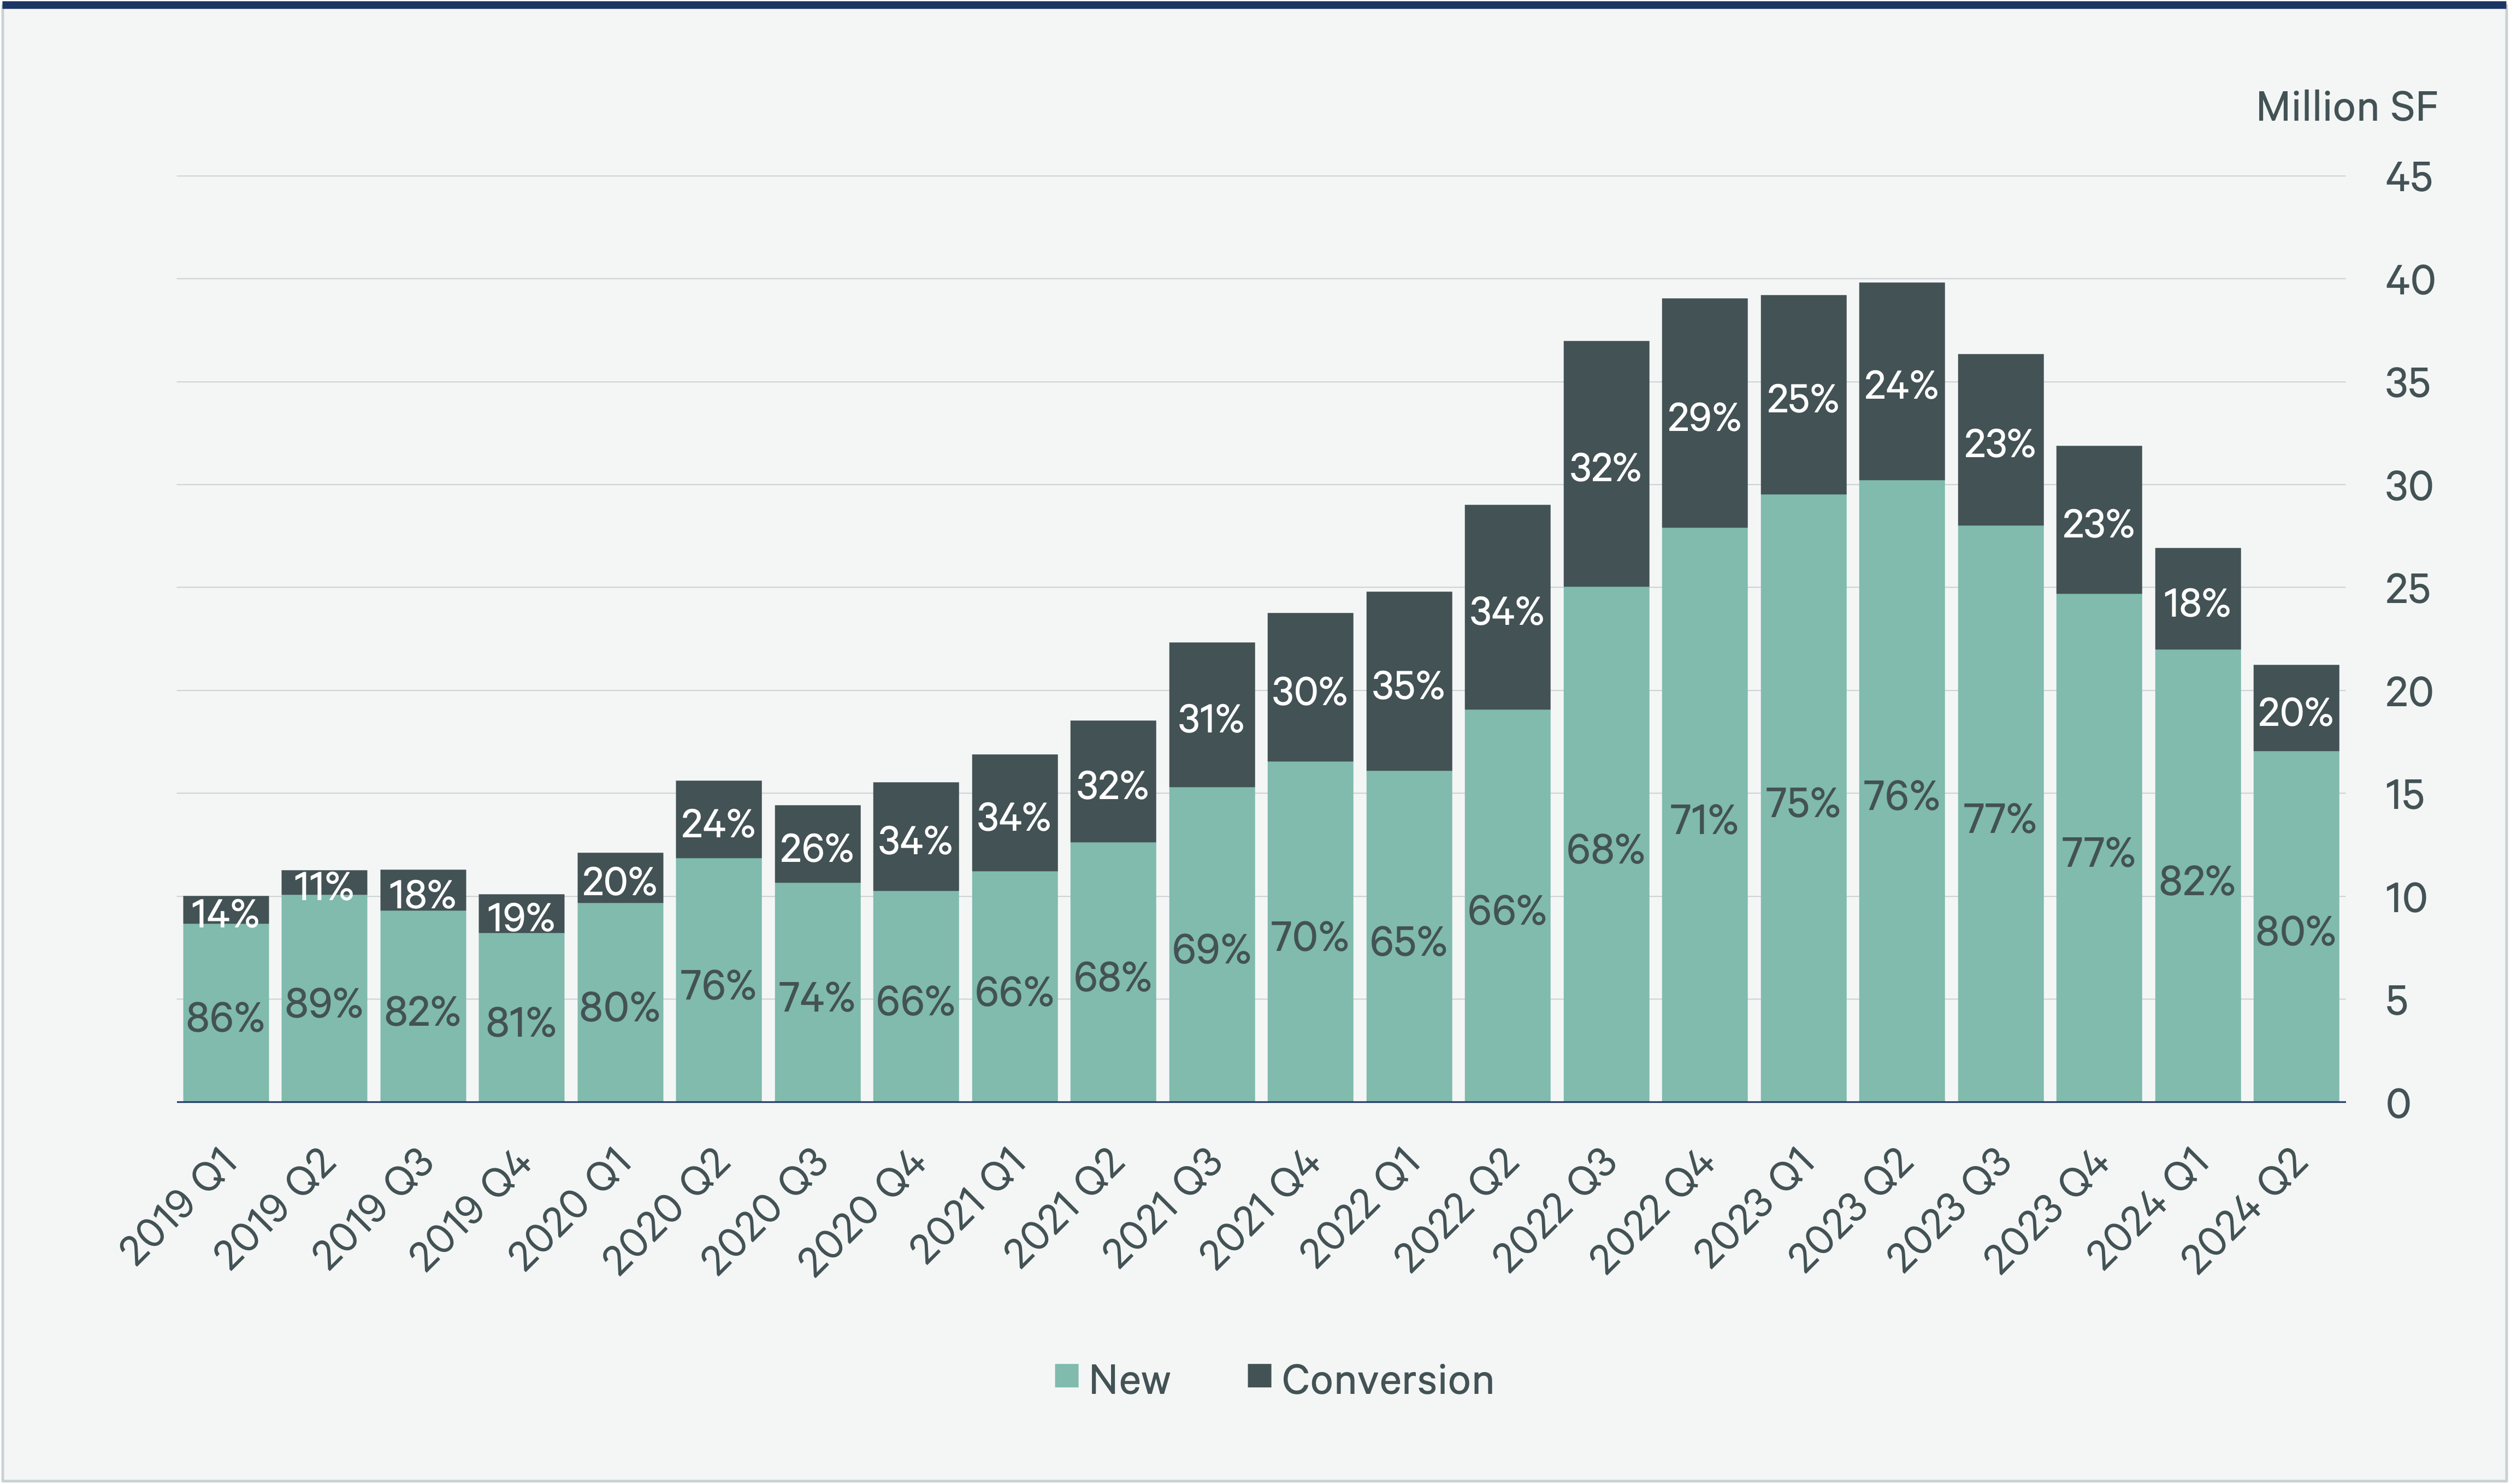
Buildings being converted from other uses, as a percentage of total construction projects, peaked at 35% in Q1 2022 and returned to Q1 2020 levels of 20% as of Q2 2024. As construction starts decline and more space delivers, conversions will likely continue to decrease.
Figure 2: New vs. Conversion Construction
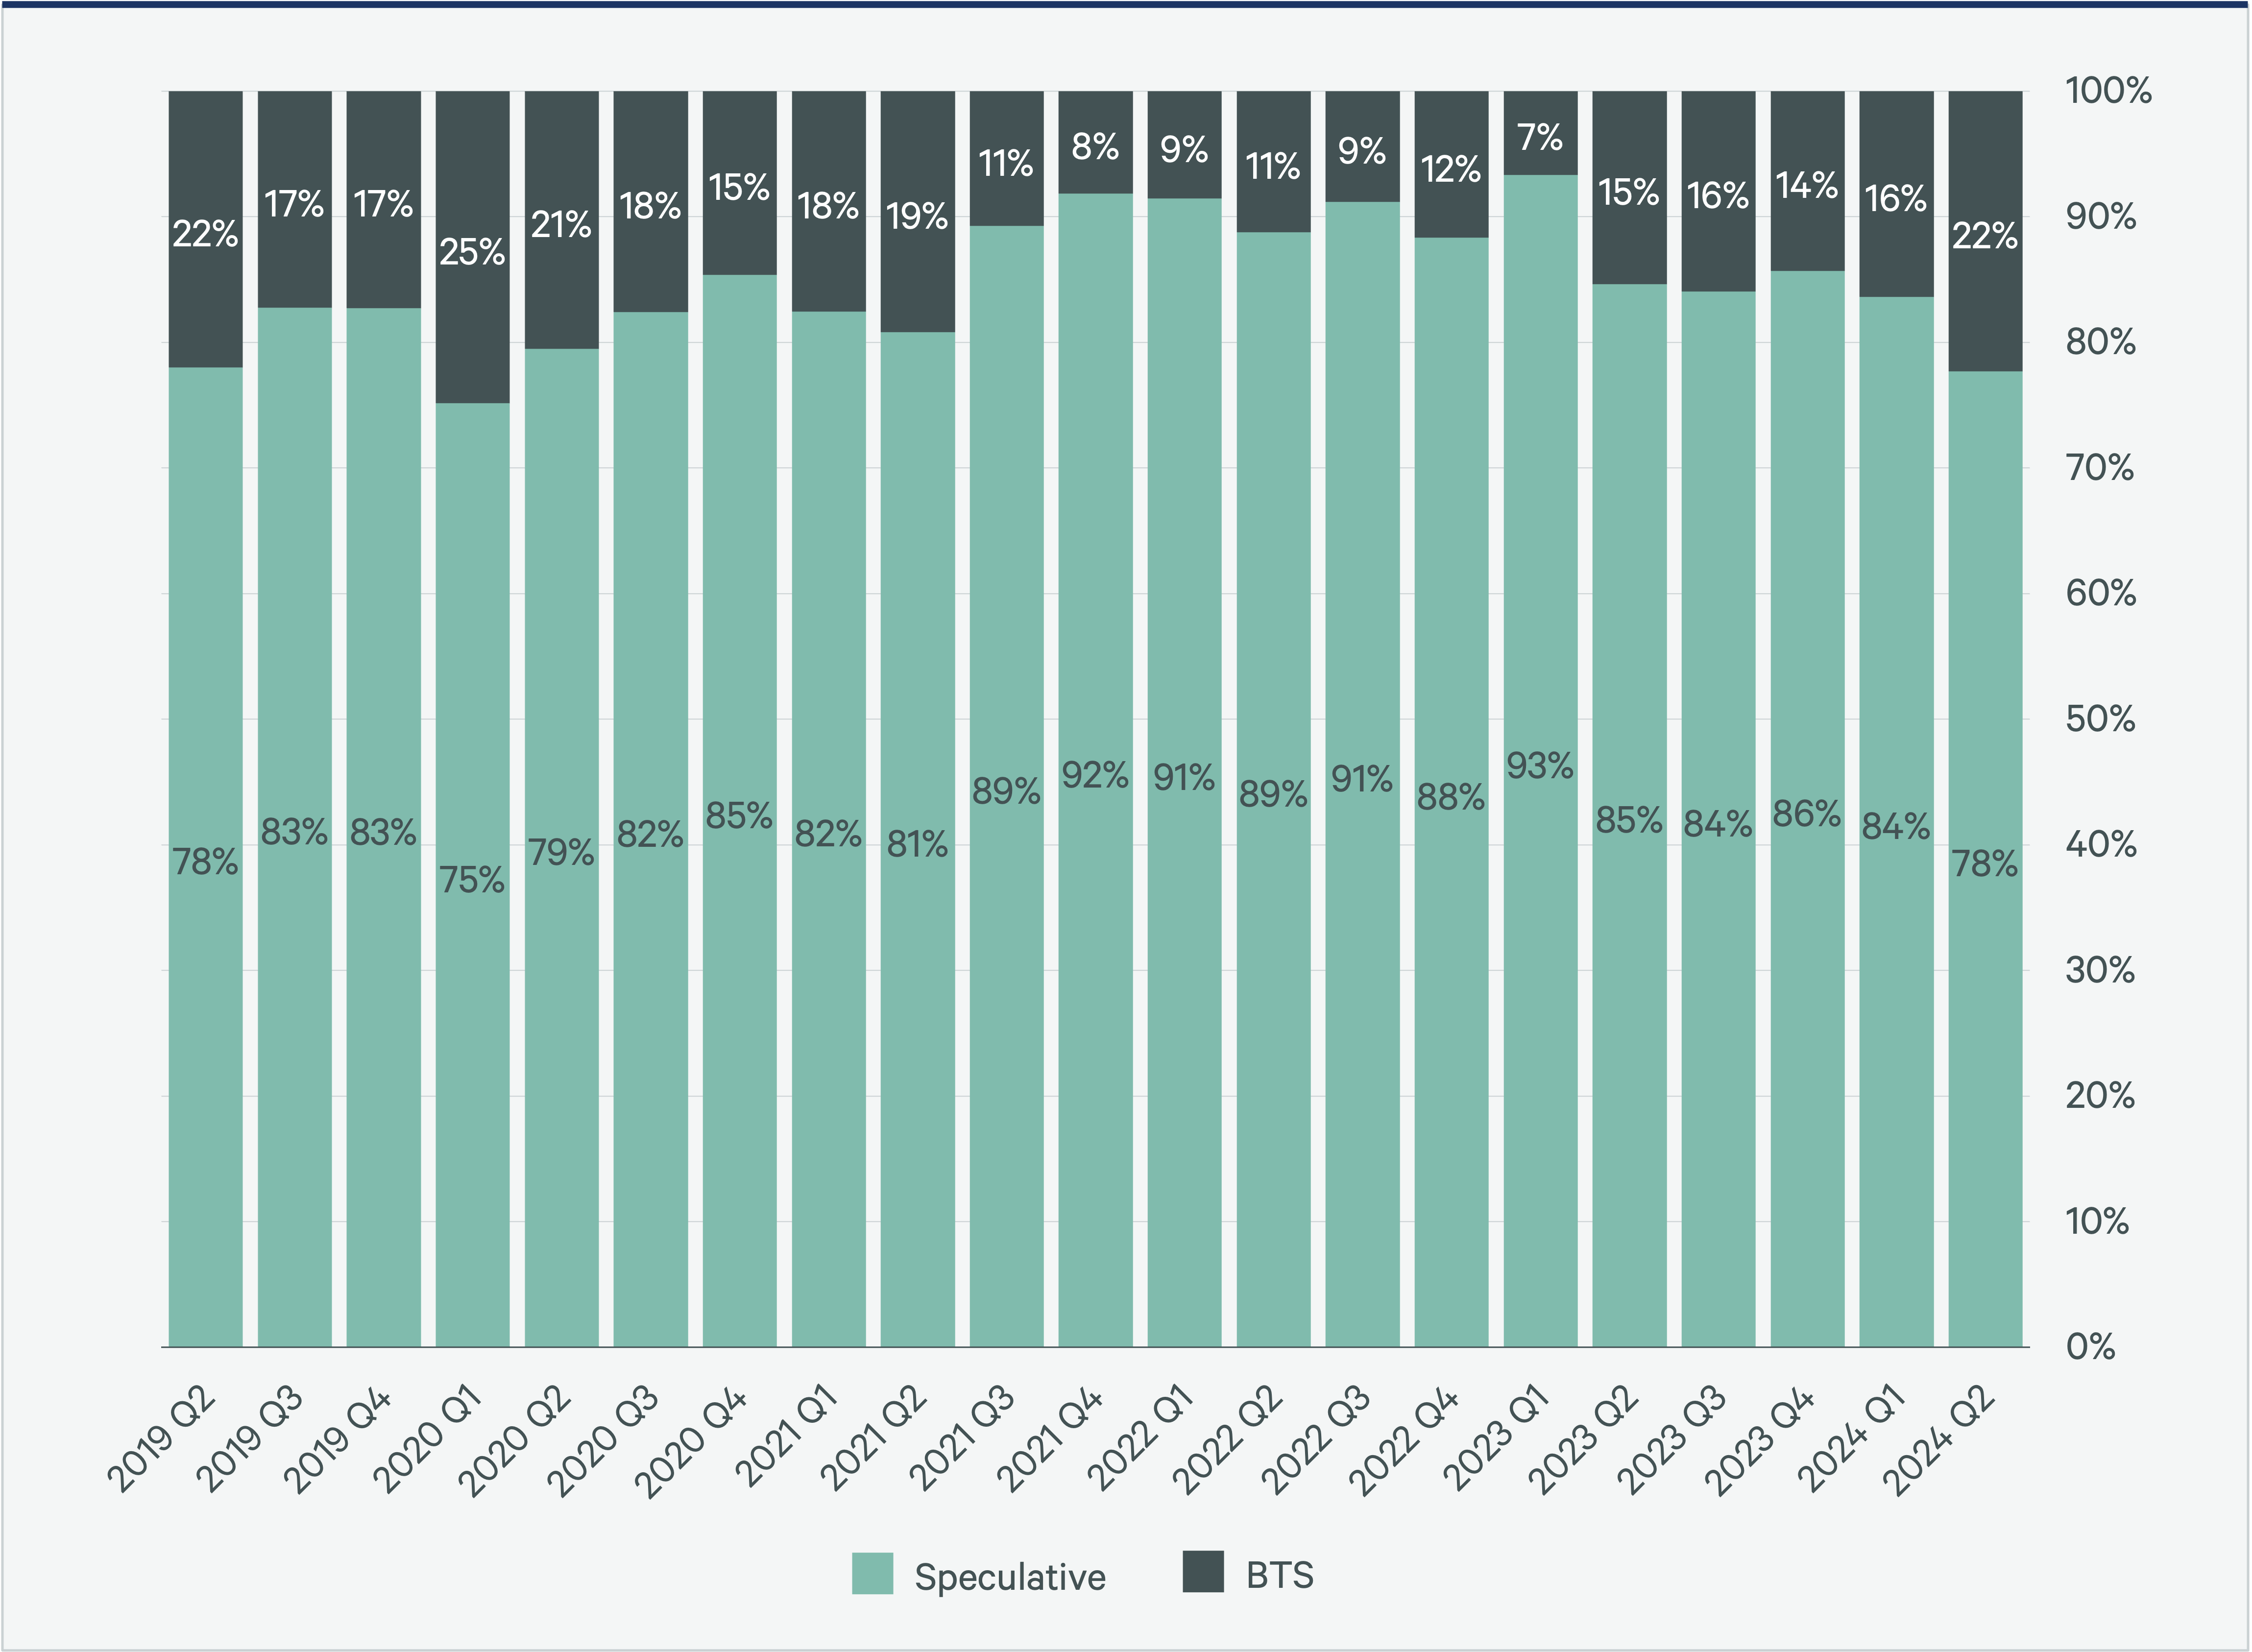
While the majority of lab/R&D space under construction is speculative, the percentage has decreased in recent quarters as many developers choose to hold off on building until a lease is signed. As of Q2 2024, 22% of life sciences construction projects are build-to-suit, all fully leased, while only 10% of the available speculative space is preleased. Some speculative projects have been put on hold until a tenant can be found, further emphasizing the shift away from speculative construction for lab/R&D.
Figure 3: Percentage of Speculative vs. Build-to-Suit Under Construction
In the top three life sciences markets—Boston-Cambridge, San Francisco Bay Area and San Diego—construction deliveries peaked between Q4 2023 and Q2 2024, with sq. ft. delivered per quarter surpassing historical norms. For all 13 markets, no single quarter surpassed 2 million sq. ft. delivered until Q4 2021, when 4.7 million sq. ft. delivered. With few new construction starts, deliveries per quarter are expected to fall back to 2019 levels by 2026. The current pipeline anticipates 10 million sq. ft. of deliveries for the remainder of 2024, 7.2 million sq. ft. in 2025, 3.1 million sq. ft. in 2026, and less than 1 million sq. ft. in 2027 and beyond. More projects will likely enter the pipeline by 2026 as inventory normalizes.
Figure 4: Lab/R&D Deliveries in Top Three Markets
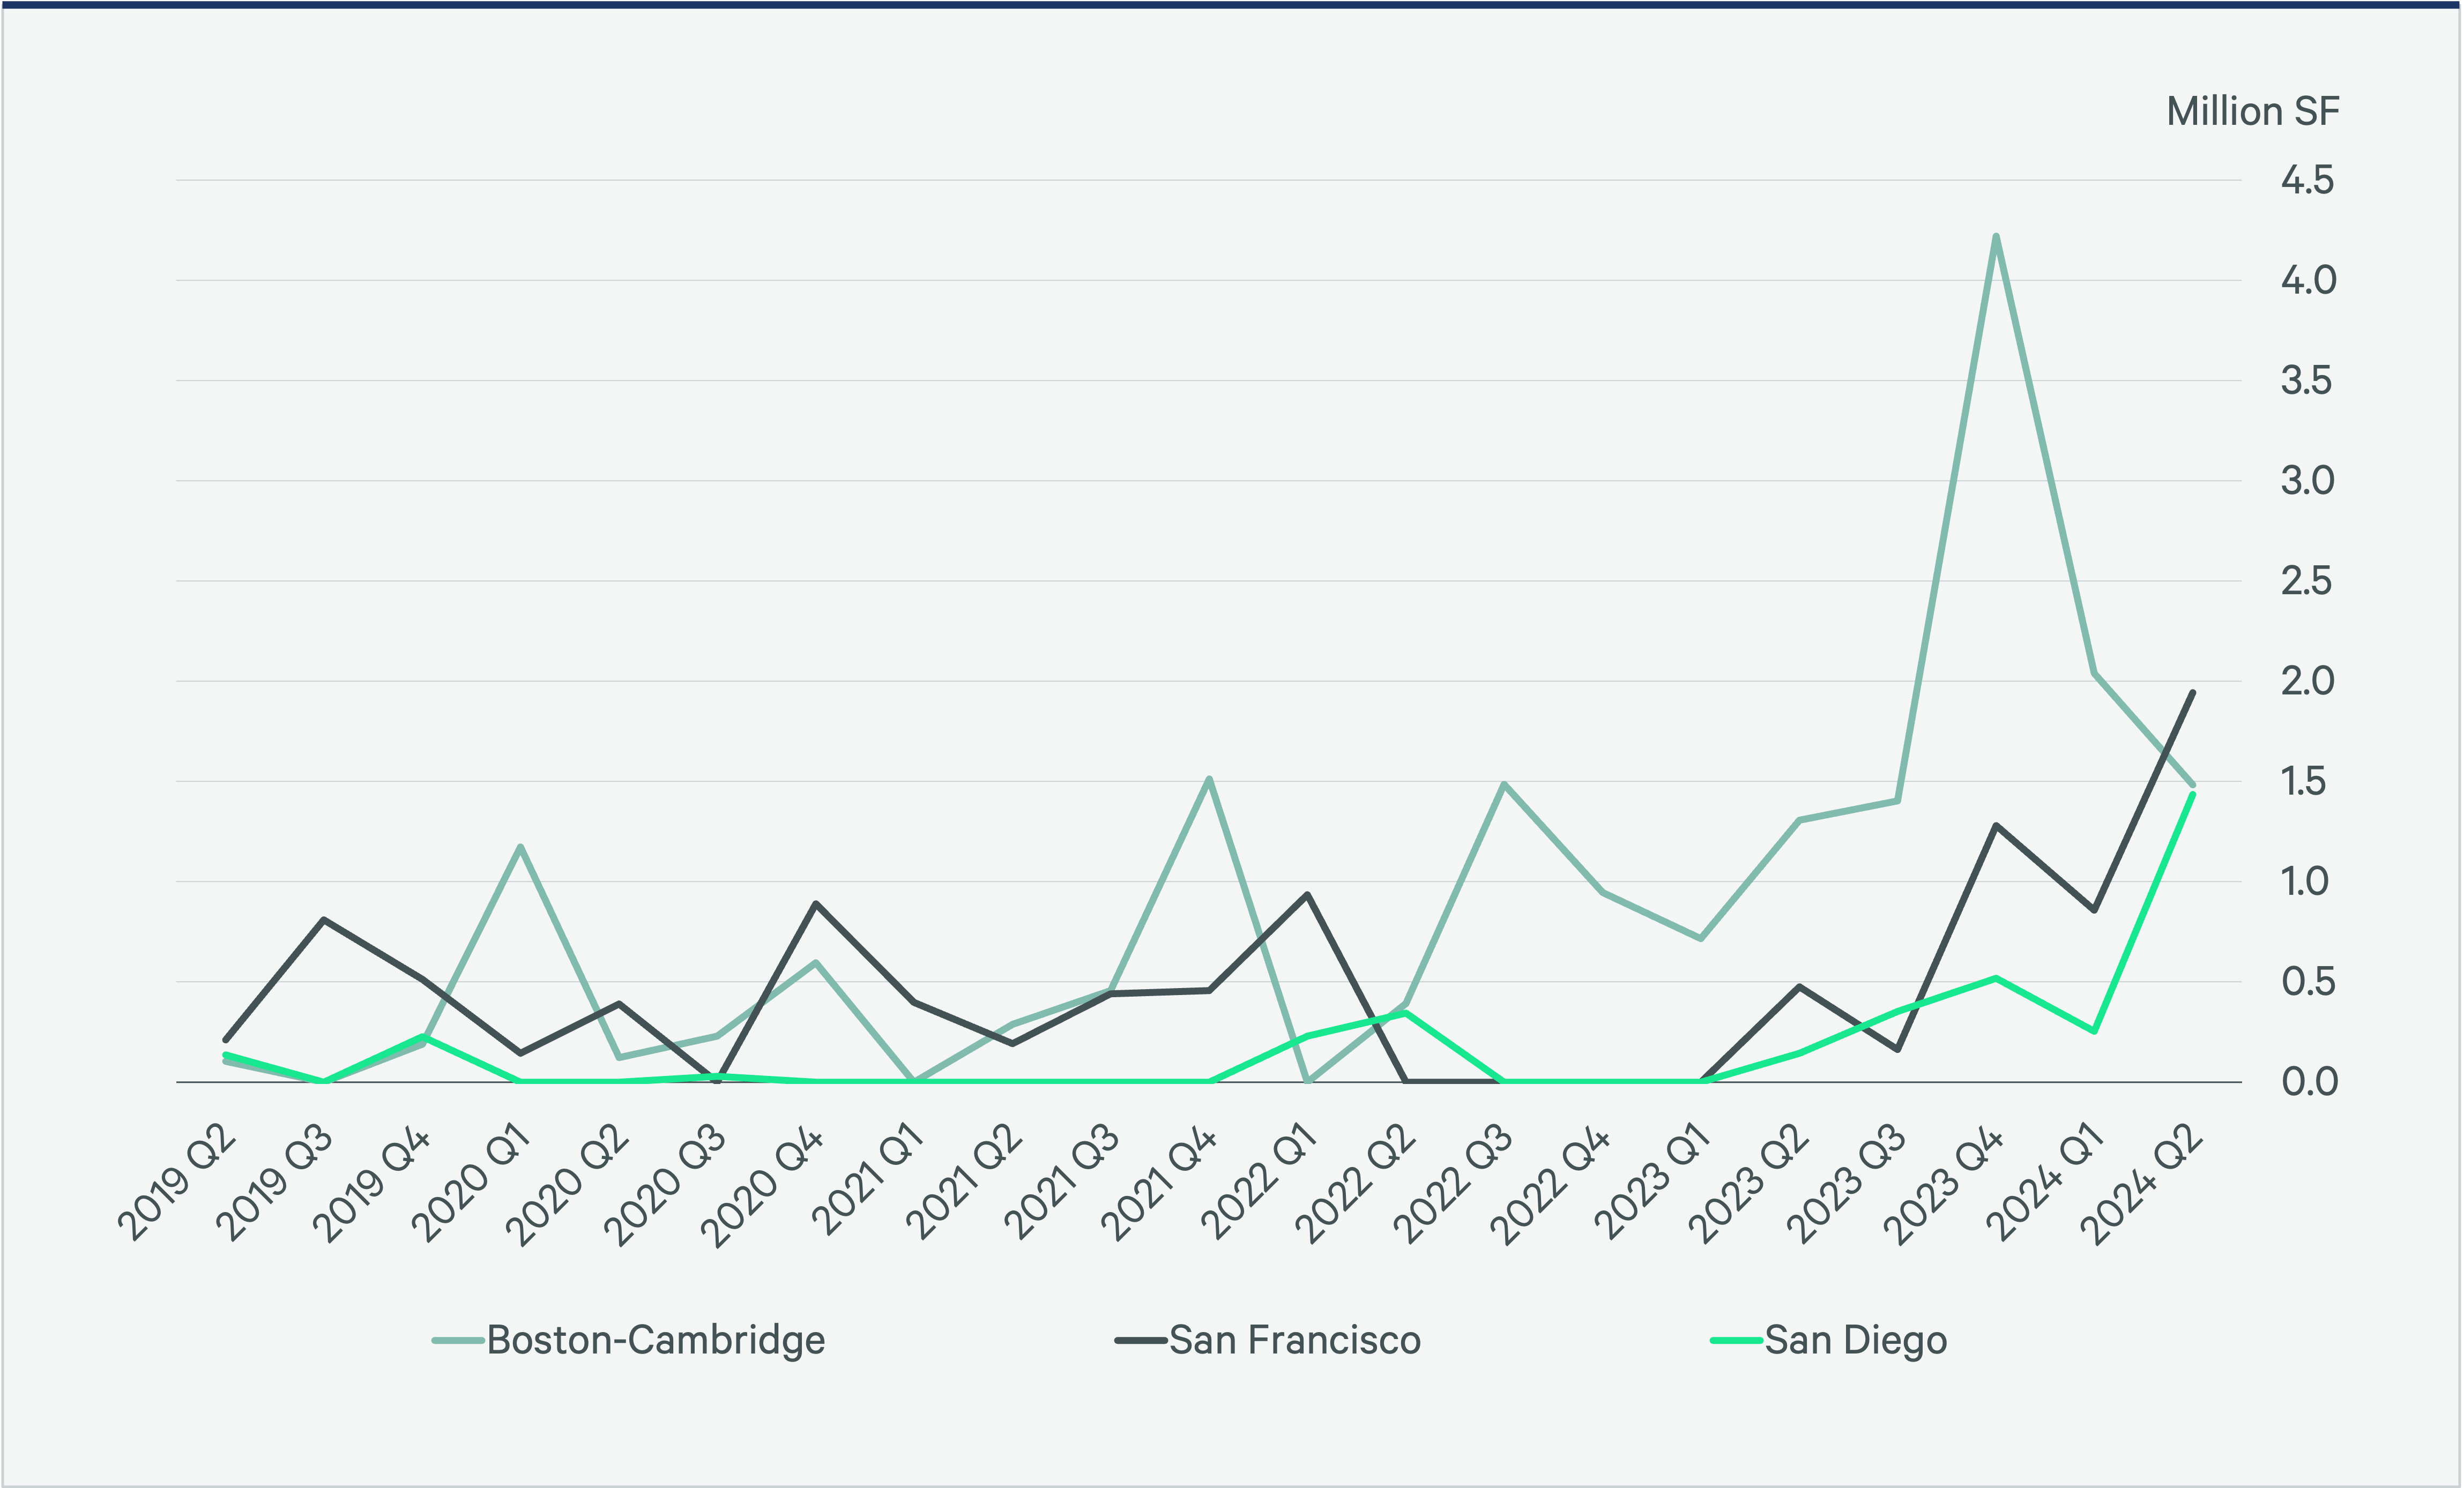
With few new construction starts, deliveries per quarter are expected to fall back to 2019 levels by 2026.
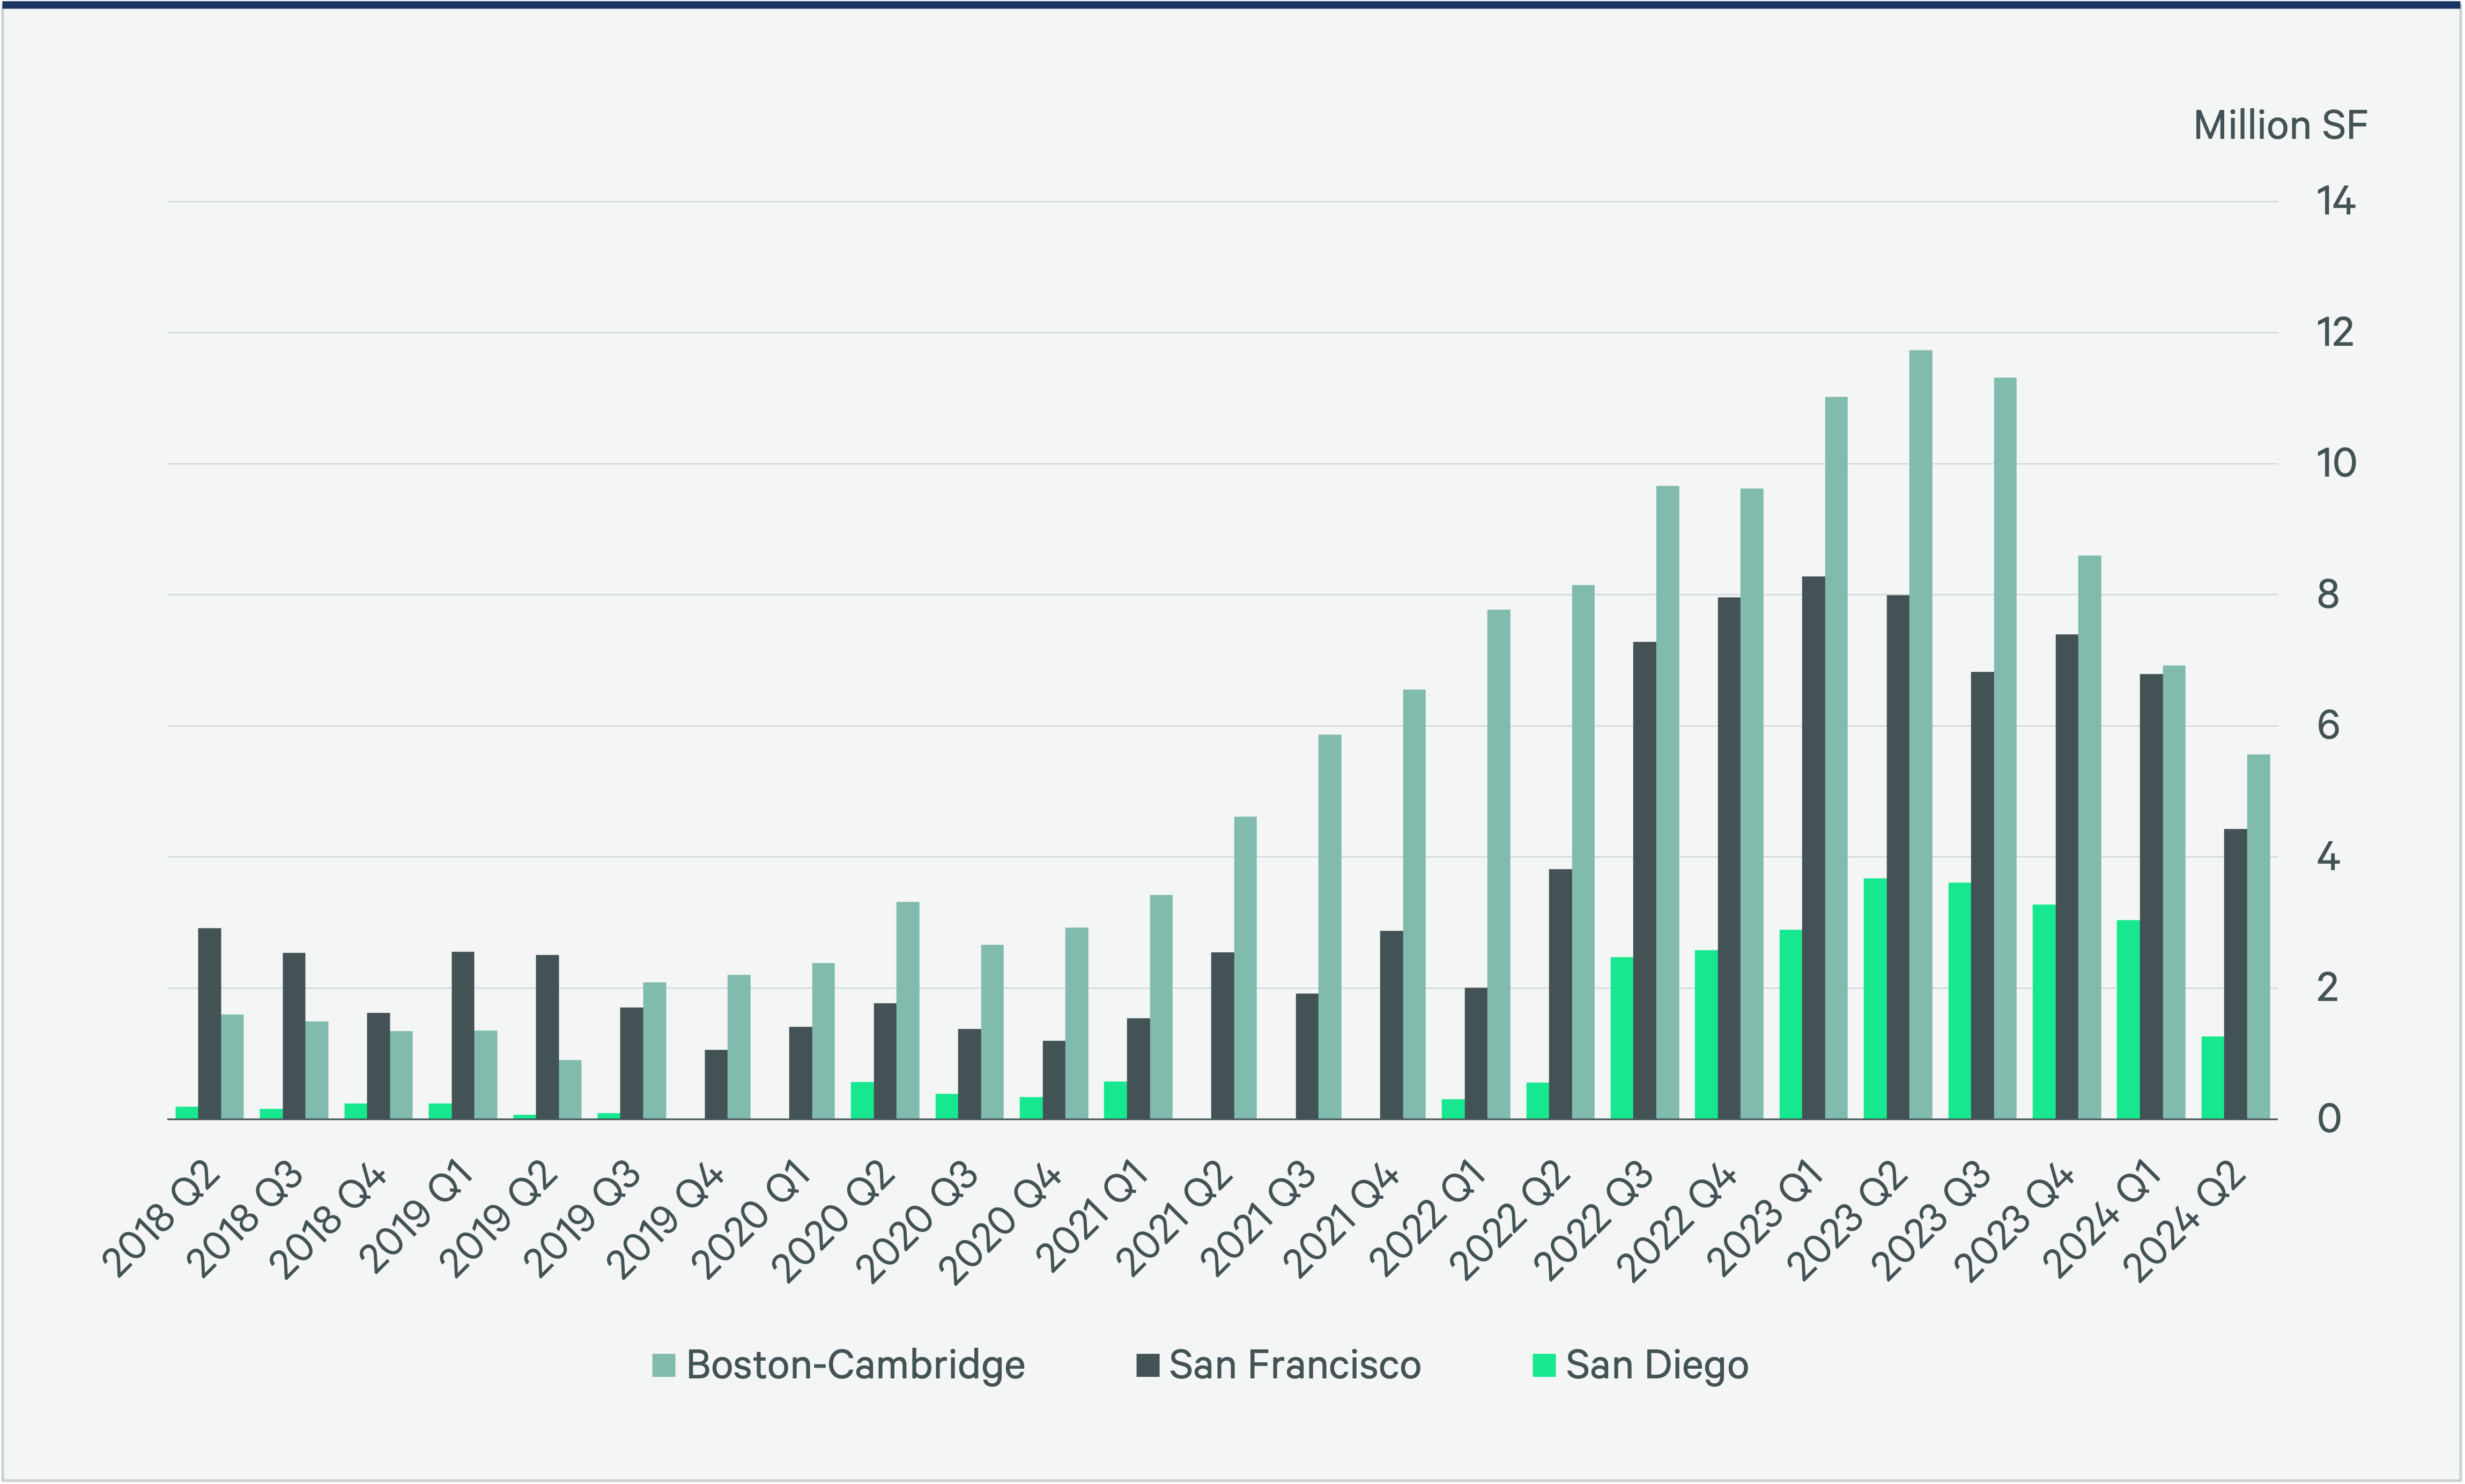
The top three life sciences markets have felt the brunt of oversupply issues. In Q2 2024, vacancy hit a record high in the top three markets—Boston-Cambridge, San Francisco Bay Area and San Diego—and Denver-Boulder (still relatively low at 11.4%). Of the top 13 markets, Boston-Cambridge has the most speculative lab/R&D space under construction, followed by the San Francisco Bay Area and San Diego.
While Boston-Cambridge and the San Francisco Bay Area both had negative net absorption over the last four quarters, San Francisco has been hit the hardest at nearly 2 million sq. ft. of negative net absorption over 12 months. San Francisco does have the benefit of being able to market available space to other industries that are attracted to the area, such as clean tech. San Diego and New Jersey had the greatest percentage increase in amount of supply under construction over the last five years, followed by Philadelphia. Construction is still low enough in New Jersey and Philadelphia to not cause oversupply concern.
Figure 5: Speculative Lab/R&D Space Under Construction
Boston-Cambridge Spotlight
In Boston-Cambridge, changes in amount of space under construction vs. demand become apparent when comparing preleased space both as a percentage of space under construction and in aggregate square footage. The percentage of preleased space under construction in Boston-Cambridge peaked at 67.1% in Q2 2019. However, the 1.8 million sq. ft. preleased in Q2 2019 was over 700,000 sq. ft. less than what was preleased in Q2 2024.
Although 2.6 million sq. ft. was preleased in both Q2 2024 and Q4 2020, this represented 31.5% of total space under construction in Q2 2024 vs. 47% in Q4 2020. Current preleasing in aggregate is running on par with late 2020 totals and exceeds pre-pandemic levels. The pause in new construction and the return of tenants to the market should enable demand to catch up with supply over the next few years.
Fit-Out Costs
Fit-out costs vary widely among life sciences fit-out types.
A national comparison of seven major life sciences fit-out types shows the large range in costs, with specialty spaces like vivariums, cleanrooms and gene therapy costing the most to build. Costs for specialty equipment have also risen sharply from pre-pandemic levels, with some up as much as 30%-50%. Lead times for some equipment coming from overseas have increased from 10 to 20 additional weeks.
In addition to type, fit-out costs also vary widely by geography. Figure 7 compares 25 cities across seven fit-out types. New York and San Francisco Bay Area have the highest construction costs, while Raleigh and Dallas have the lowest.
Figure 6: Speculative Lab/R&D Space Under Construction
*Dollars per rentable square foot
Figure 7: Select Cities Life Science Fit-Out Costs
However, with fit-out costs increasing, tenant improvement allowances (TIA) have also increased. Figure 8 shows the change in TIA over the past three years, with an average increase of 38% in eight select markets.
Figure 8: Tenant Improvement Allowance on First-Generation New Leases (Select Markets)
Source: CBRE Research, Q3 2024.

Methodology
This report examines lab/R&D construction trends across 13 major markets and compares life sciences fit-out costs in 25 U.S. cities. This report highlights cost variances across seven project types by geographic location.
Costs presented within the report include:
- Construction: All construction costs including partitions, doors, ceilings, finishes, mechanical/electrical/plumbing systems, lab hoods, piping, infrastructure and indirect costs such as insurance, overhead and fees
- Professional fees: All professional consultants spanning design, construction and project management
- Fixtures, Furniture & Equipment (FF&E): FF&E includes lab equipment, loose furniture, workstations, chairs, soft seating and storage items
- Technology: Major components to allow connectivity within the space such as structured cabling, security, audio visual, telecom and others
Costs not included in the report include:
- Broker fees or costs
- Tenant improvement allowances
- Demolition of the space from previous tenants
- Permit costs or special taxes (other than sales tax)
- Computers, monitors, stationary, printers, etc.
- Landlord costs
- Contingency
- Escalation
- LEED/Well premiums
- Work outside the rentable area
Other considerations:
All costs presented in this report are based on rentable square footage ($/rsf), which refers to the total area within a building that can be rented out to tenants. It includes both the actual usable space (such as offices or breakrooms), and a portion of shared spaces such as hallways, lobbies and restrooms.
Fit-out costs are calculated starting from a warm, lit shell condition.
Cost Advisory Methodology
CBRE Cost Advisory’s proprietary methodology integrates direct project data, market surveys and cost modeling, then normalizes this data to adjust for market fluctuations, materials costs and labor rates. The result: a clear, detailed picture of varying U.S. life sciences fit-out costs.
Local Costs, National Insight
CBRE's extensive North American network provides detailed cost benchmarks for 25 cities across the U.S., providing the most detailed cost information possible.
Tailored Cost Planning
CBRE offers cost data for a large range of different life sciences types across the U.S. Additionally, for each cost component (construction, professional fees, FF&E and technology), we provide low, medium and high range options. This flexibility allows the ability to adjust budgets to align with the project's needs and vision, and takes into account hybrid work policies on talent acquisition and retention strategies across markets.
Related Insights
-

Explore rankings, data and insights for R&D, manufacturing and medtech talent across the top 100 U.S. life sciences markets.
-

Life sciences incubators, which are in very high demand, are increasingly sophisticated and well-funded.
-

Revolutionary advancements by the U.S. life sciences industry could increase in 2024 despite macroeconomic uncertainty.
Related Services
- Property Type
Life Sciences
We provide the life sciences industry solutions that maximize facility and investment performance across labs, manufacturing space and critical enviro...
- Design & Build
Cost Advisory
We empower clients to plan and control spending, estimate project costs, manage risk, eliminate waste, and identify tax and procurement process savings.
- Design & Build
Project & Program Management
Deliver projects seamlessly with an integrated team that manages everything from schedules and budgets to the entire construction process.