Future Cities
2022 Global Seaport Review: Savannah, Georgia
Navigating evolving global seaport regions and their impact on industrial real estate
December 13, 2022 4 Minute Read
Savannah is one of the most efficient and reliable gateways in the country—a market of choice for import and export logistics operations. The port’s unprecedented container volume growth has fueled the region’s expanding warehouse market, which has doubled in size over the last five years. More than 25 million sq. ft. of Class A space is under construction, providing a healthy number of options for occupiers.
Overview
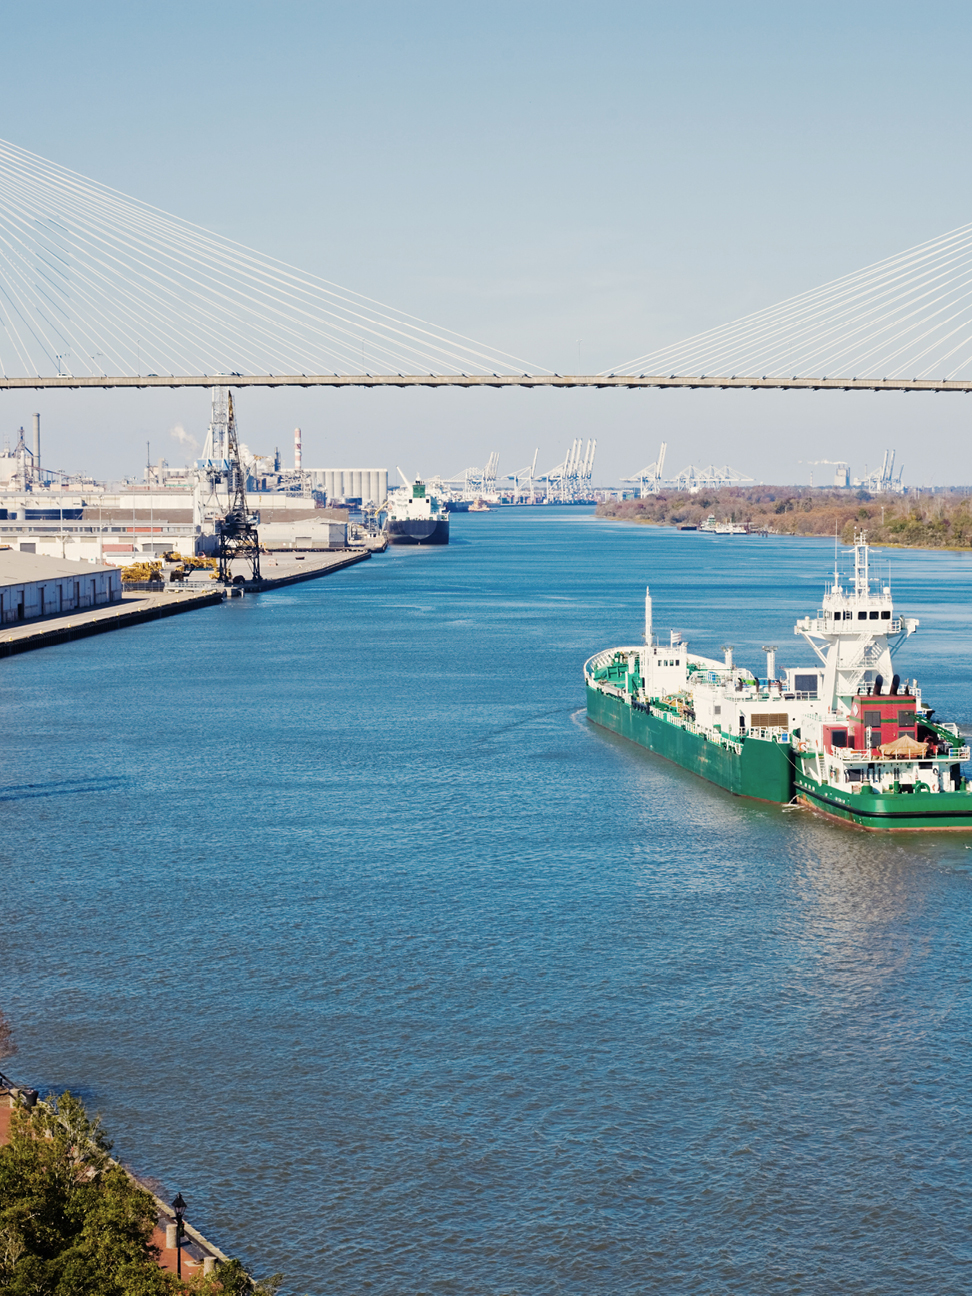
The Port of Savannah—home to the largest single container terminal in North America, the Garden City Terminal—is the fastest-growing port in the U.S. It spans more than 1,345 acres (544 hectares) and ranks 45th on the United Nations Port Liner Shipping Connectivity Index, making it one of the best-connected ports in the Southeast. The port moved a record 5.76 million TEUs in its 2022 fiscal year. Following the March completion of the Savannah River Dredging project, the port logged record-setting container volume levels. The Georgia Ports Authority (GPA) is expanding the Garden City Terminal even further, with Phase I, a 25-acre container yard, opening earlier this year, and Phase II expected to increase annual capacity by another 1 million TEUs. The port is also expanding Berth 1, which will increase on-dock capacity by 25% when complete in July 2023, adding an estimated 1.5 million TEUs of capacity annually.
Figure 1: TEU volumes
Source: CBRE Research, Port of Savannah, 2022.
Figure 2: Population demographics
Source: macrotrends.net, Savannah Metro 2022.
9.5 M
projected TEU container capacity by 2025, up 60% from 2021
Port features
The port has 36 container cranes, with an additional 42 expected by 2028. It also includes more than two miles of contiguous berthing space. The harbor was recently deepened to 47 feet to handle ships carrying more than 16,000 TEUs. Savannah has not been immune to the challenges faced by other ports in the past 12 months. To improve operations, the port has hired additional workers, added more equipment and increased its container yard capacity by approximately 25%.
Figure 3: Port details
Source: Source: CBRE Research, Port of Savannah, 2022.
Trade partners
The port’s top trading partners in the last six to eight months include China, Vietnam, South Korea, India and Thailand. Top imports coming into the port include furniture, plasticware, auto vehicle parts, games/toys and clothing. The GPA in Savannah has established affiliations with several Chinese ports, with routine shipments to Ningbo, Quingdao, Shanghai, Shekou, Xiamen, Xingang/Tianjin and Yantian.
Intermodal transportation
The port is easily accessed via interstates 95 and 16. Key Southeast and Midwest manufacturing hubs are reachable within a one- or two-day drive. The Garden City Terminal is the Southeast’s busiest intermodal gateway. The GPA made numerous infrastructure improvements to increase its market share in existing and new destinations across an arc of inland markets spanning Atlanta, Memphis, St. Louis, Chicago and the Ohio Valley. The Mason Mega Rail project allows for cargo to move from a vessel to rail in just 24 hours, increases the number of working tracks from eight to 18 and adds 97,000 feet of new rail at the Garden City Terminal, doubling its rail lift capacity to 1 million containers per year. The just-completed Jimmy DeLoach Parkway extension project adds 3.8 miles of roads to connect the port directly to I-16.
Real estate influence
The port is the primary driver of Savannah’s booming 86.7 million-sq.-ft. industrial real estate market. Savannah’s vacancy rate dropped to 0.7% in Q2, the fifth-lowest in the U.S. Pre-leasing in under-construction developments is the best option for tenants seeking space. More than 2 million sq. ft. of new product delivered in Q2, most of which was occupied immediately. With vacancy remaining low, asking rents climbed to an average of $5.79 per sq. ft. in Q2, up 5.5% quarter-over quarter.
Figure 4: Industrial & logistics market stats
Source: CBRE Research, Q2 2022.
Explore Global Seaports by Port

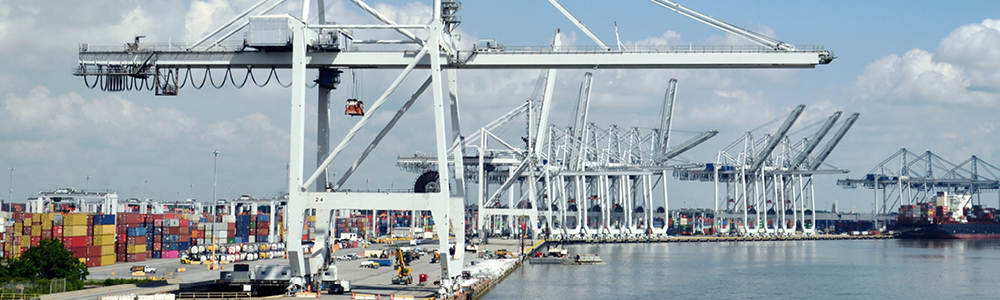
The Port of Charleston is a top 10 U.S. container port spanning 200-plus acres.
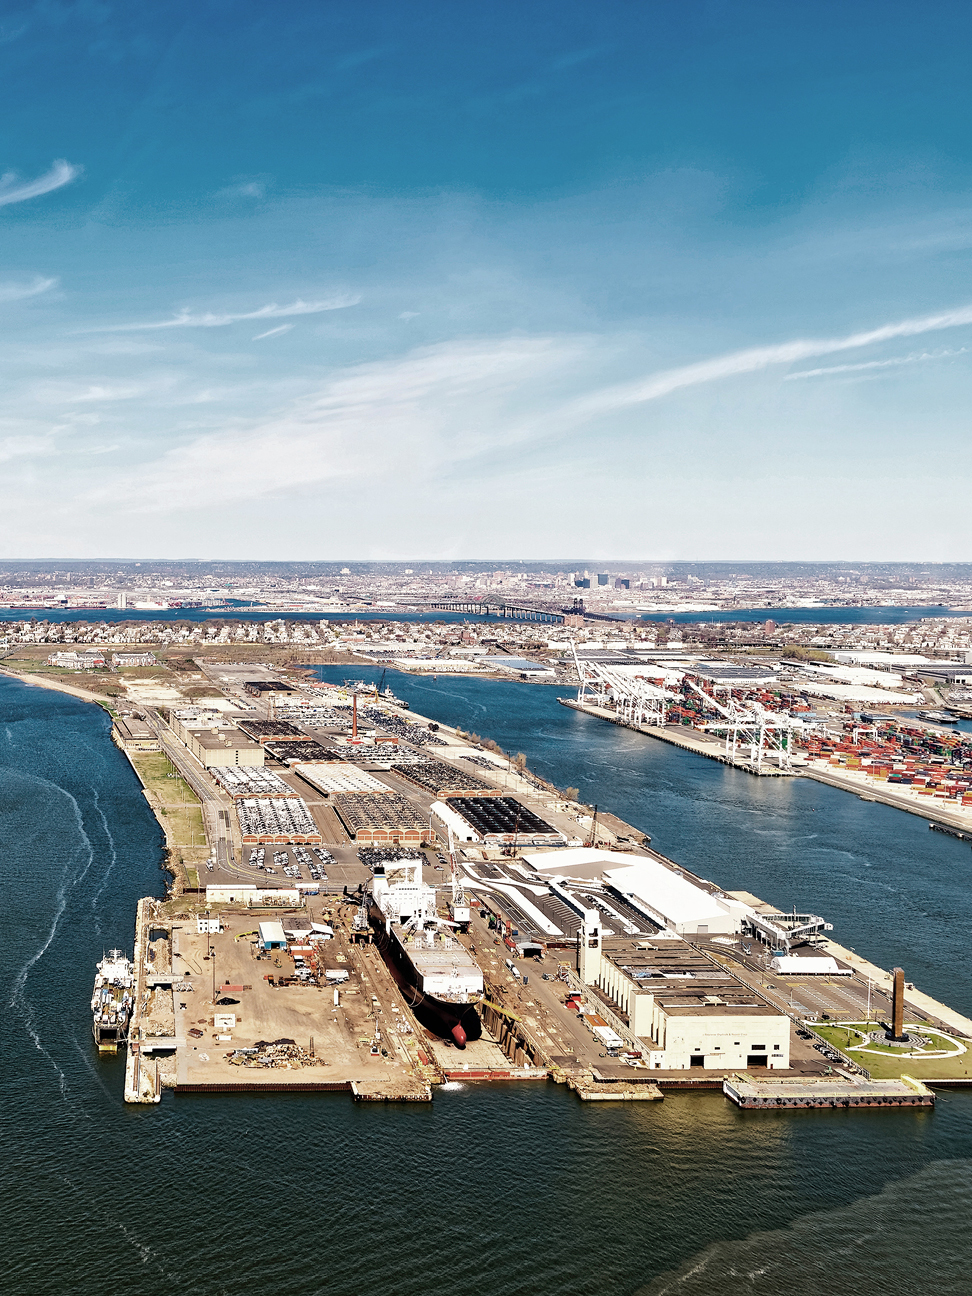
The Port of New York/New Jersey ranks 37th on the United Nations Port Liner Shipping Connectivity Index, making it the best-connected port on the East Coast.
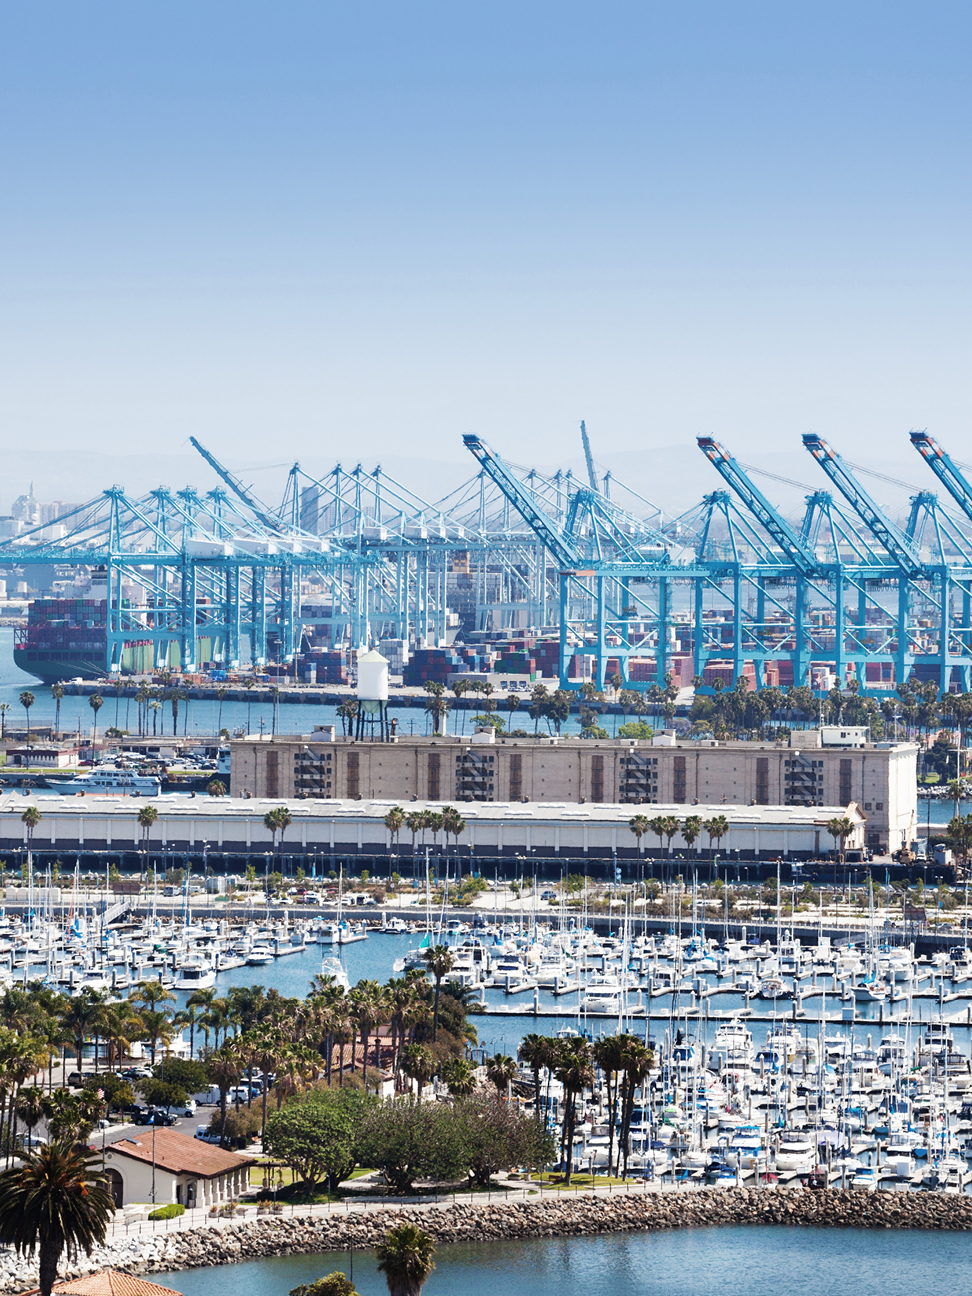
The Port of Los Angeles and Port of Long Beach make up the San Pedro Bay Port Complex.
Related Services
- Property Type
Industrial & Logistics
We represent the largest industrial real estate platform in the world, offering an integrated suite of services for occupiers and investors.
- Property Type
Ports
Manage all your integrated logistics needs with services that combine our industrial roots with extensive supply chain experience.
- Consulting
Supply Chain Advisory
CBRE Supply Chain Advisory helps you solve complex business problems and build distinct advantage through supply chain transformations.


Insights in Your Inbox
Stay up to date on relevant trends and the latest research.