Future Cities
2022 Global Seaport Review: New York/New Jersey
Navigating evolving global seaport regions and their impact on industrial real estate
December 13, 2022 4 Minute Read
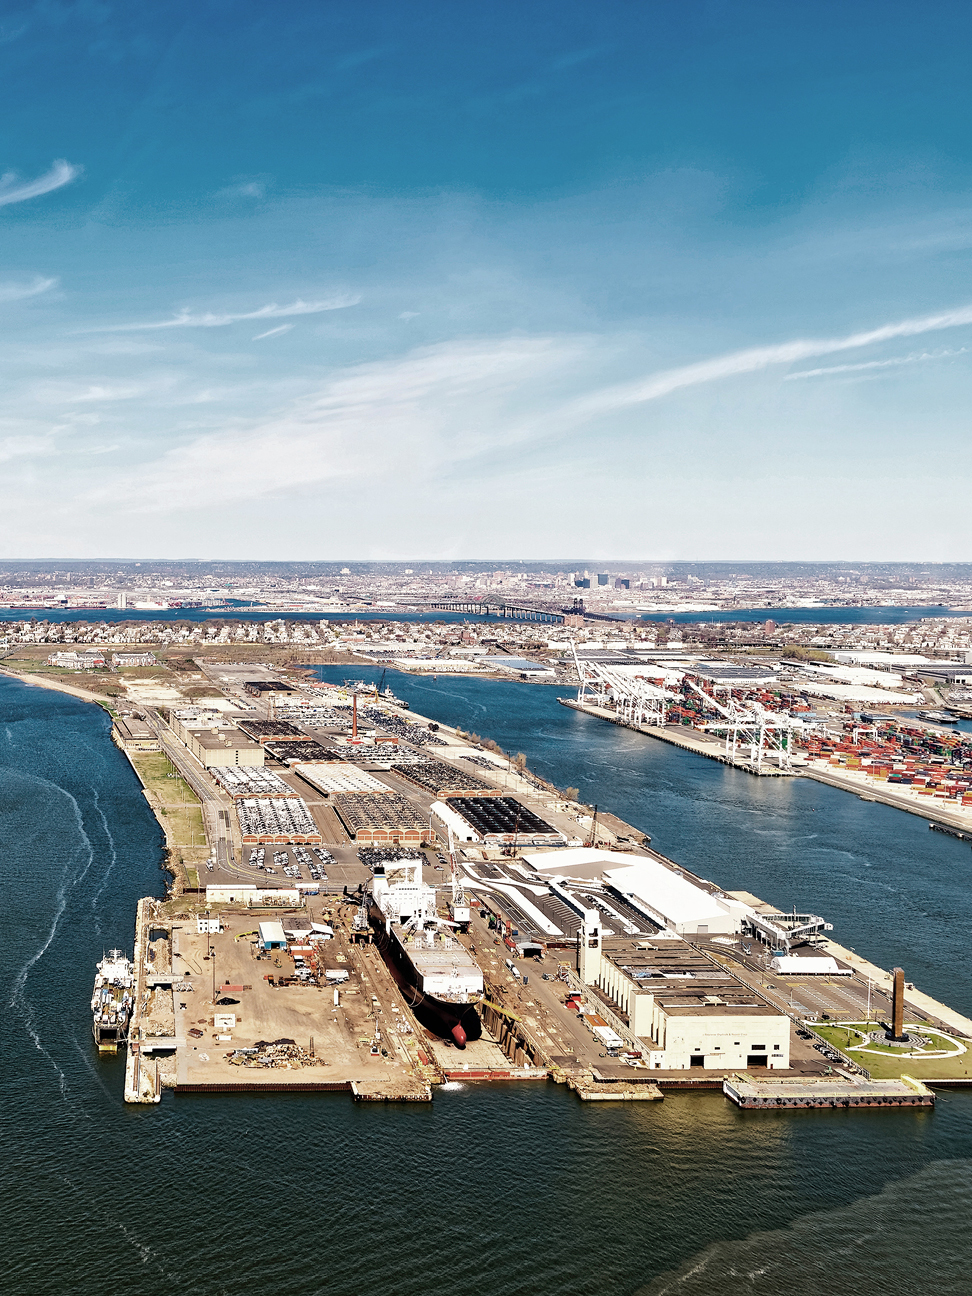
The port continues to be a key driver for industrial development in New Jersey, but a dwindling supply of land and an increasingly difficult entitlement process is leading to a decline in the construction pipeline. Occupiers are making do with older, functionally obsolete inventory despite demand for first-generation space and corresponding outside storage.
Overview
The Port of New York and New Jersey ranks 37th on the United Nations Port Liner Shipping Connectivity Index, making it the best-connected port on the East Coast.
Container volume increased approximately 11% through mid-year 2022. The port handles around 30% more cargo than it did before the pandemic. New tariffs were implemented in September on empty containers and export volume to help alleviate container backups, with a $100 container imbalance fee per container initiated if loaded and empty containers remain at the port.
Figure 1: TEU volumes
Source: CBRE Research, Port Authority of New York and New Jersey, 2022.
Figure 2: Population demographics
Source: macrotrends.net, Los Angeles Metro, 2022.
843,191
TEUs moved in August, the highest month ever, surpassing Los Angeles/Long Beach in export and import volume
Port features
The 3,000-acre port boasts 50-foot depths and six marine terminals: Port Newark container terminal (272 acres and 13 cranes), Maher terminal (350 acres and 15 cranes), GCT New York terminal (210 acres and six cranes), GCT Bayonne terminal (169 acres and eight cranes) and Red Hook container terminal (65 acres in New York, 30 acres in New Jersey and eight cranes).
Figure 3: Port details
Source: CBRE Research, Port Authority of New York and New Jersey, 2022.
Trade partners
As a result of West Coast bottlenecks and congestion, containers were rerouted to the port as logistics companies looked elsewhere to unload products faster. As of the last six to eight months, the port’s top trade partners include China, India, Vietnam, Italy and Germany. The top imported goods include furniture, holiday decorations/ornaments, plasticware, games/toys and clothing.
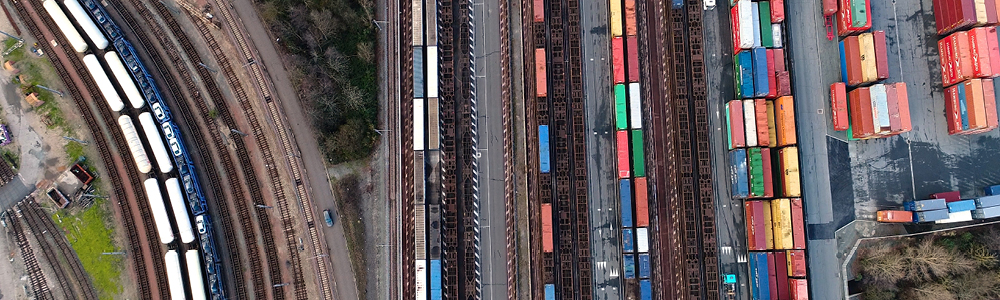
Intermodal transportation
The port provides shippers with an on- and near-dock railyard network known as ExpressRail. The service is a sustainable mode of cargo transportation to destinations such as Chicago, the Ohio Valley, New England and Eastern Canada. The system has the capacity for 1.5 million rail lifts and connects two Class I railroad partners: CSX Transportation and Norfolk Southern.
Real estate influence
The Central and Northern New Jersey industrial real estate markets consist of 450 million and 408 million sq. ft. of space, respectively. The region greatly benefits from the handling of goods from the port. Northern New Jersey is an infill market, with most development now found in Central New Jersey (11.5 million sq. ft. underway as of Q2). Central and Northern New Jersey boast the highest U.S. asking rates outside of California, at $13.86 per sq. ft. and $14.09 per sq. ft. per year, respectively, as of Q2.
The port also drives demand in other Northeast industrial markets, including the Pennsylvania I-78/81 Corridor, which is home to some of the last available land in the Northeast for big-box industrial development. Regional operators are setting up shop there at a brisk pace to service the Northeast. The Corridor was fifth in the U.S. in year-to-date net absorption (9.5 million sq. ft.) as of Q2, and fourth for product under construction at 36.7 million sq. ft., of which 36% was pre-leased.
Figure 4: Industrial & logistics market stats
*Northeast U.S. Industrial Stats consisting of the Boston, Hartford, NYC, Northern & Central New Jersey, PA I-78/I-81 Corridor and Philadelphia Metro markets.
Source: CBRE Research, Q2 2022.
Explore Global Seaports by Port

The Port of Charleston is a top 10 U.S. container port spanning 200-plus acres.
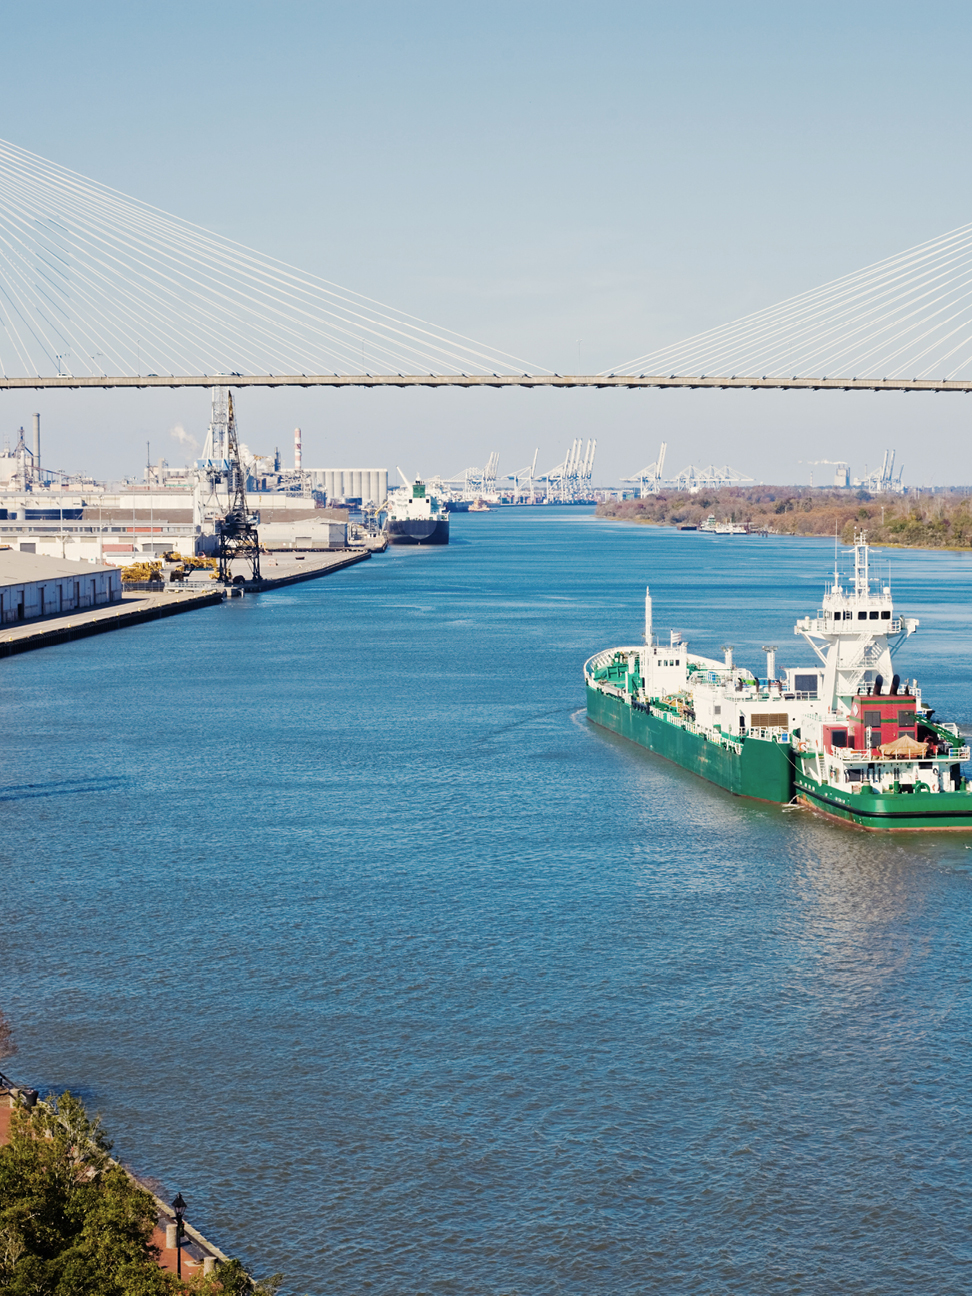
The Port of Savannah—home to the largest single container terminal, the Garden City Terminal—is the fastest-growing port in the U.S.
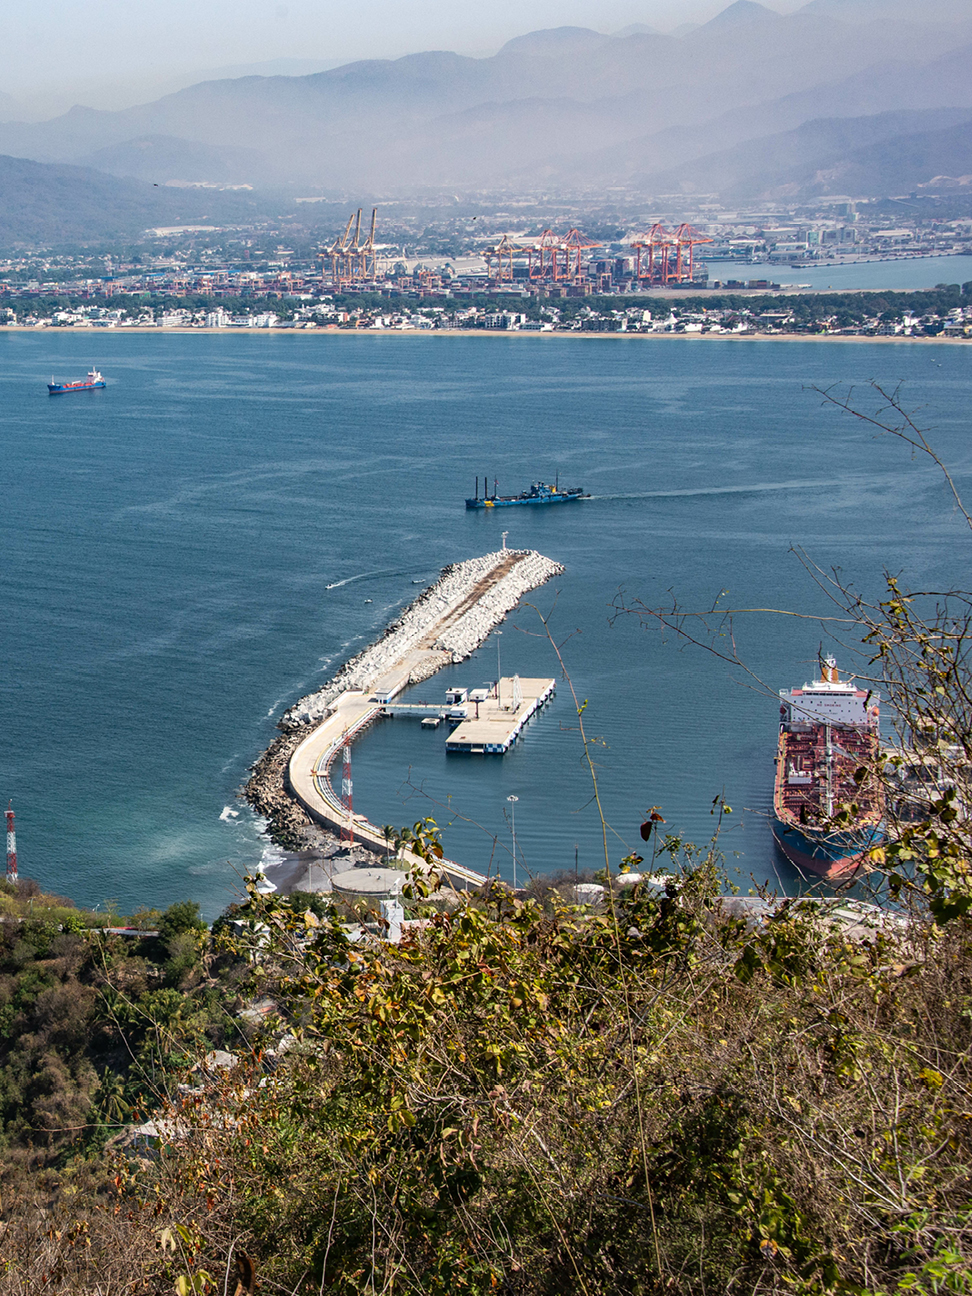
The Port of Manzanillo is the largest containerized port in Mexico and is considered the country’s most important due to its infrastructure and technology.
Related Services
- Property Type
Industrial & Logistics
We represent the largest industrial real estate platform in the world, offering an integrated suite of services for occupiers and investors.
- Property Type
Ports
Manage all your integrated logistics needs with services that combine our industrial roots with extensive supply chain experience.
- Consulting
Supply Chain Advisory
CBRE Supply Chain Advisory helps you solve complex business problems and build distinct advantage through supply chain transformations.


Insights in Your Inbox
Stay up to date on relevant trends and the latest research.