Intelligent Investment
U.S. Office Demand Continues Decline in September
CBRE Pulse of U.S. Office Demand
October 20, 2022 5 Minute Read
Looking for a PDF of this content?
- Demand for office space decreased for the fourth consecutive month in September as occupiers continued to delay leasing decisions amid high inflation, rising interest rates and assessments of hybrid working arrangements.
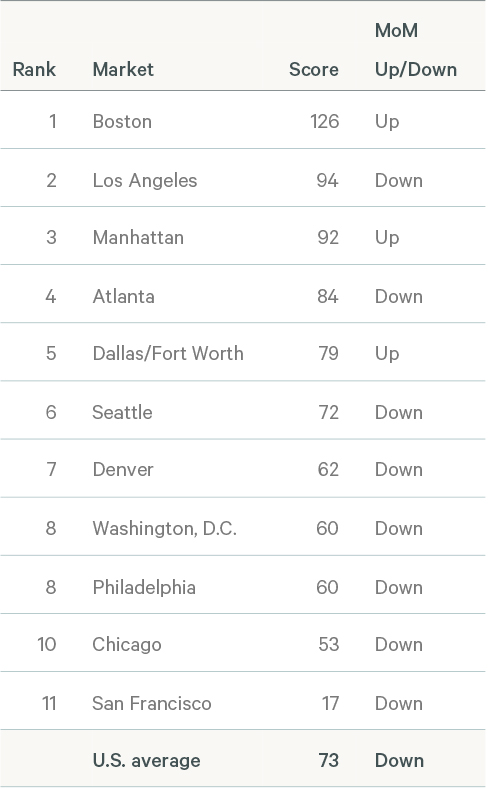
- The U.S. Leasing Activity Index dropped 8 points to 73 in September, the largest monthly decrease since March 2022. San Francisco (-36 points) and Seattle (-26) had the biggest decreases.
- Manhattan (+16 points), Boston (+14) and Dallas/Fort Worth (+3) were the only markets that recorded increases in their September Leasing Activity Index levels.
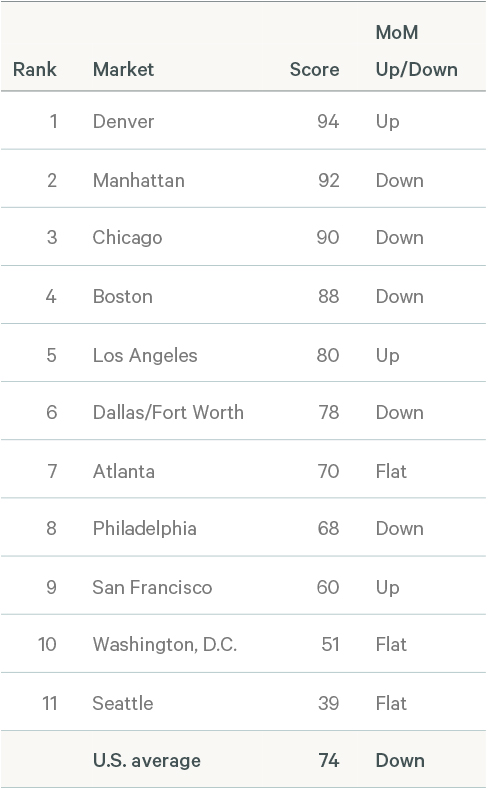
- The U.S. Tenants in the Market Index fell 5 points to 74 in August, the lowest level since February 2021. San Francisco (+5 points), Denver (+3) and Los Angeles (+3) were the only markets that recorded increases in their TIM Index.
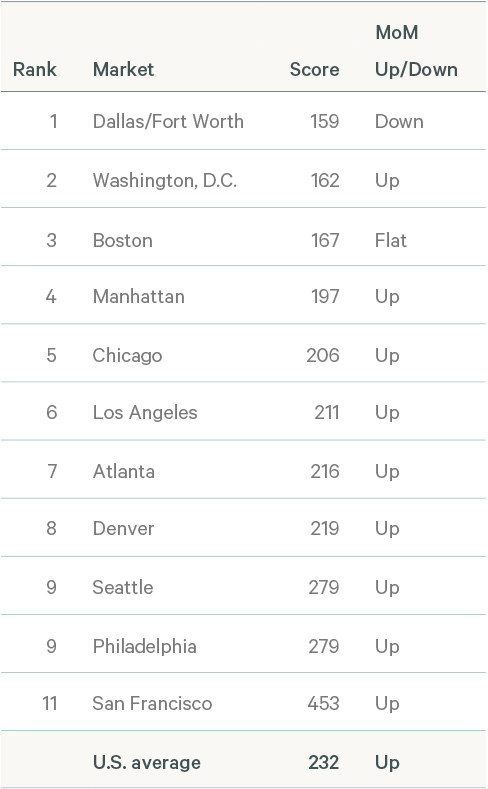
- The U.S. Sublease Availability Index increased 7 points and reached a pandemic-era high of 232 in September. San Francisco (+20 points) and Seattle (+17) added the most sublease space, primarily from technology companies.
- Nine of the 11 Pulse markets had increased sublease availability, while the index fell slightly in Dallas/Fort Worth (-1 point) and was unchanged in Boston.
What is the CBRE Pulse Report?
To gauge the pace of recovery, CBRE has created three indices for 11 major U.S. office markets—Atlanta, Boston, Chicago, Dallas/Fort Worth, Denver, Los Angeles, Manhattan, Philadelphia, San Francisco, Seattle and Washington, D.C.
Using CBRE data, these indices measure office market activity each month and provide early indications of when and where momentum in office demand may be shifting.
These metrics—space requirements of active tenants in the market (TIM), leasing activity and sublease availability—provide a clear picture of office demand amid the COVID-19 pandemic.
Note: Houston has been removed from the Pulse report and all historical data points have been restated.
Figure 1: Indexed Average Performance of Sublease Availability, TIM and Leasing Activity for the Top 11 U.S. Markets
Source: CBRE Research, September 2022.
September Demand Recovery by Market
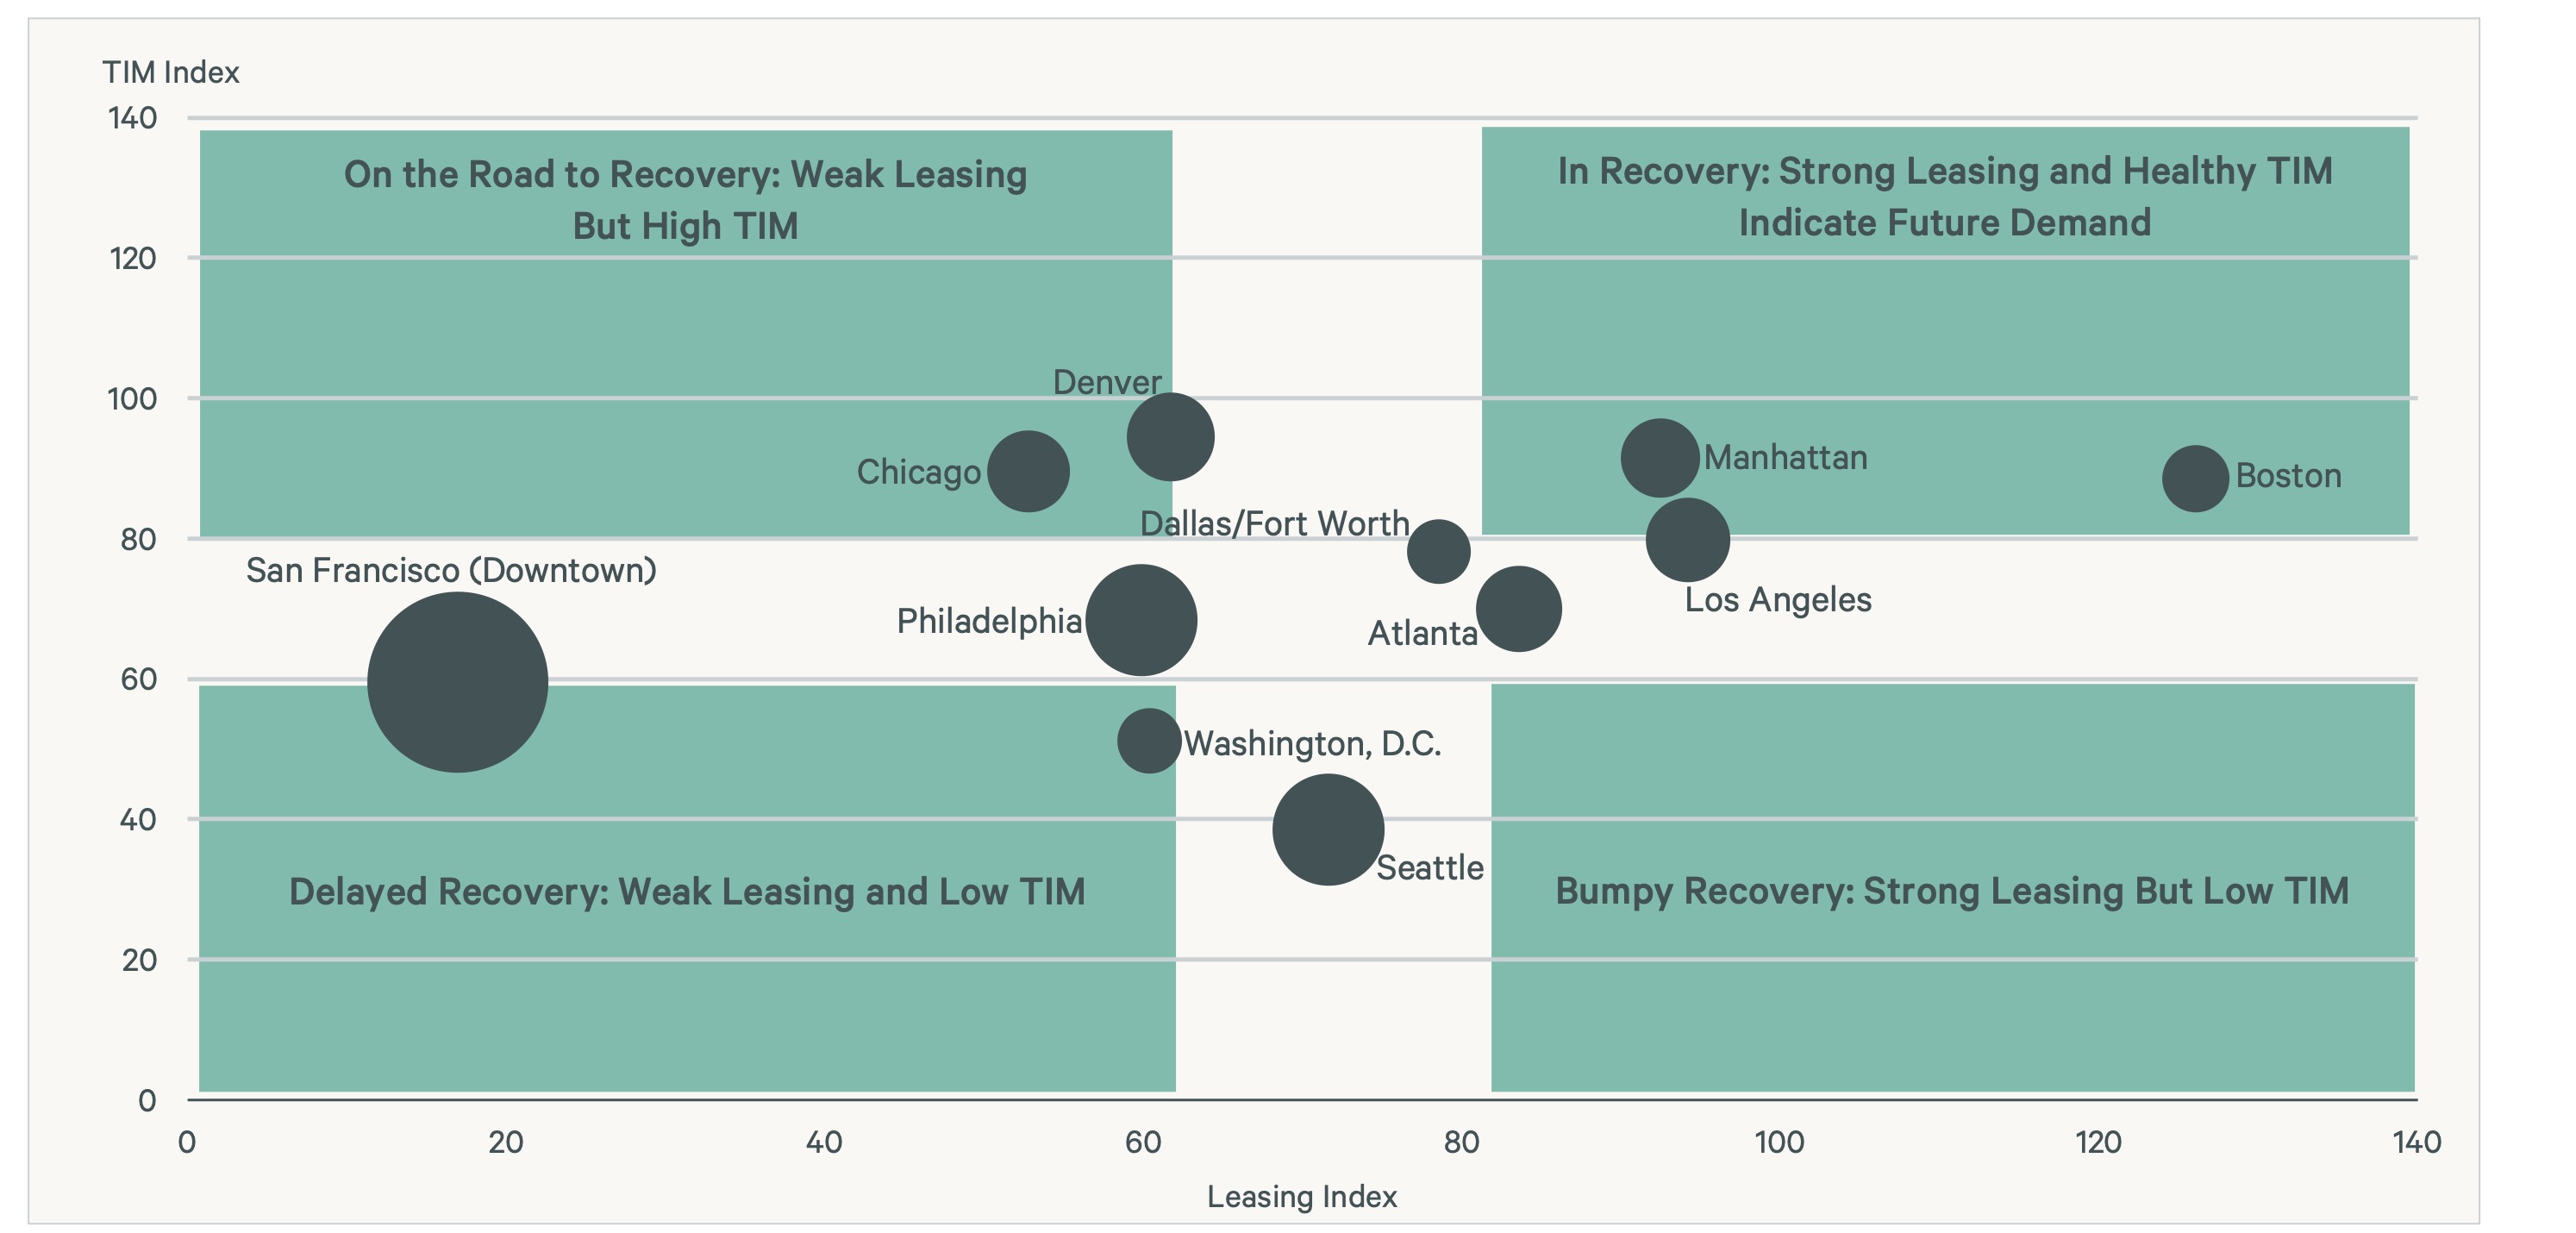
Boston continued to set the pace for office demand recovery in September, driven by strong leasing and a healthy TIM index indicating future demand. Leasing activity increased in only three of the 11 Pulse markets: Manhattan, Boston and Dallas/Fort Worth. Nine markets had increased sublease availability, while Dallas/Fort Worth had a slight decline and Boston had no change.
Figure 2: September Office Market Recovery Index, Top U.S. Markets
Source: CBRE Research, September 2022.
Note: Sublease Index Level is denoted by size of bubble (The bigger the bubble, the greater the availability).
Leasing Activity Index
Figure 3: Indexed Monthly Leasing by Market Compared with 2018/2019 Average
Source: CBRE Research, September 2022.
Figure 4: September 2022 Leasing Activity Index – Top 11 U.S. Markets
Source: CBRE Research, September 2022.
Leasing Index methodology note: Leasing activity includes all new leases, expansions and renewals of 10,000 sq. ft. or more that close each month. The Leasing Activity Index uses a rolling three-month average of leasing activity. Most markets the weighted 20% for the current month, 50% for the previous month and 30% for two months prior. For New York and Boston, where more accurate leasing data is available by the end of each month, the weights are 50% for the current month, 30% for the previous month and 20% for two months prior. The monthly rolling average is compared with a pre-pandemic baseline, which is the average monthly leasing activity between 2018 and 2019. The index level for the baseline is 100.
Tenants in the Market Index
Figure 5: Indexed Square Footage of Tenant Requirements Compared with 2018/2019 Average
Source: CBRE Research, September 2022.
Figure 6: September 2022 TIM Index – Top 11 U.S. Markets
Source: CBRE Research, September 2022.
TIM Index methodology note: CBRE tracks the total square footage of requirements from active tenants in the market, with minimum requirements of 10,000 sq. ft. The TIM Index compares the total monthly TIM requirements to a pre-pandemic baseline, which is the average of TIM requirements recorded by CBRE in 2018 and 2019. The index level for the baseline is 100. In most cases, when tenant requirements are given as a range, the index uses the minimum square footage., However, Seattle records TIM using the average requirement within the tenants' size range, while Philadelphia uses the maximum square footage.
Sublease Availability Index
Figure 7: Indexed Sublease Availability by Market Compared with 2018/2019 Average
Source: CBRE Research, September 2022.
Figure 8: September 2022 Sublease Availability Index – Top 11 U.S. Markets
Source: CBRE Research, September 2022.
Sublease Index methodology note: Sublease availability measures the total square footage of sublease space available for occupancy. The Sublease Availability Index compares monthly sublease availability totals with a pre-pandemic baseline, which is the average amount of sublease space available in 2018 and 2019. The index level for the baseline is 100.
Note: In contrast to the Leasing and TIM Indices, a higher score on the Sublease Index is considered undesirable as it reflects an increase in available sublease space.
Related Insights
- Brief | Intelligent Investment
U.S. Office Demand Slows Again in August
September 22, 2022 5 Minute Read
Office demand fell for the third consecutive month in August, as occupiers continued to put off leasing decisions amid recession concerns.
Demand for office space slowed in July, as high inflation and economic uncertainty weighed on occupier decision-making about long-term lease commitments.
- Brief | Intelligent Investment
U.S. Office Leasing Remains Tepid in June
July 20, 2022 5 Minute Read
Demand for office space cooled in June. High inflation and economic uncertainty have caused occupiers to delay making long-term lease commitments.
- Brief | Intelligent Investment
Tenant Requirements Grow But Occupiers Remain Cautious in May
June 22, 2022 5 Minute Read
U.S. office occupiers continued to delay long-term lease commitments amid heightened uncertainty. However, tenant requirements continued to grow.


Insights in Your Inbox
Stay up to date on relevant trends and the latest research.