Intelligent Investment
U.S. Office Leasing Remains Tepid in June
CBRE Pulse of U.S. Office Demand
July 20, 2022 5 Minute Read
Looking for a PDF of this content?
- Demand for office space cooled in June. High inflation and economic uncertainty have caused occupiers to delay making long-term lease commitments.
- The U.S. Leasing Activity Index fell 4 points to 91 in June. The index is down by 8 points since January but is up by 15 points from a year ago.
- Three of the 12 Pulse markets recorded increases in their June Leasing Activity Index levels: San Francisco (+18 points), Seattle (+16 points), and Dallas/Fort Worth (+2 points). Index levels were unchanged in Houston and fell in the remaining eight markets.
- The U.S. Tenants in the Market Index edged down 2 points to 93 in June. Despite the slight drop, the index remains near the pandemic-era high of 95.
- The U.S. Sublease Availability Index was unchanged at a level of 201 in June. The index has increased by 5 points since the start of the year but remains below the pandemic-era high of 206.
- Despite a downtick in June leasing activity, Boston continued to lead the Pulse markets in office demand recovery, followed by Dallas/Fort Worth and Los Angeles.
What is the CBRE Pulse Report?
To gauge the pace of recovery, CBRE has created three indices for the 12 largest U.S. office markets—Atlanta, Boston, Chicago, Dallas/Fort Worth, Denver, Houston, Los Angeles, Manhattan, Philadelphia, San Francisco, Seattle and Washington, D.C.
Using CBRE data, these indices measure office market activity each month and provide early indications of when and where momentum in office demand may be shifting.
These metrics—space requirements of active tenants in the market (TIM), leasing activity and sublease availability—provide a clear picture of office demand amid the COVID-19 pandemic.
Figure 1: Indexed Average Performance of Sublease Availability, TIM and Leasing Activity for the Top 12 U.S. Markets
Source: CBRE Research, June 2022.
June Demand Recovery by Market
Only three markets saw an increase in leasing activity in June—San Francisco and Seattle, though their index levels remained well below their pre-pandemic baseline, and Dallas/Fort Worth. Boston continued to set the pace for office demand recovery, though its leasing activity slipped in June. Occupiers remained cautious in most markets as tenant requirements declined nationally and sublease availability remained elevated.
Figure 2: June Office Market Recovery Scale, Top U.S. Markets
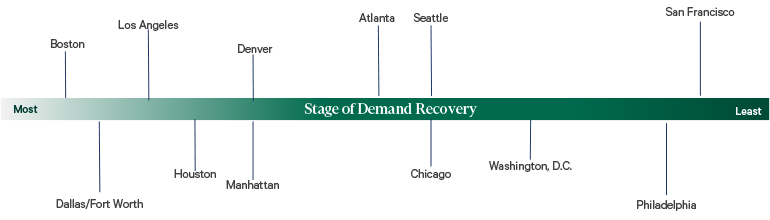
Source: CBRE Research, June 2022.
Tenants in the Market Index
Figure 3: Indexed Square Footage of Tenant Requirements Compared with 2018/2019 Average
Source: CBRE Research, June 2022.
Figure 4: : June 2022 TIM Index–Top 12 U.S. Markets
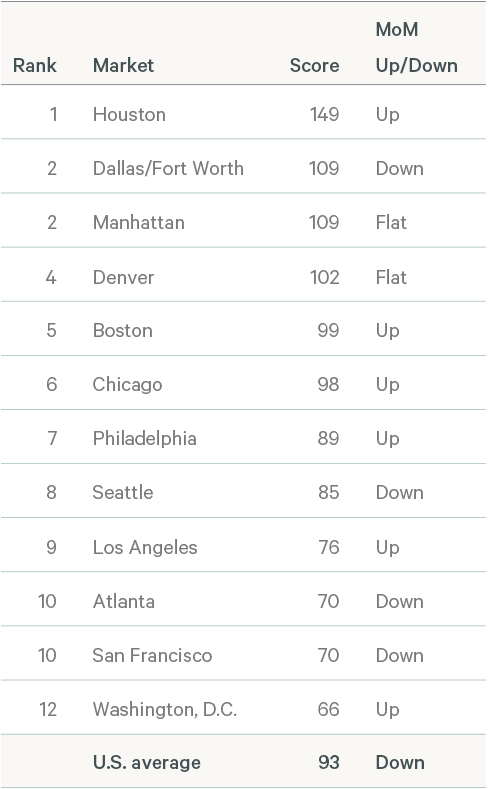
Source: CBRE Research, June 2022.
TIM Index methodology note: CBRE tracks the total square footage of requirements from active tenants in the market, with minimum requirements of 10,000 sq. ft. The TIM Index compares the total monthly TIM requirements to a pre-pandemic baseline, which is the average of TIM requirements recorded by CBRE in 2018 and 2019. The index level for the baseline is 100. In most cases, when tenant requirements are given as a range, the index uses the minimum square footage., However, Seattle records TIM using the average requirement within the tenants' size range, while Philadelphia uses the maximum square footage.
Leasing Activity Index
Figure 5: Indexed Monthly Leasing by Market Compared with 2018/2019 Average
Source: CBRE Research, June 2022.
Figure 6: June 2022 Leasing Activity Index – Top 12 U.S. Markets
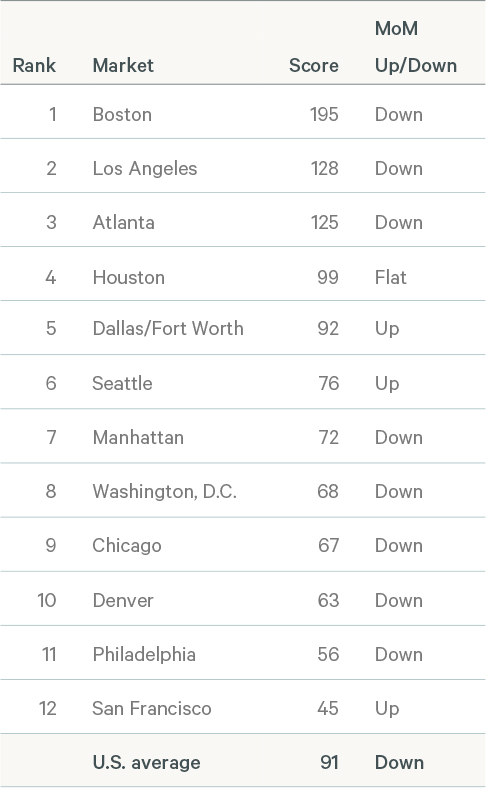
Source: CBRE Research, June 2022.
Leasing Index methodology note: Leasing activity includes all new leases, expansions and renewals of 10,000 sq. ft. or more that close each month. The Leasing Activity Index uses a rolling three-month average of leasing activity. Most markets the weighted 20% for the current month, 50% for the previous month and 30% for two months prior. For New York and Boston, where more accurate leasing data is available by the end of each month, the weights are 50% for the current month, 30% for the previous month and 20% for two months prior. The monthly rolling average is compared with a pre-pandemic baseline, which is the average monthly leasing activity between 2018 and 2019. The index level for the baseline is 100.
Sublease Availability Index
Figure 7: Indexed Sublease Availability by Market Compared with 2018/2019 Average
Source: CBRE Research, June 2022.
Figure 8: June 2022 Sublease Availability Index – Top 12 U.S. Markets
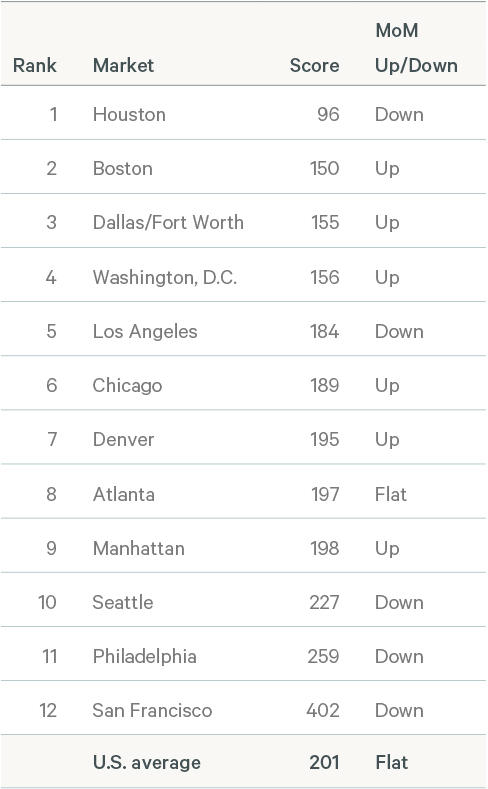
Source: CBRE Research, June 2022.
Sublease Index methodology note: Sublease availability measures the total square footage of sublease space available for occupancy. The Sublease Availability Index compares monthly sublease availability totals with a pre-pandemic baseline, which is the average amount of sublease space available in 2018 and 2019. The index level for the baseline is 100.
Note: In contrast to the Leasing and TIM Indices, a higher score on the Sublease Index is considered undesirable as it reflects an increase in available sublease space.
Related Insights
- Brief | Intelligent Investment
Tenant Requirements Grow But Occupiers Remain Cautious in May
June 22, 2022 5 Minute Read
U.S. office occupiers continued to delay long-term lease commitments amid heightened uncertainty. However, tenant requirements continued to grow.
U.S. office leasing activity edged slightly higher in April, while tenant requirements ticked down and sublease availabilities were unchanged.
- Brief | Intelligent Investment
U.S. Office Leasing Activity Slows in March but Tenant Interest Grows
April 20, 2022 5 Minute Read
Tenant requirements climbed to a pandemic-era high in March, but the rise in search activity wasn't enough to improve CBRE's Pulse of U.S. Office Demand tracker.
The CBRE Pulse of U.S. Office Demand slowed for a second consecutive month in February.
Contacts


Insights in Your Inbox
Stay up to date on relevant trends and the latest research.