Evolving Workforces
Global Talent Migration: The ‘New Mobility’ Paradigm
February 27, 2024 5 Minute Read

Executive Summary
The movement of talent across borders has become a critical issue for corporate occupiers as widely adopted hybrid work schedules have given office workers more mobility than ever. A CBRE Consulting analysis led to four key takeaways, fueled by a mix of economic, demographic and social factors:
- Global talent migration is on the rise and shows no signs of diminishing.
- Germany, the U.K., Canada and the U.S. continue to receive the bulk of international migration.
- Most international talent is moving to major cities, but domestic migration within a country is more split between established and emerging urban centers.
- Younger workers tend to migrate most. They seek better career prospects, lifestyles and labor market conditions/benefits.
Key Talent Migration Drivers
The number of people who moved across international borders increased to 281 million in 2020 (3.6% of world population) from 174 million in 2000 (2.8% of world population).1 The World Economic Forum projects approximately 4% of the world’s population will move across borders by 2030, resulting in more global talent mobility than ever before.
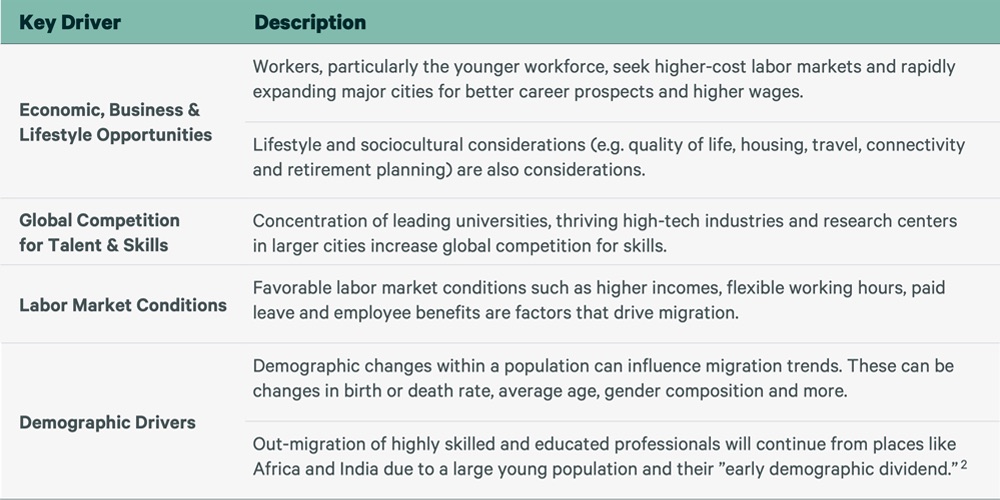
The ever-evolving movement of global talent is fueled by a mix of economic, demographic and social factors amid an intense competition for talent.

Figure 1: Key Talent Migration Drivers
Planned Migration Has Increased Globally
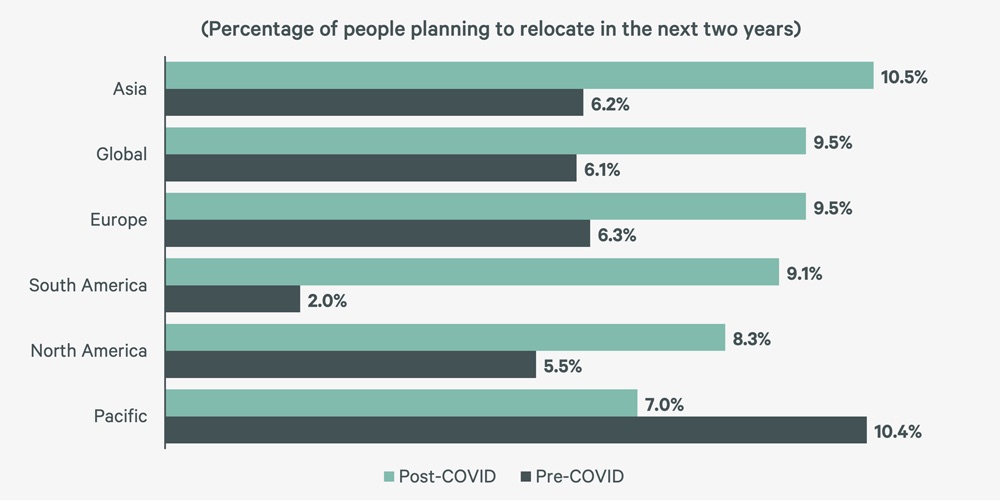
The number of people who are choosing to move internationally is at an all-time high and has increased in almost all regions, according to CBRE’s Global Live-Work-Shop report. As employers develop location strategies, the movement of talent must be a key consideration alongside macroeconomic considerations.
Figure 2: Pre- and Post-COVID Talent Movements Globally and by Region
Migration By Regions
International talent movement as measured solely on net inflow can be misleading because countries have different propensities to absorb skilled workers based on national population size. Therefore, CBRE evaluated each region based on international talent migration as a percentage of the total population. European countries such as Germany and the U.K. and North American countries such as Canada and the U.S. receive the bulk of the talent moving internationally.
Figure 3: Distribution of International Migrant Population by Income Group
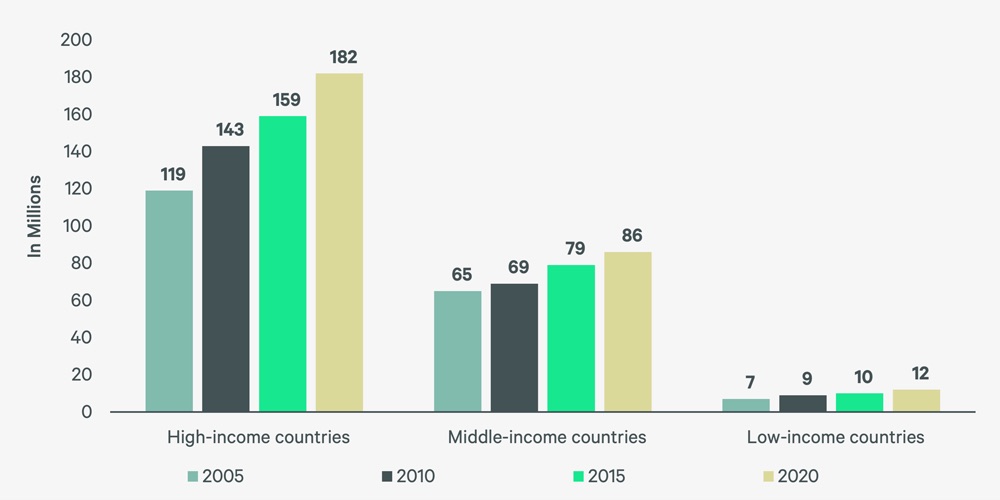
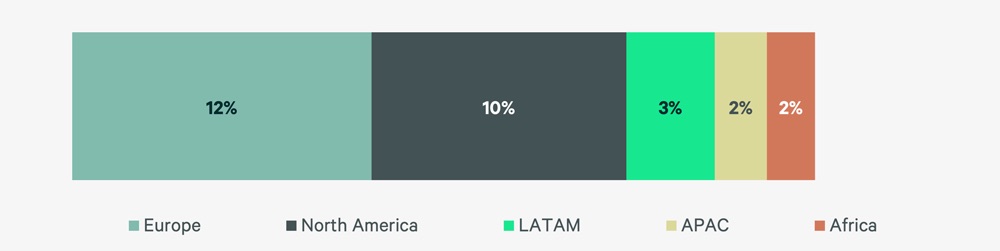
Figure 4: Distribution (%) of International Migrant Population by Region
Demographic Variation By Country
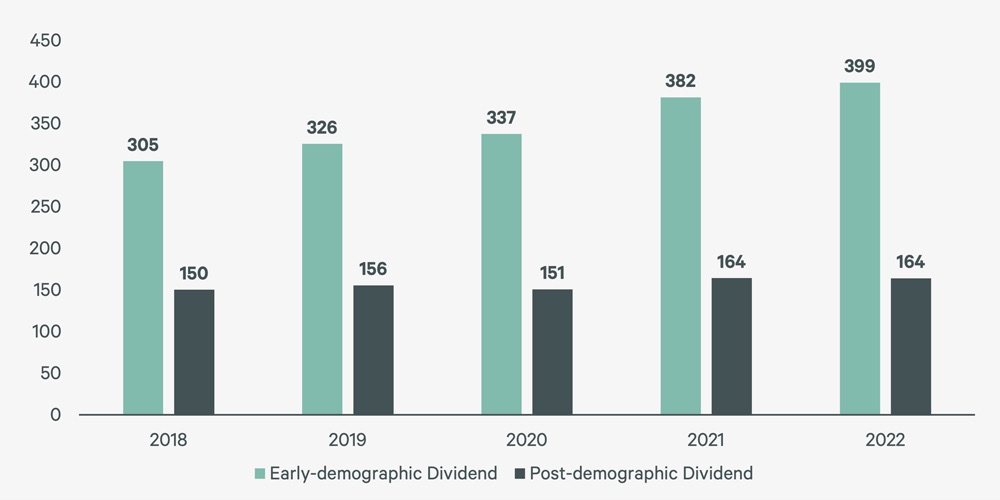
Countries that receive the most internationally relocating talent, such as those in Europe and North America, have the highest “post-demographic dividend.”3 In contrast, countries that lose the most residents, particularly young workers, due to migration are “early demographic dividend”4 countries. “Early demographic dividend” countries, such as China, India and the Philippines, receive the highest remittances, which are portions of compensation that expatriate workers send back to family in their native countries. These remittances boost the recipient countries through higher disposable incomes of receiving families, resulting in increased consumer spending and investments in the economy.
CBRE identified the top countries for in-migration such as those in Europe and North America in each region based on a combination of factors such as net talent inflows, both in absolute terms and as a percentage of total population, and the movement of talent from mid- and high-income countries (Figure 5).
Figure 5: Remittances Received (USD billion) by Demographic Dividend
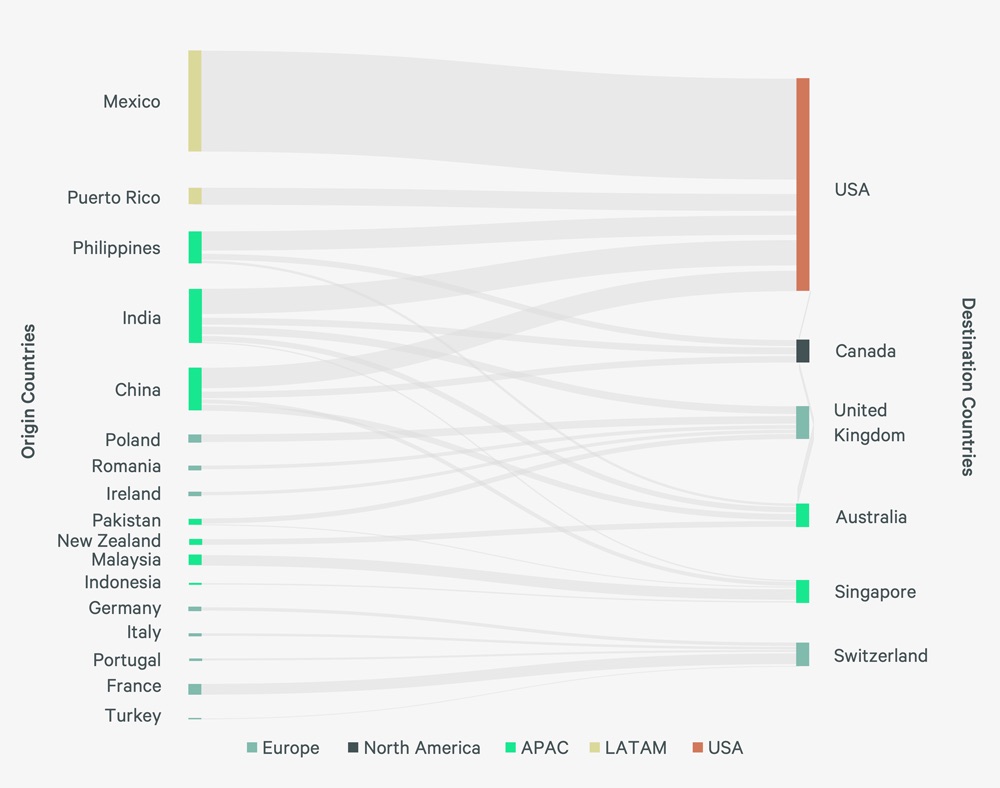
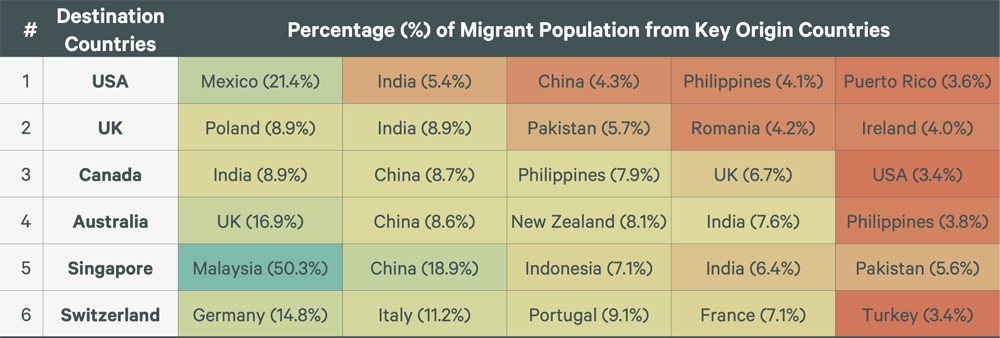
The movement of talent by region is nuanced. The U.S. and Canada attract talent from the Philippines, India and China (Figure 6). The U.K. is a top destination for Indian talent, too, but also draws talent from continental Europe, notably Poland and Romania, as well as Ireland. Switzerland primarily attracts talent from other developed countries. In APAC, Australia draws talent from India, China, the Philippines and New Zealand, while Singapore attracts talent from nearby countries such as Indonesia and Malaysia, as well as China and India.
Figure 6: International Migration by Region
Attractiveness of Global Cities
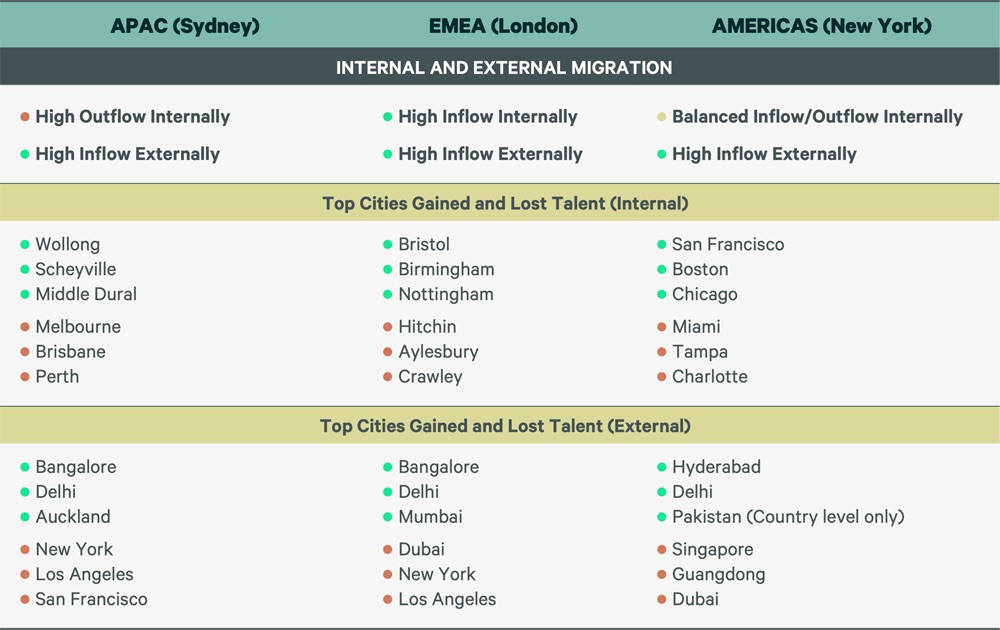
Most internationally migrating talent settles in major cities, but fewer people who move within a country are drawn to established urban centers. For example, Sydney, London and New York—which are each a top city in a different global region—saw different domestic talent migration flows. Sydney had a net outflow, London had a net inflow and New York had an even balance between domestic inflow and outflow (Figure 7).
Figure 7: Internal and External Talent Migration Movements Across Key Cities
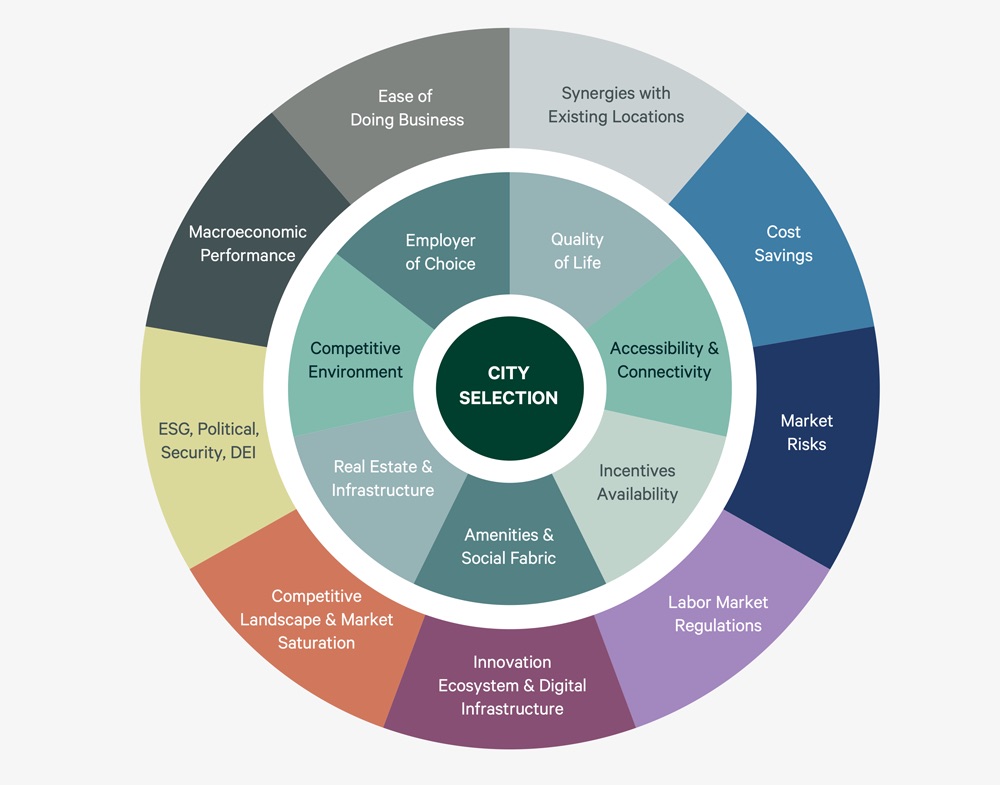
While many factors influence a city or region’s international talent attraction, Figure 8 shows the common reasons that motivate skilled workers to choose where they work. When formulating workforce location strategies, employers must weigh the most relevant criteria for the cities under consideration based on their unique business needs.
Figure 8: Key Criteria For City Selection
The Big Picture
The right long-term workforce strategy requires deeply understanding location trends and employee expectations, potentially necessitating organizational changes to increase the appeal to prospective talent. This may entail developing a holistic plan to capture talent that is moving across international borders, particularly highly skilled workers, that flows from a global, regional and in-country location strategy.
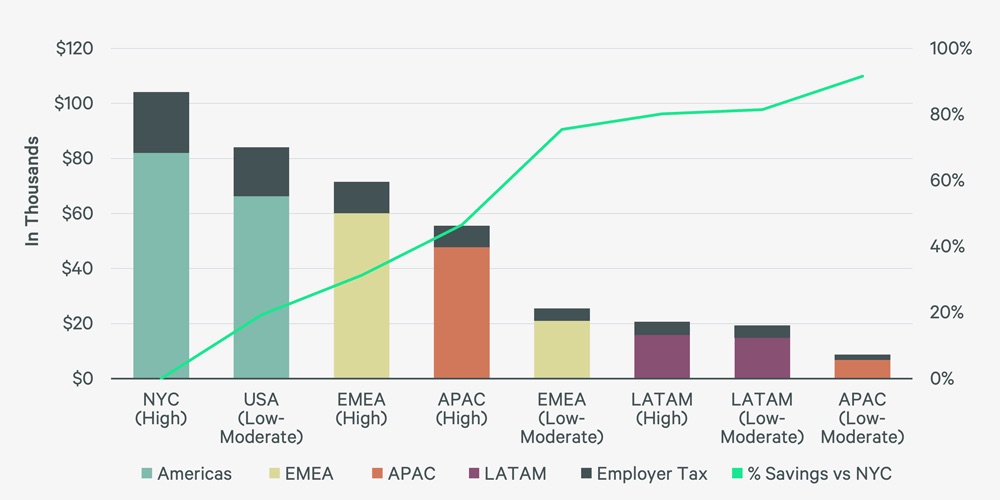
Migration also presents an opportunity for businesses to maximize the cost savings available by sourcing talent in new markets. For example, a company can achieve the most cost savings by filling a financial analyst role in low-to-moderate-cost APAC markets, followed by LATAM markets (Figure 9). As a result, employers can lower their total labor and real estate costs while meeting their talent needs.
Figure 9: Financial Analyst Labor Cost Annual Average (USD)
1 “International migrants” are defined in this context as individuals who have changed residence from their usual home country to an international country where they are not nationals. Data sources include the United Nations, social media profiles and proprietary CBRE research. This data is tracked in 10-year intervals.
2 See Demographic Variation By Country section for an explanation.
3 The World Bank defines “post-demographic dividend” countries as mostly high-income countries where fertility is below replacement levels.
4 The World Bank defines “early-demographic dividend” countries as mostly lower-middle-income countries where the working-age share of the population is rising considerably.
Related Services
- Transform Business Outcomes
Consulting
Gain comprehensive guidance on insightful, executable real estate strategies for both investors and occupiers.
- Consulting
Labor Analytics
Make better location decisions with a holistic approach that weighs factors like labor costs and availability, supply chain logistics, and incentives.
Related Insights
-

A comprehensive analysis of tech labor supply, cost and quality in 75 global markets to help decision-makers fulfill critical business and innovation objectives.
-

Securing top talent for highly specialized cybersecurity roles has become more challenging than ever.
-
Article | Evolving Workforces
Artificial Intelligence Tech Hubs: Asia Pacific Talent Spotlight
May 23, 2023

2023 has been marked with the advent of mass scale adoption of Artificial Intelligence (AI). 2022 saw a record amount of investment in generative AI start-ups, with equity topping
-

U.S. companies across many sectors are increasingly using artificial Intelligence, but it's no surprise that the software and technology industry dominates this field, employing more talent than the other four industries combined.
Contacts
Udit Sabharwal
Associate Director, Regional Consulting, Asia Pacific

Arpan Barua
Managing Director, Data Center Consulting Lead – Americas, Advisory & Transaction Services