Intelligent Investment
Tech-30 2024
Measuring the Tech Industry’s Impact on U.S. & Canadian Office Markets
November 11, 2024 10 Minute Read

Key Takeaways
Looking for a PDF of this content?
1. How is the tech industry performing, and how will AI impact future job and office space demand?
Tech industry job growth has slowed but remains the strongest for office-using sectors. However, tech companies have significantly downsized space portfolios. Artificial intelligence (AI) is expected to become an increasingly key job growth and office demand catalyst for Tech-30 markets.
1.2M
Jobs created since 2014
475K
Jobs created since 2019
2. Which are the top markets for high-tech job growth?
Toronto, Nashville and Dallas-Ft. Worth led North America for high-tech job growth rate in 2023, followed closely by Indianapolis and Raleigh-Durham. Six other U.S. markets had a growth rate above the 0.3% national rate, including Charlotte, Silicon Valley and Austin. Toronto created the most net new jobs (+17,600) in aggregate.
+10%
Toronto
+5%
Nashville
+5%
Dallas-Ft. Worth
3. How are tech office markets performing?
Stabilization Underway: Sublease space abating, leasing activity increasing and AI emerging.
Most Tech-30 office markets are entering the stabilization phase of the office market cycle. Tech submarkets lag their overall markets, with higher vacancies due to tech company footprint reductions. Lease expirations have reduced available sublease space in recent quarters. AI deployment has been a driver behind leasing activity from the tech sector.
4. Which tech markets are positioned for renewed growth?
These markets have the best combination of future tech demand drivers and office market fundamentals.
- Nashville
- Charlotte
- Dallas- Ft. Worth
- Atlanta
- Vancouver
- San Francisco
- Seattle
- Boston
- Toronto
- Manhattan
5. Tech Industry Indicators
Financial markets are the best indicators for the tech industry and its future growth. Rising venture capital (VC) funding and Nasdaq stock index suggest growth acceleration ahead with AI being a major catalyst.
6. How diverse is the tech industry?
U.S. tech industry diversity by race, ethnicity and sex has improved over the past five years, but the industry remains mostly male (67%), white (56%) and Asian (19%). Hispanics, Blacks and other races have roughly equal representation within U.S. tech and office-using industries. Canada’s tech industry is also mostly male (69%), white (55%) and Asian (35%). Hispanics, Blacks and other races within Canada's tech industry slightly exceed office-using industries but representation is lower (10%) than the U.S. (25%). Female employees are underrepresented in U.S. (33%) and Canada (31%) tech industries, compared with the office-using benchmark of 50% and 57%, respectively.
Figure 1A: U.S. Workforce by Race/Ethnicity & Sex for Selected Industries (2022)
Note: Office-using includes occupations that are typically performed in an office setting (excluding tech talent).
Figure 1B: Canada Workforce by Race/Ethnicity & Sex for Selected Industries (2022)
Note: Office-using includes occupations that are typically performed in an office setting (excluding tech talent).
33%
Female
26%
Hispanic/ Black/Other
Explore Tech-30 Markets
How is the tech industry performing, and will AI impact future job and office space demand?
Tech industry jobs have grown consistently since 2010 amid economic expansion and turmoil, as well as layoffs.
The tech software and services sector, which primarily occupies office space, has exceeded overall office job growth every year between 2007 and 2021 (Figure 2). U.S. tech job growth decelerated from 5.4% in 2021 to 0.3% in 2023, due to increased layoffs and reduced hiring. Tech jobs have rebounded this year and were up 1.0% through July 2024.
Figure 2: U.S. Job Growth for High-Tech vs. Other Industries
0.3%
U.S. tech job growth in 2023
From 2007 to 2024, tech software and services jobs grew 75%, well above life sciences (54%), office-space-using industries (14%) and total U.S. jobs (17%). Tech job growth is 13% higher than in 2019 and layoffs are abating, indicating that the cost-cutting cycle is bottoming (Figure 3). Many tech companies are refocusing business strategy, capital expenditures and new hiring on key growth initiatives and emerging technologies such as AI.
AI is expected to transform all businesses and become a major job growth driver for the tech industry.
AI’s ability to automate tasks and enhance routine and cognitive activities will create entirely new business opportunities, much like mobile internet devices enabled the app economy more than a decade ago. This potential favors many tech-oriented economies and office markets.
AI could lead to a reduction in office jobs with easily automated tasks. Technology research firm Forrester predicts1 that AI could replace 2.4 million or 1.5% of U.S. jobs by 2030, with higher-earning white-collar jobs being more vulnerable. However, this same report indicates that AI will change even more jobs (11.1 million), indicating that workers will need to leverage the technology rather than compete with it.
Figure 3: Annual U.S. Layoffs & Tech Industry Share
75%
Growth in tech software & services jobs, 2007-2024
2.4M
Jobs that could be replaced by AI by 2030
Undoubtedly, AI-related technology will create new job categories that could easily outpace jobs lost due to AI.
Using U.S. Census data, an MIT study2 found 60% of workers in 2018 were employed in occupations that did not exist in 1940, suggesting that the technology-driven creation of new occupations broadly accounts for more than three-fourths of employment growth over the last 78 years.
Many tech companies are repositioning their workforces and capital expenditures toward AI development and deployment. Leading U.S. tech giants, utilities and other companies are expected to spend about $1 trillion on capital expenditures for AI technology and infrastructure between 2024 and 2027, according to Goldman Sachs.3
AI VC funding has surged as well. In the first half of 2024, $22.6 billion was invested in AI startups, the highest half year since 2019 (Figure 4). AI’s share of total VC funding reached 35% in H1 2024, also its highest level and almost double the share of 2023. While VC funding for AI startups has grown at a high rate, it is dwarfed by AI-related spending by large tech corporations.
3 Gen AI: too much spend, too little benefit?, June 2024.
Figure 4: U.S. Venture Capital Funding & Artificial Intelligence Share
$1T
Expected capital expenditures on AI between 2024 and 2027
35%
AI share of VC funding in H1 2024, the highest half year since 2019
By market, AI VC funding is highly concentrated in the San Francisco Bay Area. Since 2019, San Francisco and San Jose combined have accounted for 57% ($80.5 billion) of AI VC funding (Figure 5). New York ($19.7 billion), Boston ($11.6 billion) and Los Angeles ($5.8 billion) were the next highest markets. The recent acceleration of AI VC funding is even more concentrated in the San Francisco Bay Area, which captured 76% of H1 2024 funding.
New AI hiring has already surged because of increased capital expenditures and VC funding. AI job postings jumped from 9% of total tech talent openings in 2023 to 21% as of August 2024. In the years ahead, this will have a multiplier effect on new hiring across tech companies and other industries.
Figure 5: AI VC Funding by Metro Area and Year
57%
San Francisco and San Jose share of AI VC funding
21%
Total AI tech talent job openings in August 2024, compared to 9% in 2023
AI startups added to increased tech industry office leasing activity, especially in the top VC-funded markets.
U.S. tech industry leasing volume started to rebound in Q2 2023 even as overall office leasing declined. Tech’s share of overall office leasing rose from 9% (3.9 million sq. ft.) in Q4 2022 to 13% (4.5 million sq. ft.) in Q2 2023, whereas overall office leasing trended down to pandemic lows by Q2 2023 (Figure 6). Tech leasing continues to rise and in Q3 2024 reached a 21% share and reclaimed the top spot for industry leasing. Canada tech leasing bottomed out in 2023, accounting for 10.3% of total leasing compared with 15.2% for YTD 2024.
AI startups have grown their office footprints across the top five VC-funding markets, with 10.8 million sq. ft. leased across more than 470 deals since 2019 (Figure 7). San Francisco and Silicon Valley were the most active markets for AI leasing by volume, with 3.9 and 2.6 million sq. ft. leased, respectively. Boston was the next highest market with 2.2 million sq. ft. leased since 2019. AI company demand for office space is expected to further rise. For example, San Francisco had more than 25 AI companies seeking 1.0 million sq. ft. of space as of August 2024, which would increase their current footprint by 20%.
Figure 6: U.S. Office Leasing Activity & Tech Industry Share
Note: Leasing activity includes direct, sublease and renewal transactions ≥ 10,000 sq. ft. in the top 50 markets tracked by CBRE Research.
Figure 7: Office Leasing Activity by Metro Area for VC-Backed Artificial Intelligence Companies
21%
Tech share of U.S. leasing in Q3 2024
Much of the overall rise in tech industry leasing has been cyclical or driven by expirations of leases originally signed 5-10 years ago. Such activity has not yet produced occupancy gains. Hybrid and remote work policies are likely playing a role in reduced space needs. About 30 million people in the U.S. worked remotely at least some of the time in 2024, which accounted for 19.5% of employed people, nearly double the 10% who worked remotely in 2020, according to the Labor Force Statistics from the Current Population Survey. Office-using industries including information, financial activities and professional and business services had higher remote work rates at 48% in 2024. Office workers who work remotely did so about two days per week (36% of the time). This is consistent with office building security company Kastle Systems, which reported average badge swipes in August 2024 were about half of pre-pandemic levels.
The technology industry is in the early stages of what could be a large growth cycle driven by AI development and deployment. AI innovation will likely create more jobs than it replaces and increase office space leasing demand in Tech-30 markets.
19.5%
Employed people in the U.S. who work remotely at least some of the time
48%
Remote work rate for office-using industries
Which are the top markets for high-tech job growth?
The Tech-30 comprises markets in the U.S. and Canada with the largest and most concentrated tech industry employment relative to other office-space-using industries.
High-tech employment grew 0.3% in the U.S. and 4.6% in Canada in 2023, considerably slower than the 4.1% and 6.6% growth, respectively, in 2022. Twelve markets exceeded their national high-tech job growth rate average, including Nashville, Dallas-Ft. Worth, Indianapolis and Raleigh-Durham (Figure 8). Only Toronto exceeded the Canadian high-tech job growth rate average. Sixteen other markets in the U.S. and two in Canada grew less than their national averages, including Vancouver, Seattle and San Francisco. Toronto (17,600), Dallas-Ft. Worth (6,648) and Montreal (3,400) created the most net new jobs.
Figure 8: High-Tech Software/Services Job & Office Rent Growth
Toronto, Vancouver and Austin had the highest high-tech job growth from 2019 to 2023, each more than 40%. Job growth in 23 markets was positive during this same time period.
These job growth patterns show many of the traditional and larger tech hubs underperforming and interior and southern markets outperforming. Past layoffs and employers adopting flexible work arrangements impacted these office markets.
Office Market Fundamentals
Tech-30 markets have been influenced by unique factors beyond the traditional supply and demand relationship.
The pandemic and remote work policies kept many workers away from tech company offices for long periods of time. This caused occupiers to flood the market with excess office space beginning in 2020, which correspondingly lowered demand. Office landlords did not significantly lower rents in response to weakened demand and rising supply, since much of it was sublease space.
Since 2022, direct vacancy, operating expenses and debt service costs all rose significantly and caused cash flow issues for many office landlords. This dynamic prevented many owners with high acquisition prices from dropping rents below operating and debt service costs.
Under previous high supply-low demand circumstances, office rents declined by larger amounts. Average asking rents in the U.S. were down 18% from 2000-2003 (dot-com bubble bust) and 11% from 2007-2010 (Global Financial Crisis), compared to a 2% increase from 2019-2024.
Aggregate vacancy rates across the Tech-30 rose from 12.3% in Q4 2019 to 21.6% in Q2 2024 (Figure 9). Tech submarkets had a similarly sharp rise from 10.8% to 22.4% over this same period. The tech industry contracted its office footprint at a faster rate than other industries and caused vacancy in tech submarkets to exceed that of overall markets for the first time in Q1 2023.
Figure 9: Tech-30 Markets & Submarkets Aggregate Average Vacancy Rate
21.6%
Aggregate vacancy rate in Q2 2024
Direct rents peaked in early 2020 and declined moderately in 2021, when supply began to sharply rise (Figure 10).
Since then, rents and vacancy rates have continued to increase. Also since 2021, the mix of available spaces has changed in many markets with the addition of new buildings and higher-priced existing spaces. This has caused average rents to rise at a time when most buildings are offering incentives, especially on less desirable space.
Figure 10: Tech-30 Markets & Submarkets Aggregate Annual Average Asking Rent
Note: Direct annual average full-service asking rents.
Rents have continued to increase as the mix of available spaces has changed in many markets with the addition of new buildings and higher-priced existing spaces.
Boston, Baltimore, Nashville and Denver posted rent growth of 5% or more between Q2 2023 and Q2 2024. In total, 24 markets had positive rent growth (Figure 11.1). Rents declined in San Francisco, Silicon Valley and Pittsburgh.
Figure 11.1: Rent Growth Overall Market Q2 2023 vs. Q2 2024
Note: Uses direct annual average full-service asking rents.
Tech submarkets had larger rent increases and declines compared with their overall markets. Office rents increased by 5% or more in five tech submarkets between Q2 2023 and Q2 2024, led by BWI in Baltimore, the CBD in Nashville and University City in Philadelphia (Figure 11.2). SOMA in San Francisco, East Cambridge in Boston and the Oakland submarket in Pittsburgh posted rent declines of 5% or more.
Figure 11.2: Rent Growth Top Tech Submarket Q2 2023 vs. Q2 2024
Note: Uses direct annual average full-service asking rents.
24
Total markets with positive rent growth
5
Total tech submarkets with office rent increases of 5% or more
The top markets for net absorption during this period were Nashville, Vancouver and Baltimore (Figure 11.3). The top submarkets for net absorption were Philadelphia’s University City, Nashville’s CBD and Minneapolis-St. Paul’s North Loop (Figure 11.4).
Figure 11.3: Net Absorption Growth Overall Market Q3 2023 - Q2 2024
Figure 11.4: Net Absorption Growth Top Tech Submarket Q3 2023 - Q2 2024
Tech Submarkets Still Command Higher Rents
Leading tech submarkets often outperform their overall office markets because many tech companies are willing to pay a premium in vibrant, centrally located areas preferred by their employees. The tech submarkets with the lowest vacancy rates as of Q2 2024 were Baltimore’s BWI (8.9%), Vancouver’s Broadway Corridor (9.1%), San Diego’s Sorrento Mesa (11.8%), Pittsburgh’s Oakland-East End (12.0%) and South Orange County (13.3%).
Average rental rates for top tech submarkets have remained higher than their overall markets since 2011 and have a 10.1% premium as of Q2 2024 despite a pandemic-era dip in top tech submarket rents. Rents in some top tech submarkets are significantly higher, such as Boston’s East Cambridge (77%), Philadelphia’s University City (72%), Silicon Valley’s Palo Alto (68%), Santa Monica (49%) and Pittsburgh’s Oakland/East End (44%). Several tech submarkets have rent discounts, such as Portland’s Hillsboro (-25%), Northeast Charlotte (-20%), Washington, D.C.’s Reston/Herndon (-17%) and St. Louis’ CBD (-16%).
8.9%
Q2 2024 vacancy rate of Baltimore's BWI, the lowest in this report
77%
Average rental rate premium in Boston's East Cambridge, the highest in this report
Increased Sublease Supply Remains a Market Risk
The tech industry has leased the most U.S. and Canada office space of any industry since 2010. Tech’s share of total U.S. office leasing activity by square footage reached a peak of 21% in 2021, up from 12% in 2010. Growth and occupancy dynamics have evolved, causing many office space occupiers to reassess their portfolio needs. Some companies have reduced their office footprints by subleasing space or not fully renewing leases. While these cost-cutting measures are not isolated to the tech industry, they are more pronounced in tech-oriented markets with high levels of pre-pandemic leasing activity.
Available sublease space in Tech-30 markets started to rise rapidly in 2020 amid reduced tenant demand. Surplus office space has more than doubled since Q4 2019 and reached a high of 181 million sq. ft. in Q2 2023 (Figure 12). The rise in available sublease space varied considerably by market and was directly associated with remote and hybrid work policies, economic uncertainty, layoffs and the concentration of tech companies. Sublease space has since consistently declined since due to space being leased or returned to landlords upon expiration.
Figure 12: Tech-30 Aggregate Available Sublease Office Space & Tech Industry Share
Tech companies currently account for 27% or 44.5 million sq. ft. of available sublease space across Tech-30 markets, up from 20% in 2022 but down slightly in square footage from 2023 (45.0 million sq. ft. or 25%). Potential risk to property owners from sublease space includes the loss of rental income when leases expire and lower cost competition for direct space.
San Francisco, Phoenix, Austin and Raleigh-Durham had the largest sublease availability rate increase between Q1 2020 and Q2 2024, largely driven by tech industry downsizing (Figure 13). San Francisco’s 9.6% current sublease availability rate increased by 5.8 percentage points from 3.8% in Q1 2020. Phoenix (4.6%), Raleigh-Durham (4.5%) and Austin (4.0%) had the next highest percentage-point increases.
Figure 13: Office Sublease Availability Rate by Market*
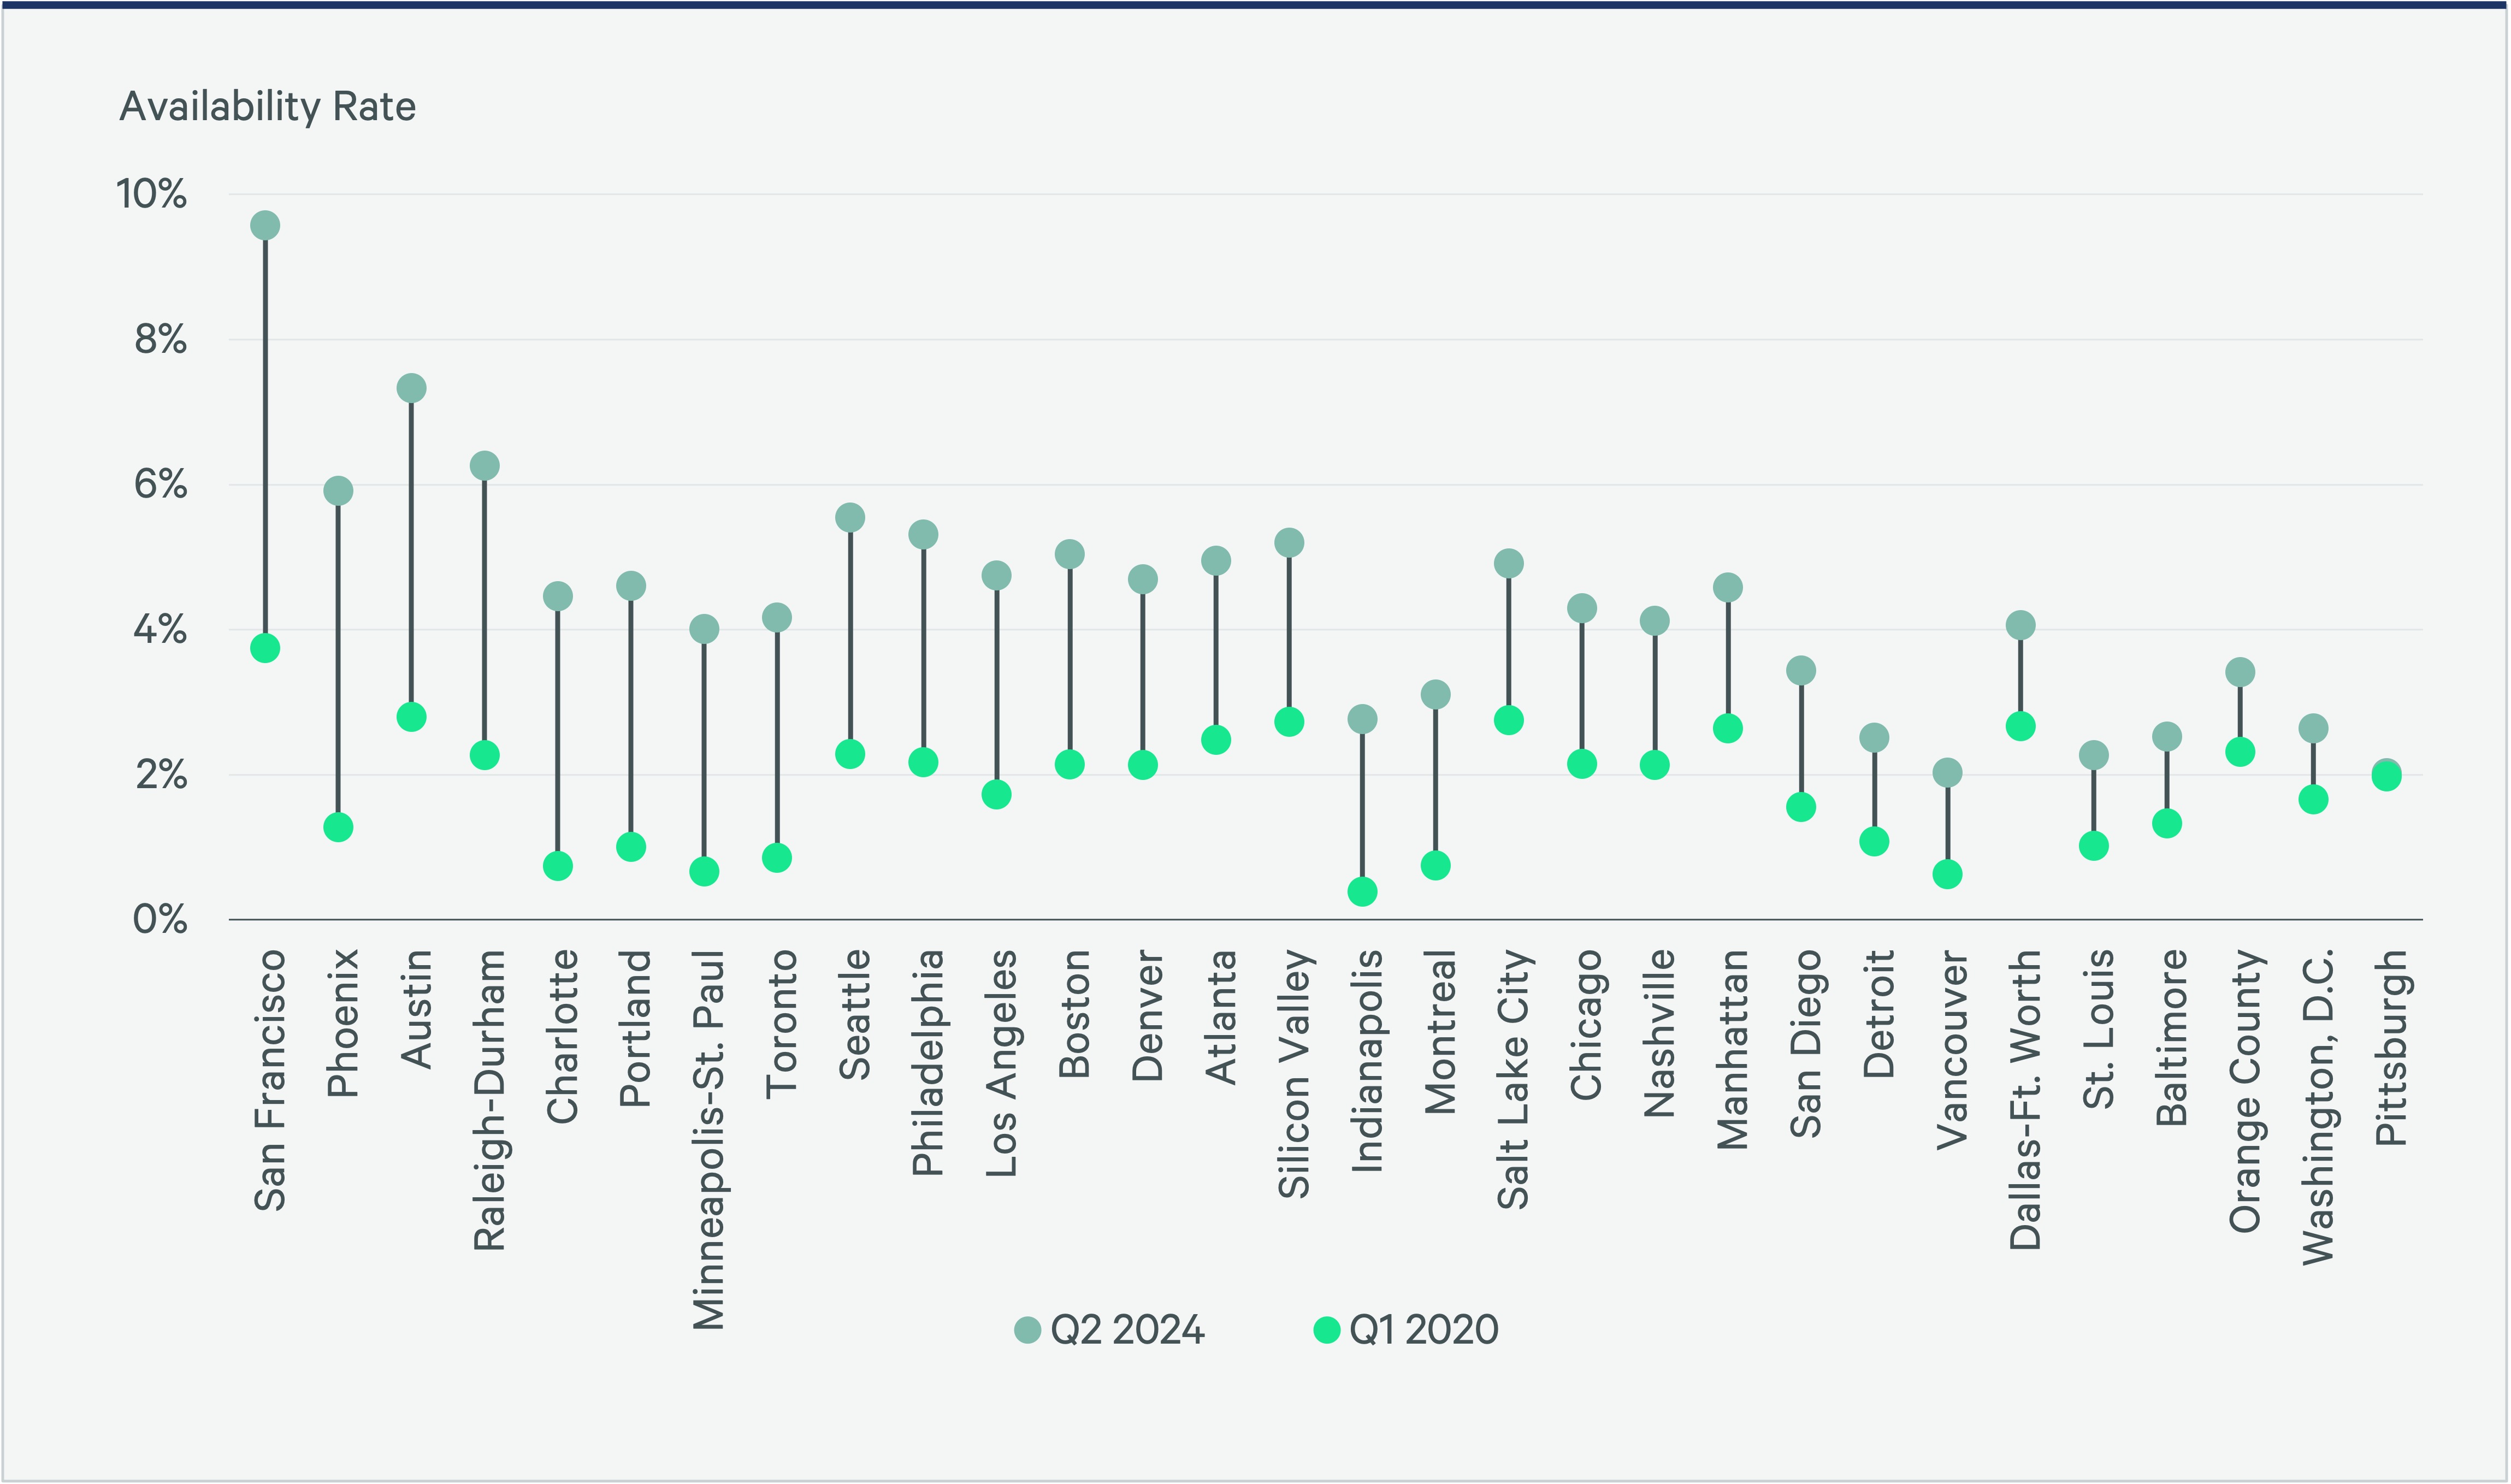
*Markets sorted by largest to smallest change in availability rate between Q1 2020 and Q2 2024.
27%
Proportion of available sublease space held by tech companies
Manhattan, Chicago, Los Angeles and Boston have the largest quantity (square footage) of sublease space, each with more than 10 million sq. ft. but none with a sublease availability rate exceeding 5% as of Q2 2024 (Figure 14). Indianapolis, Charlotte, Minneapolis-St. Paul, Phoenix and Toronto had the largest increase in sublease availability by square footage, up more than 80% between Q1 2020 and Q2 2024.
Figure 14: Office Sublease Available Space by Market*, Q2 2024
*Markets sorted by available sublease space sq. ft.
9.6%
San Francisco sublease availability rate
8.4M
Manhattan sublease space added since Q1 2020
Market Cycle Positioning
Real estate cycles influence investment and occupancy decisions. Markets generally move across four cycle phases at varying degrees, with some remaining in one cyclical phase for an extended period. Most Tech-30 markets entered the stabilization phase of the office market cycle in Q2 2024, characterized by moderate changes in vacancy and rents, rising demand and limited new supply (Figure 15).
Figure 15: Tech-30 Office Market Cycle
Tech Industry Indicators
CBRE finds that financial market trends are the best indicators of the tech industry’s growth prospects and monitoring them can provide clues as to the future direction of real estate demand.
Capital availability has been a harbinger of growth for the tech industry. VC funding is a key indicator of business viability at a tech company’s early growth stages. Therefore, capital flows into venture funds and venture-backed companies have heavily fueled private tech companies’ business and employment growth.
VC funding in the U.S. is likely to have its first growth year since 2021, due in large part to surging investments in AI companies, according to data from CB Insights (Figure 16). It is pacing to total $125 billion in 2024, which is about 20% more than 2023 and above the $123 billion average between 2018-2020.
Figure 16: U.S. Venture Capital Funding
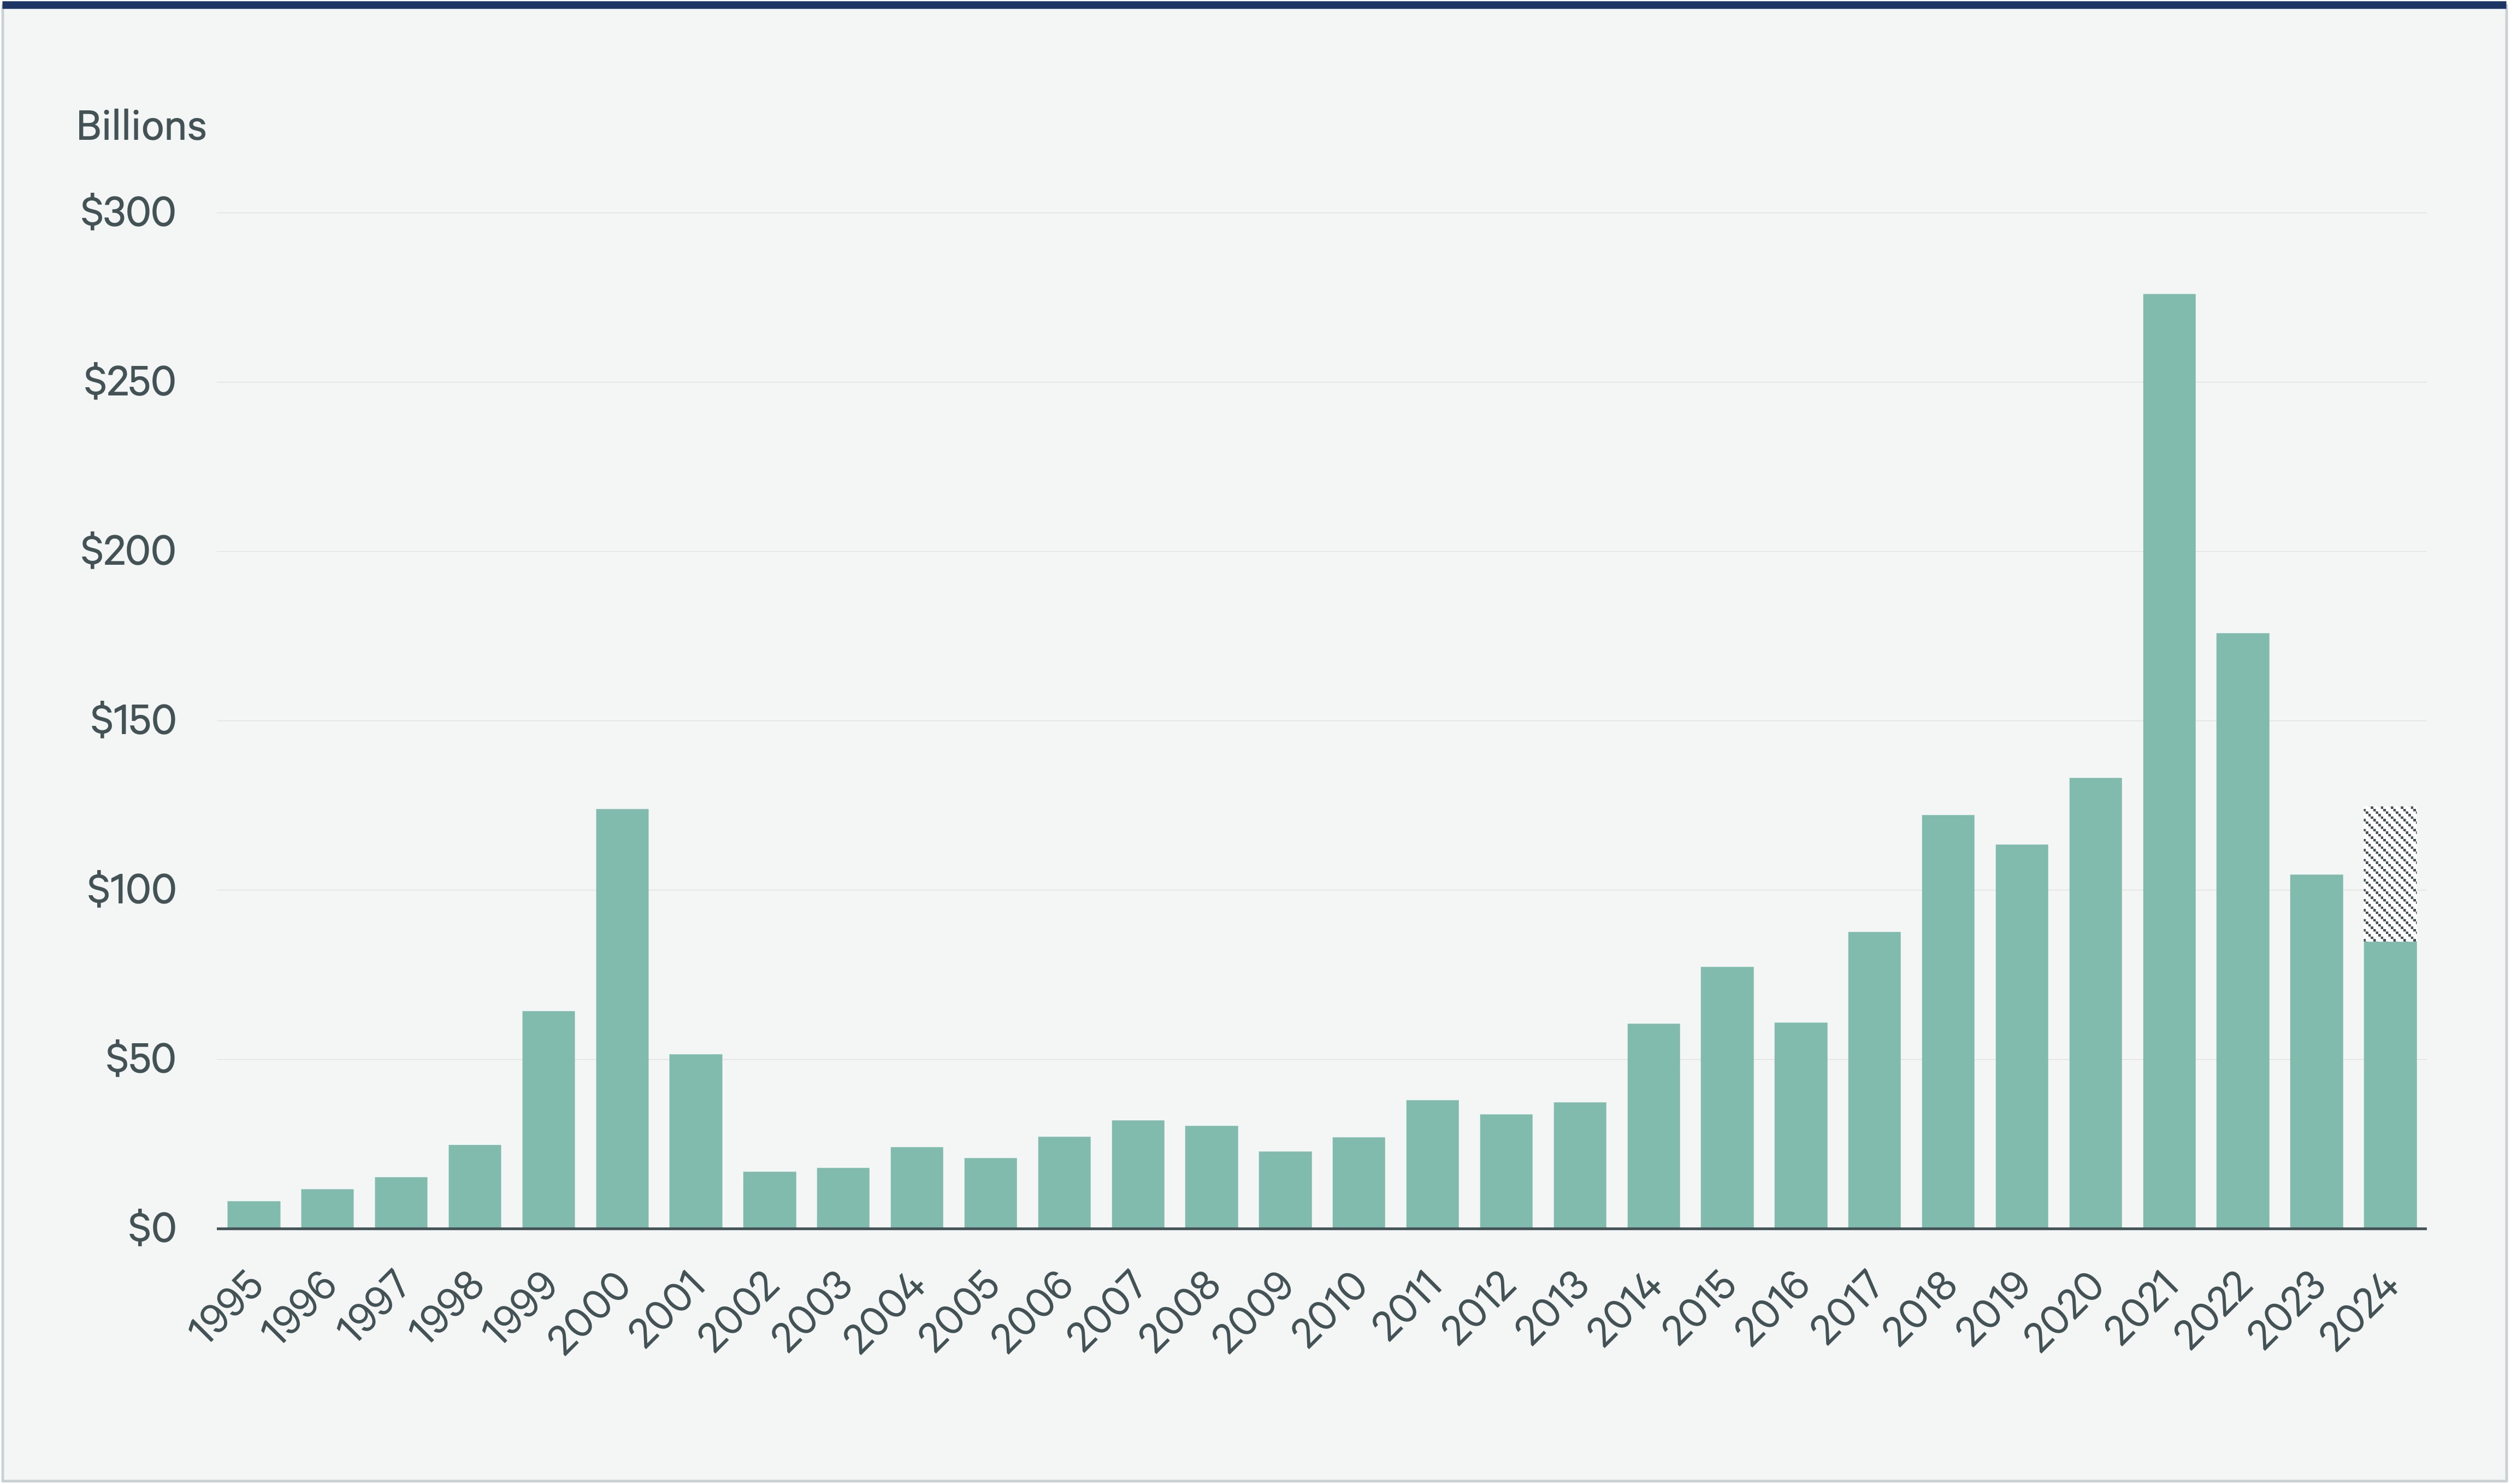
$125B
Expected VC funding total in 2024
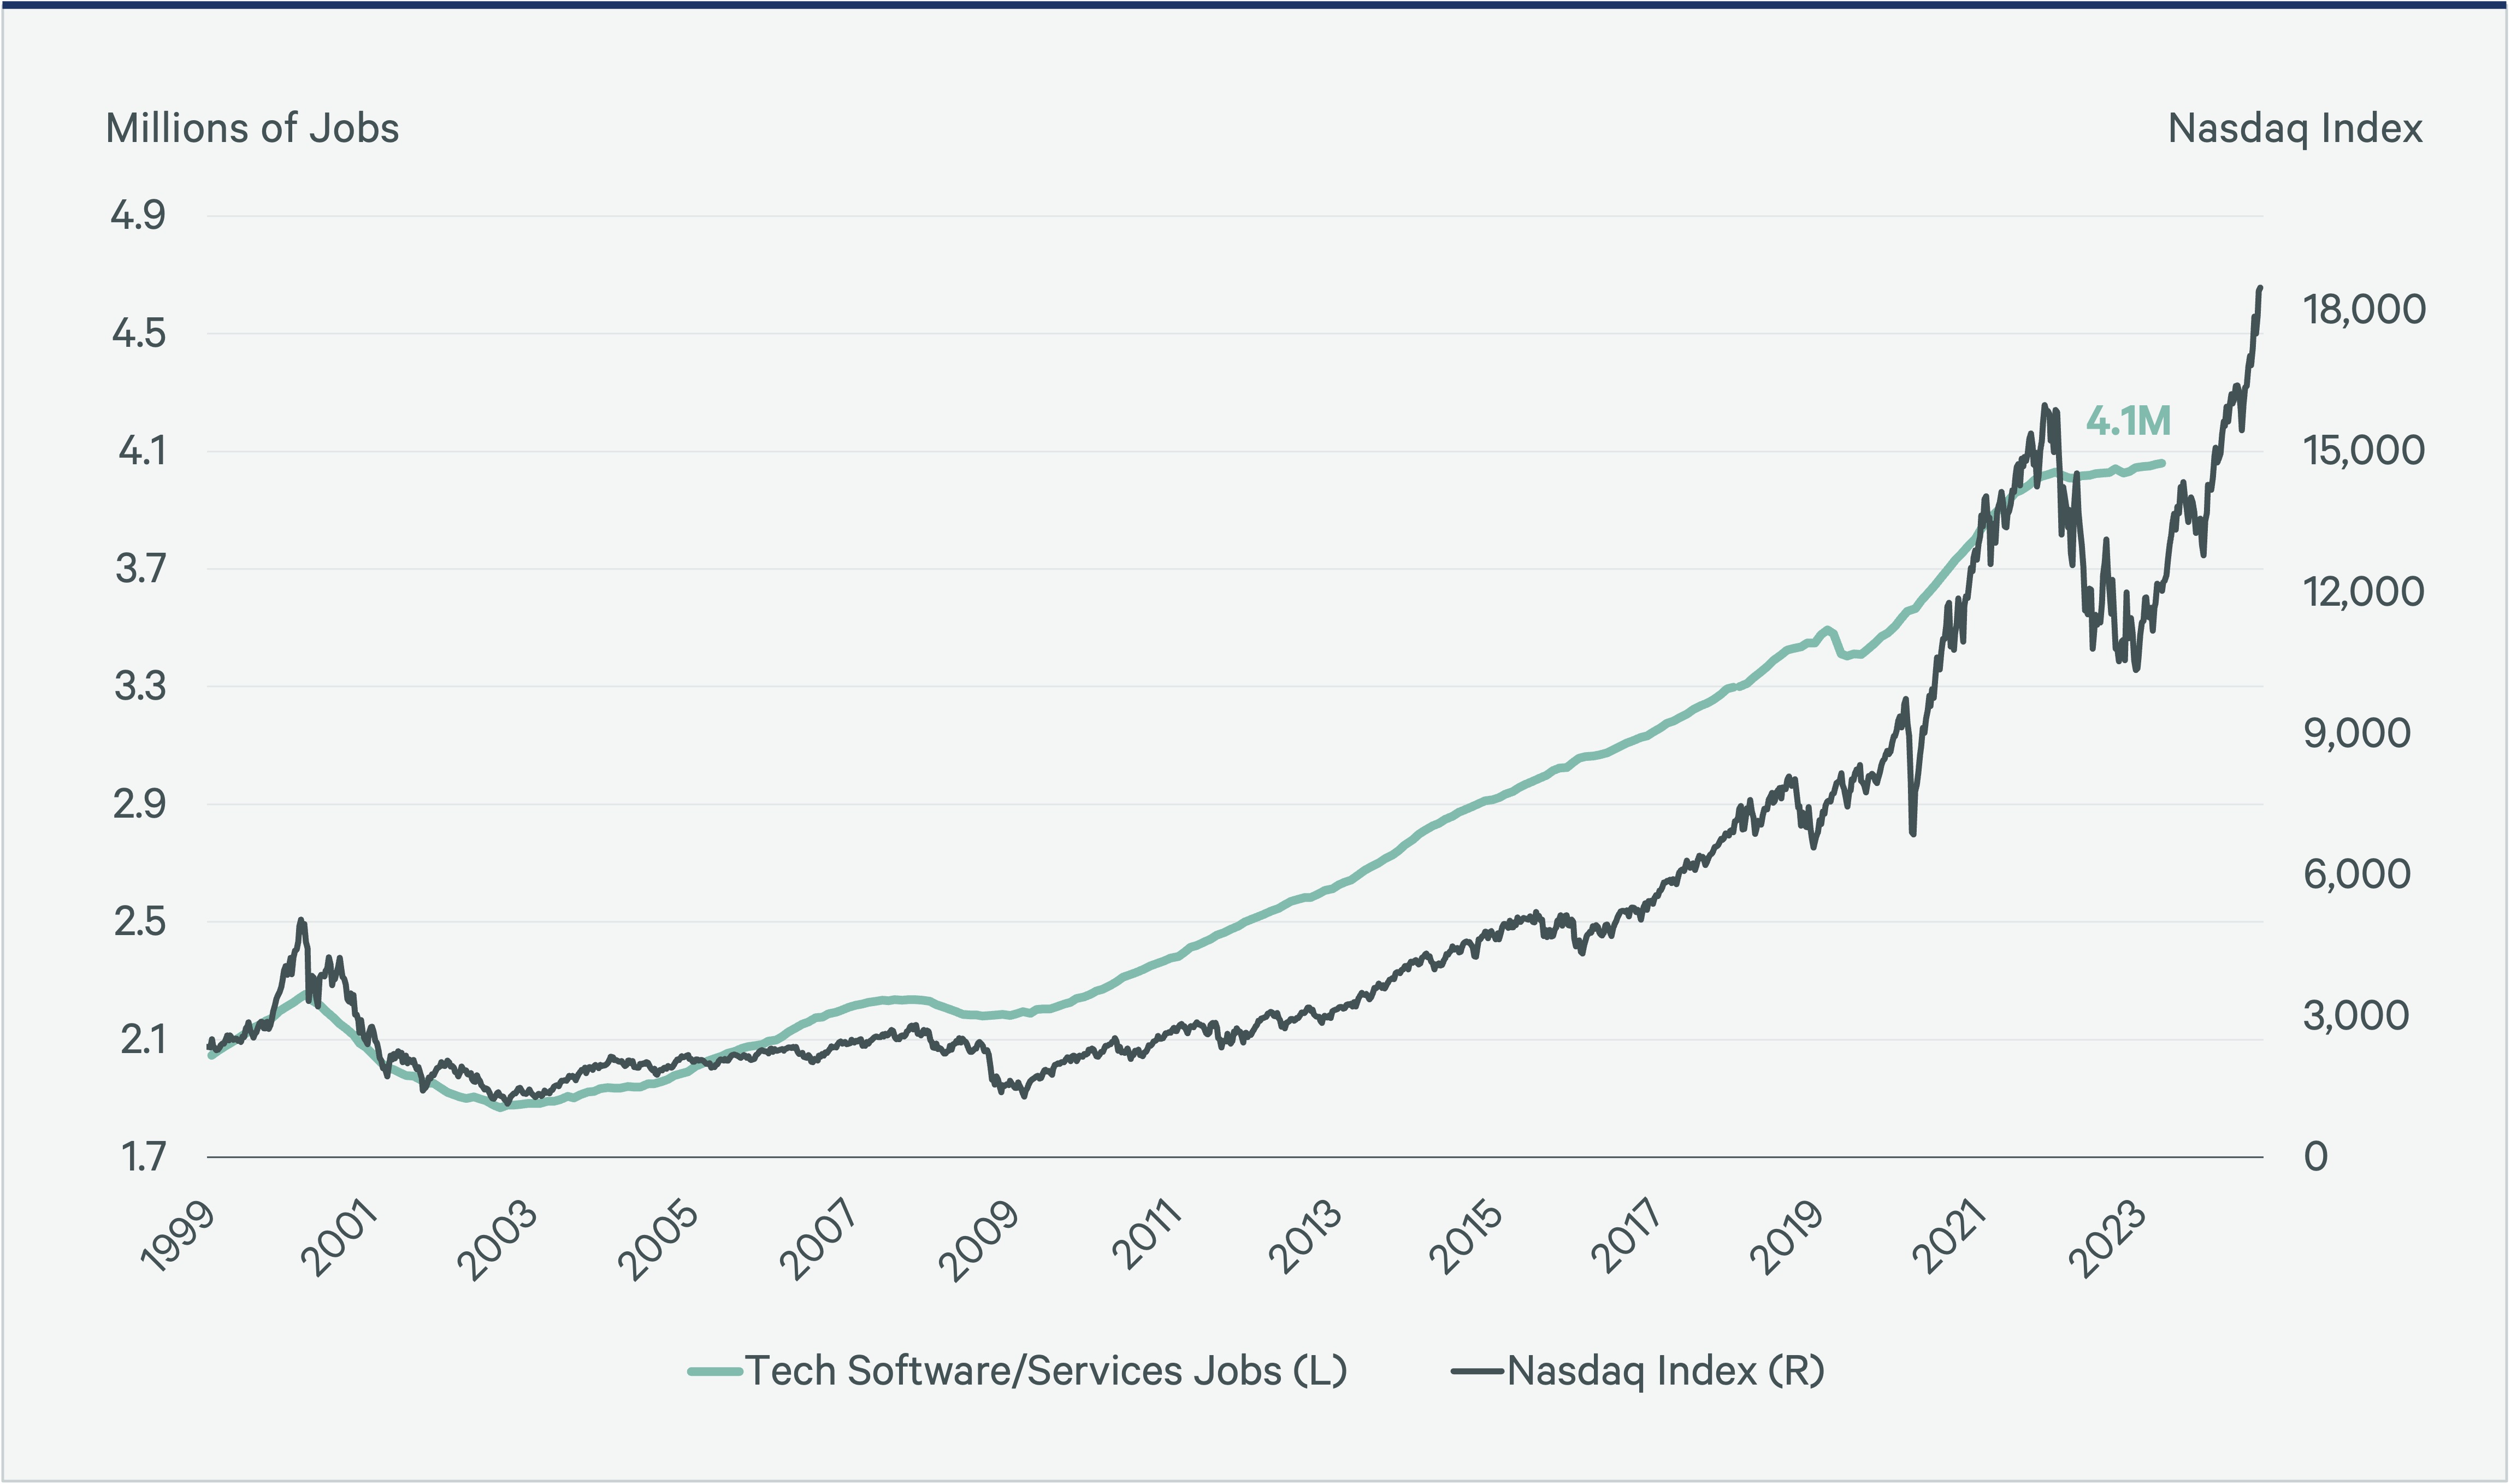
The Nasdaq Index has become a reliable indicator of tech business and employment activity, since it is heavily weighted by tech companies. Analysis of high-tech employment patterns suggests the Nasdaq Index acts as a 12-month leading indicator of employment levels at a 94% correlation (Figure 17). The Nasdaq’s extraordinary rise after its low in March 2020 was based on tech companies’ future earnings potential and pandemic-related growth. By 2022, these growth prospects dimmed, and the Nasdaq significantly sold off. The Nasdaq has rebounded since 2023, along with investor optimism for the tech industry. New AI technologies and areas of interest such as environmental sustainability offer significant long-term growth potential for the high-tech industry.
Figure 17: NASDAQ vs. Tech Employment
The Shiller S&P 500 Cyclically Adjusted Price-to-Earnings (CAPE) Ratio measures the broader equity market and is an important metric for gauging the financing environment and an economy’s overall health (Figure 18). Historically, an above-average ratio has preceded significant financial market corrections. The CAPE ratio increased by 19% over the past year (September 2023 to September 2024), as the market rallied ahead of interest rate cuts and anticipating the growth prospects for technology companies with AI-related business. The CAPE was 36 as of September 2024, below the 2021 and 2000 peaks of 38 and 44, respectively.
Figure 18: Shiller S&P 500 Cyclically Adjusted Price-to-Earnings (CAPE) Ratio
19%
Increase in CAPE ratio over the past year
Prospects for tech companies remain strong as the need for technological advancements grows with the global economy.
AI is one of the most anticipated technologies garnering substantial new investments ranging from VC funding to startups and very large capital expenditures by major public companies. AI enjoys some exuberance as it remains in the early stages but offers long-term growth potential.
The beginning of monetary policy easing should benefit the technology industry’s future growth. Many of the Tech-30 office markets will benefit from these trends in the years ahead when enough momentum is created to move real estate into the expansionary phase.
12 month
leading indicator of high-tech employment (Nasdaq Index)
36
CAPE ratio has increased slightly from 30 in 2023
Next 10 Markets to Watch
Figure 19: The Next 10 Tech Markets to Watch
Bubble size is based on tech concentration of office employment.
Source: U.S. Bureau of Labor Statistics, Statistics Canada, CoStar, CBRE Research, Q2 2024.
Related Insights
-

Demand for highly skilled workers is being driven by increased adoption of artificial intelligence and other cutting-edge technology. Explore top-ranked and up-and-coming tech talent markets.
-

A comprehensive analysis of tech labor supply, cost and quality in 75 global markets to help decision-makers fulfill critical business and innovation objectives.
-

There is an increased chance that the U.S. will avoid a recession and achieve a soft economic landing in 2024, but economic growth will slow and downside risks are elevated.
Related Services
- Industries
Tech, Communications & Entertainment
We provide proactive real estate solutions for technology, media and telecommunication companies at every stage.
- Services
Invest, Finance & Value
Get specialized advice and find investment opportunities to fuel your future.
- Services
Plan, Lease and Occupy
Drive value and growth with consulting and transaction services that align with your strategic goals.
- Manage Properties and Portfolios
Property Management
Maximize property performance with innovative management solutions, cutting-edge technology and unique amenities.
Contacts


Research


Investor & Occupier Services
Frank McCafferty
Executive Managing Director, Client Development