Future Cities
2022 Global Seaport Review: Hong Kong SAR, China
Navigating evolving global seaport regions and their impact on industrial real estate
December 13, 2022 4 Minute Read

Government investments will transform the Port of Hong Kong into a smart port. Its free trade policy, low tax regime and world-class professional services make it one of the most important transshipment hubs in Asia.
Overview
The Port of Hong Kong is one of the world’s 10 busiest container ports, though TEU volumes have declined since 2017. It faces stiff competition from ports in southern China and has lost market share to the Port of Shenzhen in recent years due to the latter’s lower cost and more efficient operation.
Despite slipping in both regional and global rankings, the port still holds significant weight in Hong Kong’s local economy. In 2019, it was estimated that the port and associated shipping and maritime services contributed HK$30.9 billion to Hong Kong’s economy, equivalent to 1.1% of total GDP. The port and related shipping and maritime services employed 81,500 people, or 2.1% of the territory’s total workforce.
In 2020, the government introduced initiatives to aid the port in the face of regional competition, including tax exemptions and concessions for certain ship lessors and leasing managers, and a 50% tax concession on the profits of marine insurance businesses.
Figure 1: TEU volumes
Source: CBRE Research, Port of Hong Kong, 2022.
Figure 2: Population demographics
Source: macrotrends.net, 2022.
A key global hub facing competition from other regional ports
Port features
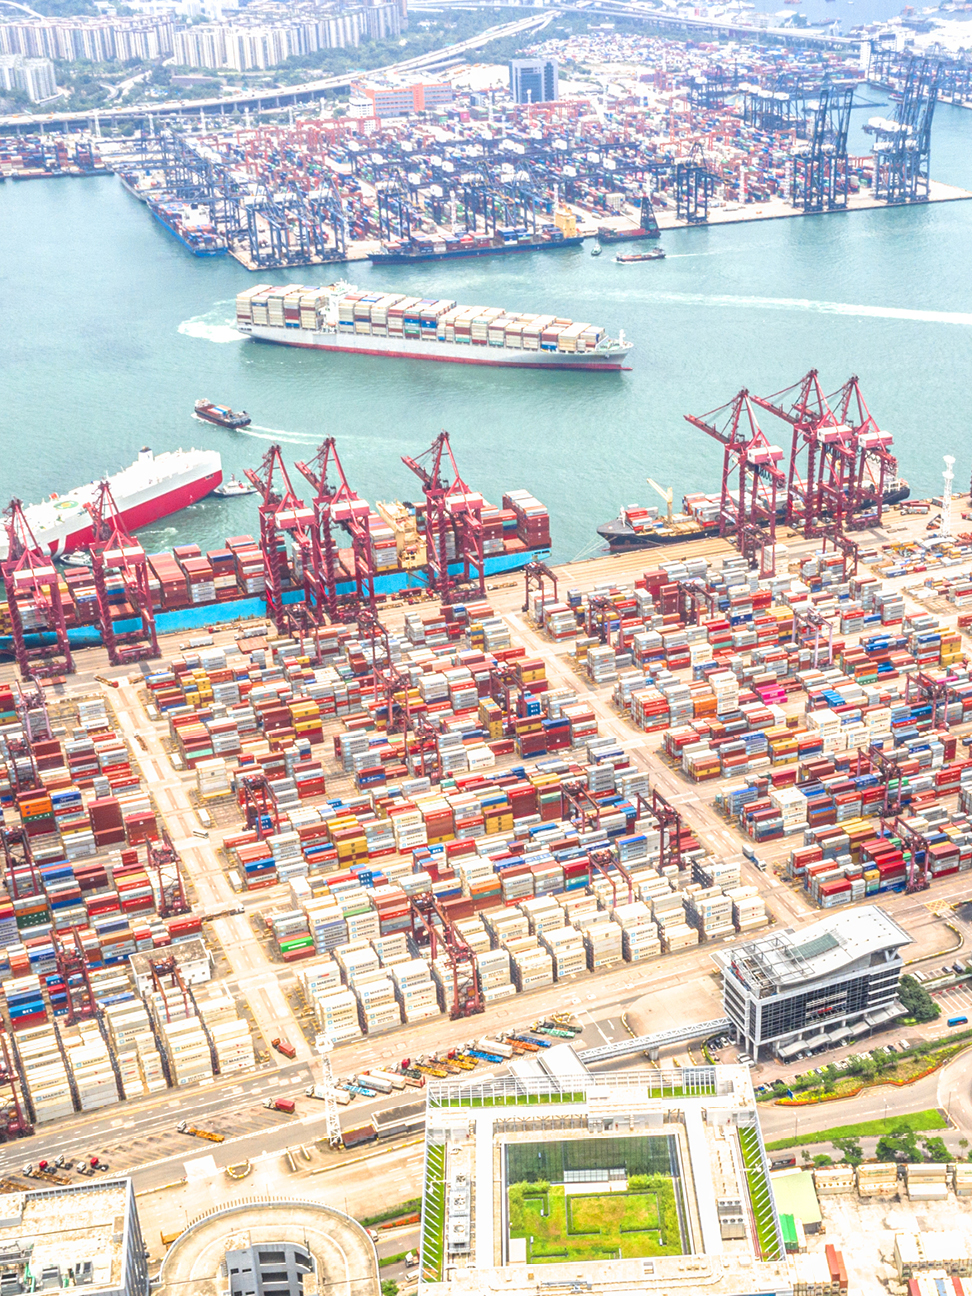
The main container terminal is in Kwai Tsing, a district west of Central Hong Kong. The 279-hectacre (689-acre) port has nine terminals, 24 berths and 96 quay cranes. Its quay length, at just under 7.8 kilometers, is smaller than others in the area.
Hongkong International Terminals has invested in automation, with Terminal 9 featuring remote control cranes and automated container stacking systems. In 2019, four operators formed the Hong Kong Seaport Alliance, which aims to build a smart green port. However, progress has been limited amid concerns over the investment required and the impact on profits.
Figure 3: Port details
Source: CBRE Research, Port of Hong Kong, 2022.
Trade partners
The port ranks sixth on the United Nations Port Liner Shipping Connectivity Index. However, its score has decreased for four consecutive quarters.
Mainland China is by far the port’s biggest trading partner, with more than 50% of cargo heading to or from the region. Taiwan, Malaysia, Japan, Vietnam, the U.S. and Singapore round out the top seven, with all other partners accounting for less than a quarter of trading volume.
Intermodal transportation
The port is a key intermodal gateway to southern China and the rest of the world. River transportation has become increasingly important, with more than 50% of containers bound for China travelling by river vessels. Hong Kong’s high-speed road network, along with its international airport and well-connected cross-boundary points, link the container terminals with various logistics nodes. Around 270 international container vessels sail to and from the port each week, connecting to nearly 600 destinations worldwide. In addition, the Hong Kong section of the Guangzhou-Shenzhen-Hong Kong Express Rail Link (XRL) offers direct rail services to 58 destinations in China.

Real estate influence
Demand has been subdued in recent years due to U.S.-China trade tensions and pandemic-related restrictions. Despite this, domestic requirements, including short-term government requirements, continue to drive leasing activity.
Although some 3PLs and retailers may consider restructuring global supply chains, other high-end logistics operations plan to expand in the city. The limited space and higher margins for carriers will encourage occupiers to consolidate and upgrade warehouses.
Amid sustained domestic demand, vacancy fell to 1.4% in Q2, while rents rose 2.5% quarter-over-quarter. Around 6.7 million sq. ft. of new warehouse supply is due to complete in 2022 and 2023, over half of which has been pre-leased or reserved for self-use. Strong demand will spur further development and redevelopment of existing space. Vacancy rates are poised to remain low, fueling solid rent growth for the foreseeable future.
Figure 4: Industrial & logistics market stats
Source: CBRE Research, H1 2022.
Explore Global Seaports by Port
Related Services
- Property Type
Industrial & Logistics
We represent the largest industrial real estate platform in the world, offering an integrated suite of services for occupiers and investors.
- Property Type
Ports
Manage all your integrated logistics needs with services that combine our industrial roots with extensive supply chain experience.
- Consulting
Supply Chain Advisory
CBRE Supply Chain Advisory helps you solve complex business problems and build distinct advantage through supply chain transformations.
APAC Research
Insights in Your Inbox
Stay up to date on relevant trends and the latest research.


