Future Cities
Where is Job Growth Accelerating? Shifting Employment Momentum in Top Metros
February 13, 2025 5 Minute Read

This brief analyzes recent job growth trends across U.S. metropolitan areas to provide insights for companies considering expansion or relocation. The Federal Reserve's recent shift to a less-restrictive monetary policy, following a period of rapid interest-rate increases, has created economic uncertainty. Understanding how job markets have performed during this period can help inform location decisions.
To this end, we compared total nonfarm job growth between December 2022 and December 2024, highlighting metros with the fastest overall growth and those experiencing the most significant acceleration in job creation. This data can help companies identify regions with robust labor markets, potentially indicating a thriving economy, a deep talent pool and favorable conditions for business growth.
It's important to note that this analysis provides only one piece of the puzzle. Site selection decisions involve numerous factors, including cost of living, infrastructure, access to markets and overall business climate. However, by understanding recent employment trends, companies can gain valuable insights as they evaluate potential locations.
Figure 1 presents the fastest-growing metros (with 250,000+ jobs) in December 2024. Figure 2 illustrates the change in job-growth momentum between the two periods analyzed, highlighting metros experiencing the most significant acceleration or deceleration.1
Momentum Shifts vs. Overall Growth
To illustrate the difference between total growth rate and momentum, the New Orleans, Louisiana, metro—with -0.6% job growth between December 2022 and December 2023 vs. 1.1% growth between December 2023 and December 2024, a percentage-point difference of +1.7—shows stronger positive momentum than the Charleston, South Carolina, metro, with a momentum shift of -1.9 over the same period (4.7% growth between 2022 and 2023 vs. 2.8% between 2023 and 2024). Charleston is the faster-growing market overall between 2023 and 2024, but New Orleans has more positive momentum, reversing job losses from the prior year.
Figure 1 shows the top 30 metros for total percent growth between December 2023 and December 2024, as well as their percentage-point shift between time periods.
Figure 1: Top 30 Metros for Percent Growth (More Than 250,000 Total Jobs, 2024)
Figure 2 shows the top 30 metros with the most positive momentum growth, ranked by their percentage-point shift between time periods.
Figure 2: Top 30 Metros for Positive Momentum Shift (More Than 250,000 Total Jobs, 2024)
Figure 3 shows the 30 metros with the most negative momentum growth, ranked by their percentage-point shift between time periods.
Figure 3: Top 30 Metros with the Most Negative Momentum Shift (More Than 250,000 Total Jobs, 2024)
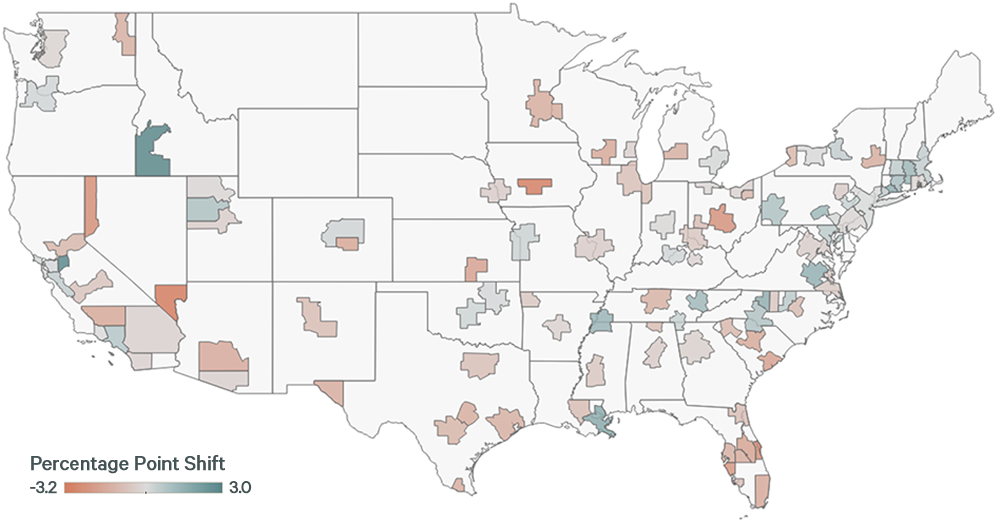
Figure 4 shows the metros (with more than 250,000 nonfarm jobs in 2024) with positive and negative momentum growth, highlighting how much they have shifted between time periods.
Figure 4: Map of Momentum Shift by Metro
What Does This Mean for Site-Location Decisions?
Employment levels fluctuate for many reasons, and discerning trends from two periods in time can be challenging. These figures show the markets where changes have been most pronounced during the period of elevated interest rates, providing useful context to companies as part of their broader site-selection strategy.
For more information on identifying and interpreting market signals before they become trends, please contact the Location Incentives Group.
Related Insights
-

Despite many uncertainties, the U.S. economy is poised for growth in 2025, driven by consumer spending, easing financial conditions and productivity gains.
-

CBRE’s vision for tomorrow’s cities focuses on sustainability and innovation. Explore our insights and shape the future.
-
Report | Future Cities
Measuring Market Momentum: Where is Population Growth Accelerating?
October 12, 2022

Comparing population growth over recent five-year periods can shed light on “sticky” trends that are most likely to impact site selection and talent attraction strategies.
Related Service
- Consulting
Location Incentives
Optimizing footprint decisions and reducing operational costs
Contacts
Tedd Carrison
Director, Advisory & Transaction Services | Location Incentives

Eric Stavriotis
Vice Chairman, Advisory & Transaction Services | Location Incentives

Christopher Schastok
Executive Vice President, Advisory & Transaction Services | Location Incentives