Intelligent Investment
The Times They Are a-changin’ as More Markets Clear Their Hurdle Rate
Chart of the Week
September 26, 2024 2 Minute Read

Receive EA Insights Directly in your Inbox
CBRE Econometric Advisors’ hurdle rate model is a useful tool to help investors identify opportunities to achieve risk-adjusted returns. A hurdle rate reflects the return required to justify an investment in a sector or market, taking into account such risk factors as volatility, liquidity and income risk.
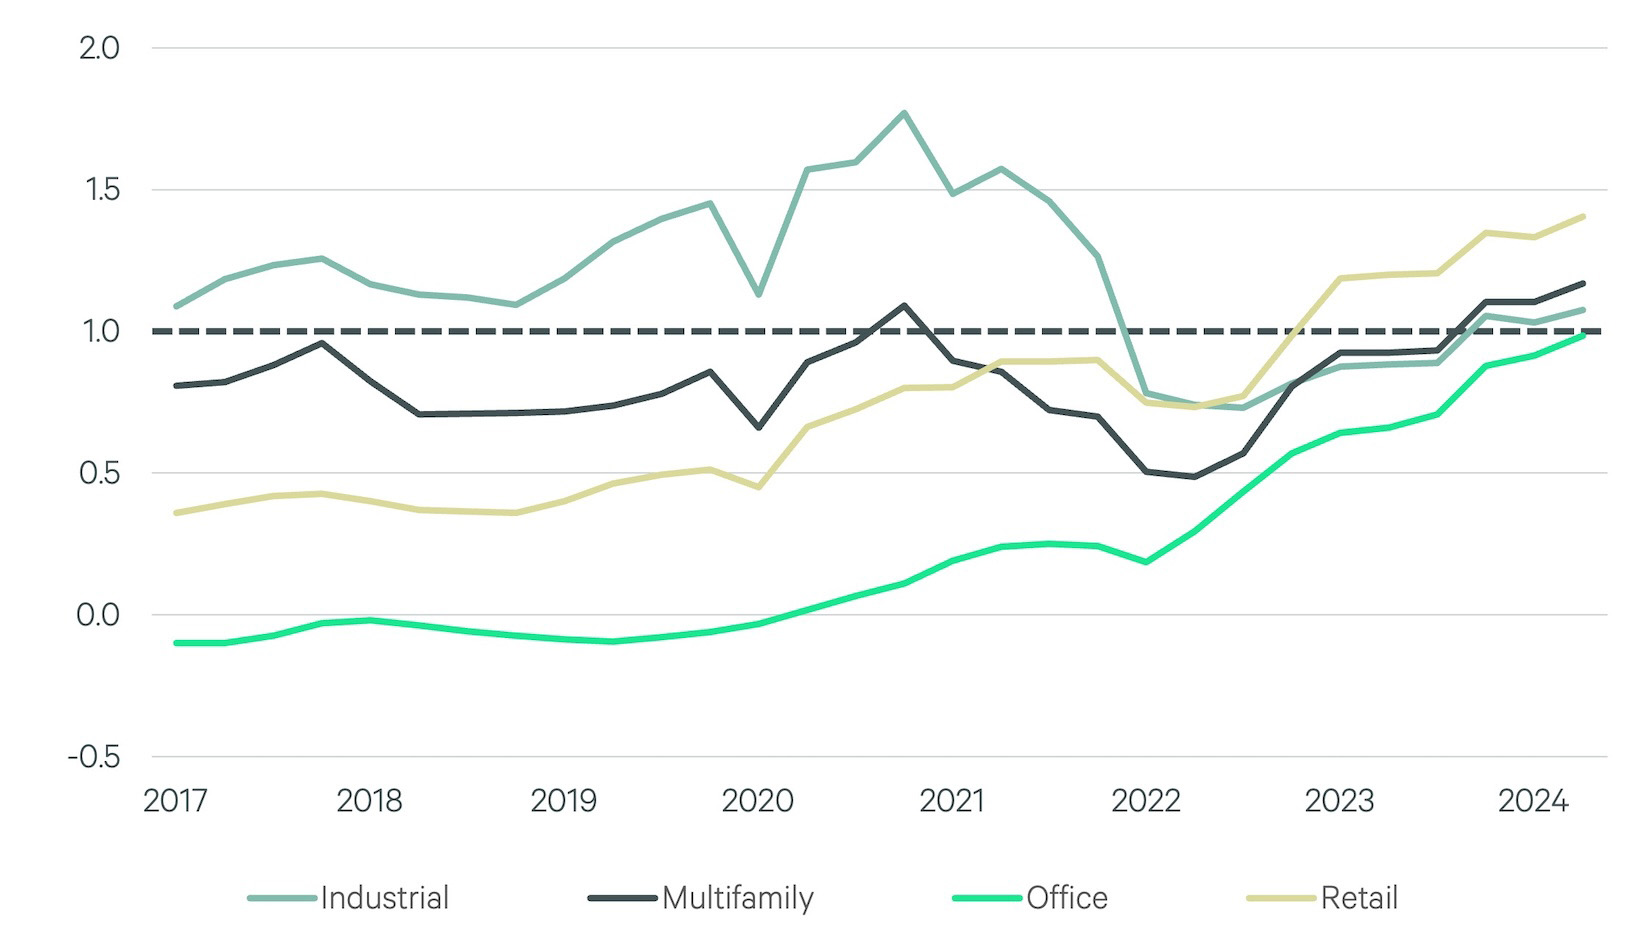
The graph below shows how the relationship between the expected 10-year returns—ex-post and forecasted— and the hurdle rate across sectors has changed over time. A score above ‘1’ indicates that the 10-year outlook exceeds the required hurdle rate.
In hindsight, only industrial markets exceeded ‘1’ because the 10-year outlook included the years of dramatic yield expansion across property sectors from 2022-2024. Today, the value loss is largely behind us for most sectors and, as a result, more markets are entering investable territory. The office sector is an exception. A surgical approach is required in many office markets, where elevated vacancy rates and lingering delinquencies have kept projected returns below the required hurdle rate.
Figure 1: Ratio of Expected Returns (Ex-post and Forecast) to Estimated Hurdle Rate
Contacts
Dennis Schoenmaker, Ph.D.
Executive Director & Principal Economist, CBRE Econometric Advisors