Intelligent Investment
Retail Availability: Perception Versus Reality
Chart of the Week
April 28, 2025 2 Minute Read

Receive EA Insights Directly in your Inbox
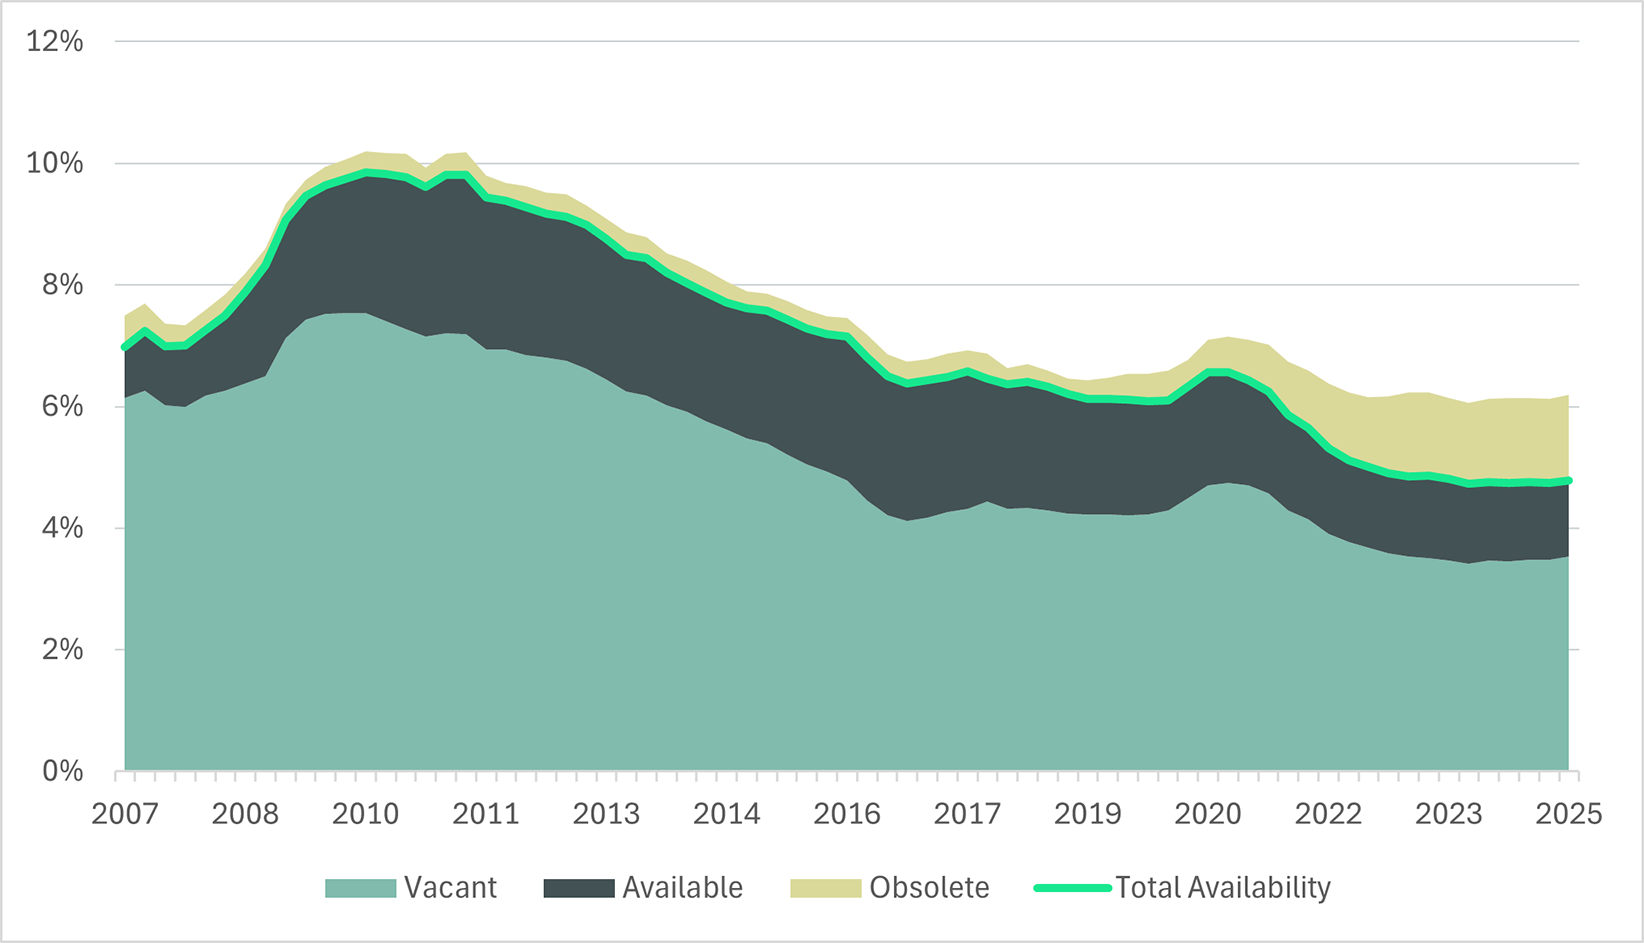
The U.S. retail market has faced increasingly limited availability in recent years. From 2010 to 2024, the U.S. retail footprint grew by just 10%, compared with an 11.6% increase between 2005 and 2009. Tepid new development has led to a record low availability rate of 4.8% in Q1 2025.
However, perceptions about the retail market are often colored by a growing supply of obsolete space, which has tripled since 2020. Most of this space is uninhabitable by retailers. Including it in availability only pushes the rate up to 6.2%.
Overall, the paucity of available space has given landlords significant leverage in lease negotiations. Retail rents rose 2.4% Y-o-Y in Q4 2024, outstripping the 10-year average of 2%. Even if higher tariffs shake consumer and retailer confidence, rents are likely to march higher in the face of limited availability.
Figure 1: Availability, Vacancy, and Obsolescence Rates (%)