Intelligent Investment
Post-COVID Office Sales Volumes Break With Historical Trends
Chart of the Week
April 17, 2025 2 Minute Read

Receive EA Insights Directly in your Inbox
It makes intuitive sense. More capital is attracted to a sector as vacancy falls.
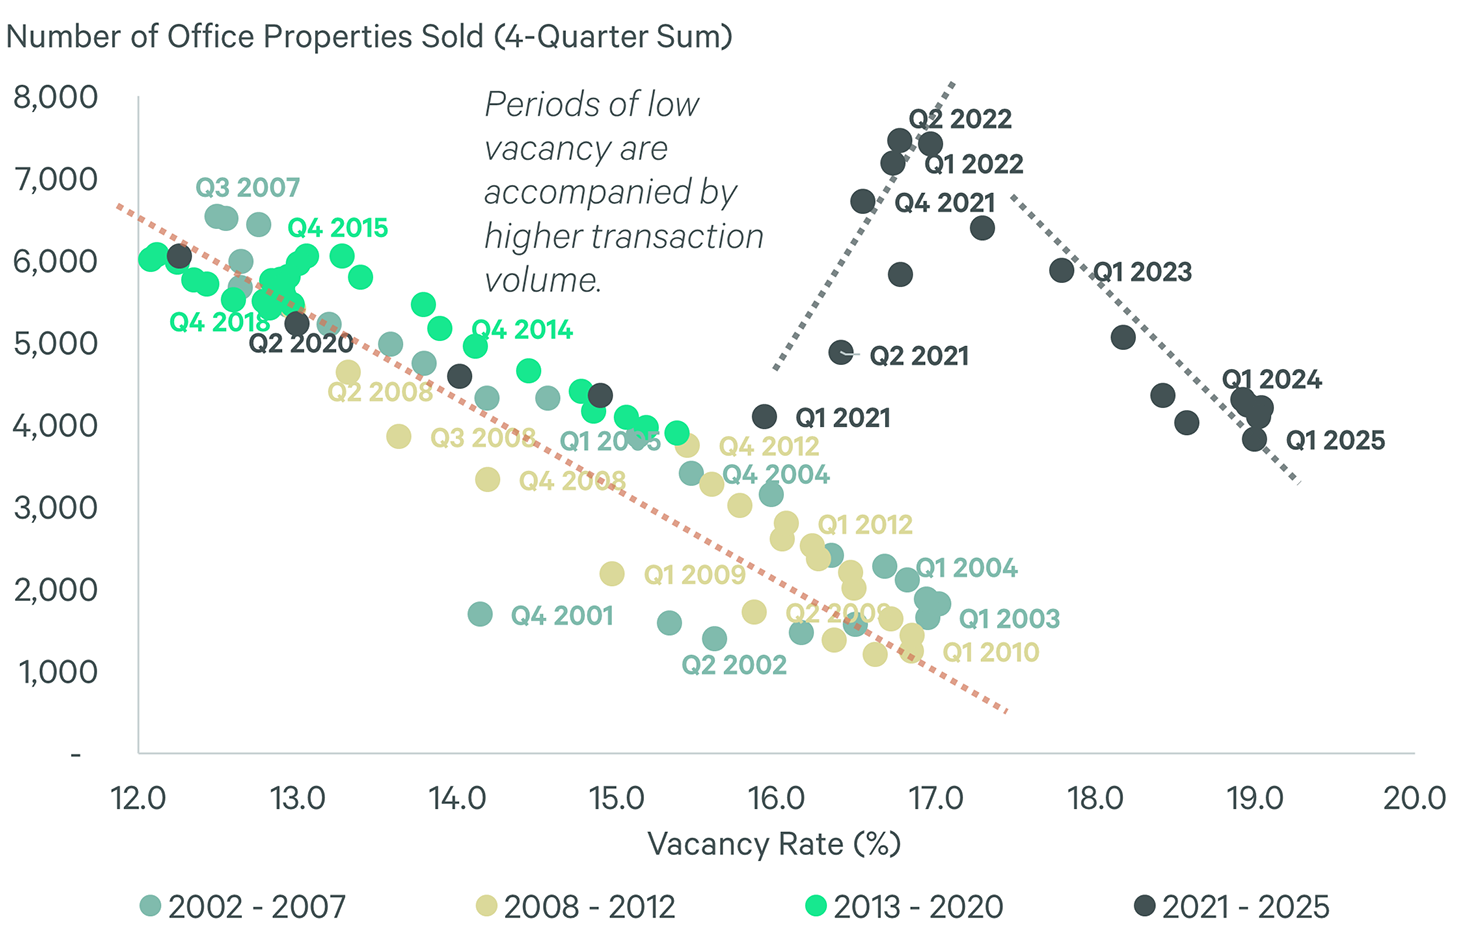
The below graph illustrates how this trend has played out with office assets over the past two-plus decades. Trading volume was quite high in 2007 and between 2015 and 2018—periods when office availability was tight and capital markets accommodative. Conversely, the early 2000s and the post-Global Financial Crisis years were marked by weaker occupancy and investment markets.
The post-COVID era has broken with this precedent. Ultra-low interest rates persuaded investors to overlook historically high office vacancy in 2021 and 2022, boosting sales volume. The investment boom was brought about by a surge in private buyers who purchased smaller assets that were easier to finance and had sturdier occupier fundamentals than the larger properties that institutional capital typically favors. For instance, 78% of buildings smaller than 50,000 sq. ft. have an occupancy level of 90% or more, compared to just 45% of buildings greater than 800,000 sq. ft. Eventually, higher interest rates and weaker capital markets outweighed the allure of smaller assets and transactions fell from 2022 through to Q1 2025.
Figure 1: Number of Office Properties Sold (4-Quarter Rolling Sum) Relative to U.S. Market Vacancy Rate (%), per MSCI Real Capital Analytics.